Precision motion systems specialist Allient (NASDAQ:ALNT) met Wall Street’s revenue expectations in Q3 CY2024, but sales fell 13.8% year on year to $125.2 million. Its GAAP profit of $0.13 per share was 271% above analysts’ consensus estimates.
Is now the time to buy Allient? Find out by accessing our full research report, it’s free.
Allient (ALNT) Q3 CY2024 Highlights:
- Revenue: $125.2 million vs analyst estimates of $124.5 million (in line)
- EPS: $0.13 vs analyst estimates of $0.04 ($0.10 beat)
- EBITDA: $13.06 million vs analyst estimates of $12.08 million (8.1% beat)
- Gross Margin (GAAP): 31.4%, down from 32.7% in the same quarter last year
- Operating Margin: 5.3%, down from 8.1% in the same quarter last year
- EBITDA Margin: 10.4%
- Free Cash Flow Margin: 8.4%, up from 5.6% in the same quarter last year
- Market Capitalization: $316.3 million
“Our focus on improving margin and operational efficiencies has driven solid sequential improvements, even as we navigate softer demand in key industrial and vehicle markets,” said Dick Warzala, Chairman and CEO.
Company Overview
Founded in 1962, Allient (NASDAQ:ALNT) develops and manufactures precision and specialty-controlled motion components and systems.
Electronic Components
Like many equipment and component manufacturers, electronic components companies are buoyed by secular trends such as connectivity and industrial automation. More specific pockets of strong demand include data centers and telecommunications, which can benefit companies whose optical and transceiver offerings fit those markets. But like the broader industrials sector, these companies are also at the whim of economic cycles. Consumer spending, for example, can greatly impact these companies’ volumes.
Sales Growth
A company’s long-term performance can indicate its business quality. Any business can put up a good quarter or two, but many enduring ones grow for years. Thankfully, Allient’s 9% annualized revenue growth over the last five years was decent. This is a useful starting point for our analysis.
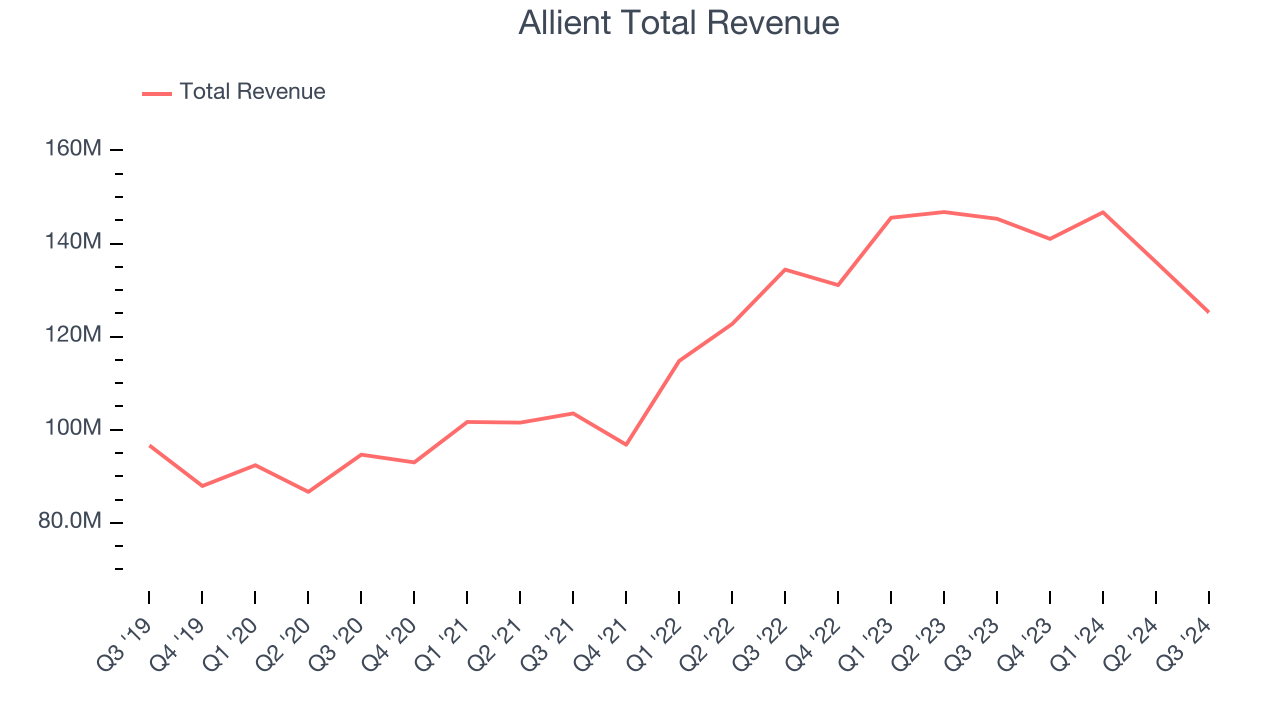
Long-term growth is the most important, but within industrials, a half-decade historical view may miss new industry trends or demand cycles. Allient’s annualized revenue growth of 8.2% over the last two years aligns with its five-year trend, suggesting its demand was stable. 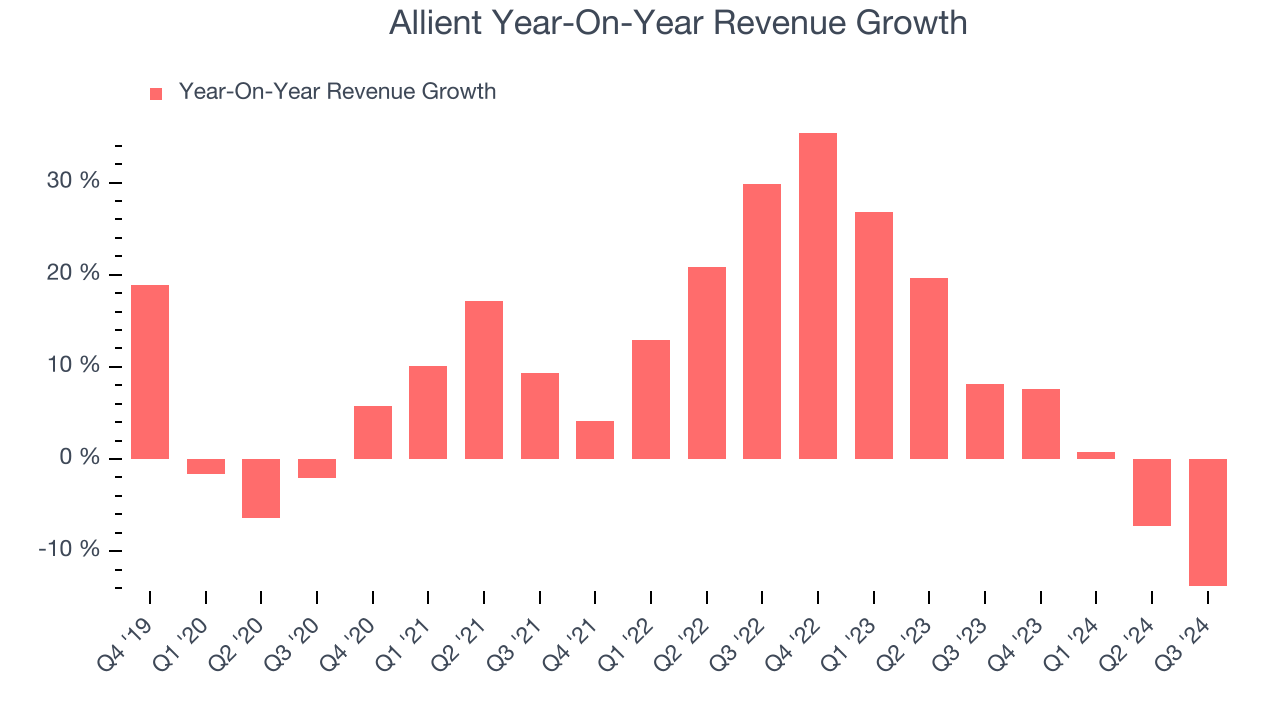
This quarter, Allient reported a rather uninspiring 13.8% year-on-year revenue decline to $125.2 million of revenue, in line with Wall Street’s estimates.
Looking ahead, sell-side analysts expect revenue to decline 5.1% over the next 12 months, a deceleration versus the last two years. This projection doesn't excite us and shows the market thinks its products and services will see some demand headwinds.
When a company has more cash than it knows what to do with, buying back its own shares can make a lot of sense–as long as the price is right. Luckily, we’ve found one, a low-priced stock that is gushing free cash flow AND buying back shares. Click here to claim your Special Free Report on a fallen angel growth story that is already recovering from a setback.
Operating Margin
Operating margin is a key measure of profitability. Think of it as net income–the bottom line–excluding the impact of taxes and interest on debt, which are less connected to business fundamentals.
Allient was profitable over the last five years but held back by its large cost base. Its average operating margin of 6.8% was weak for an industrials business.
Looking at the trend in its profitability, Allient’s annual operating margin might have seen some fluctuations but has generally stayed the same over the last five years, meaning it will take a fundamental shift in the business to change.
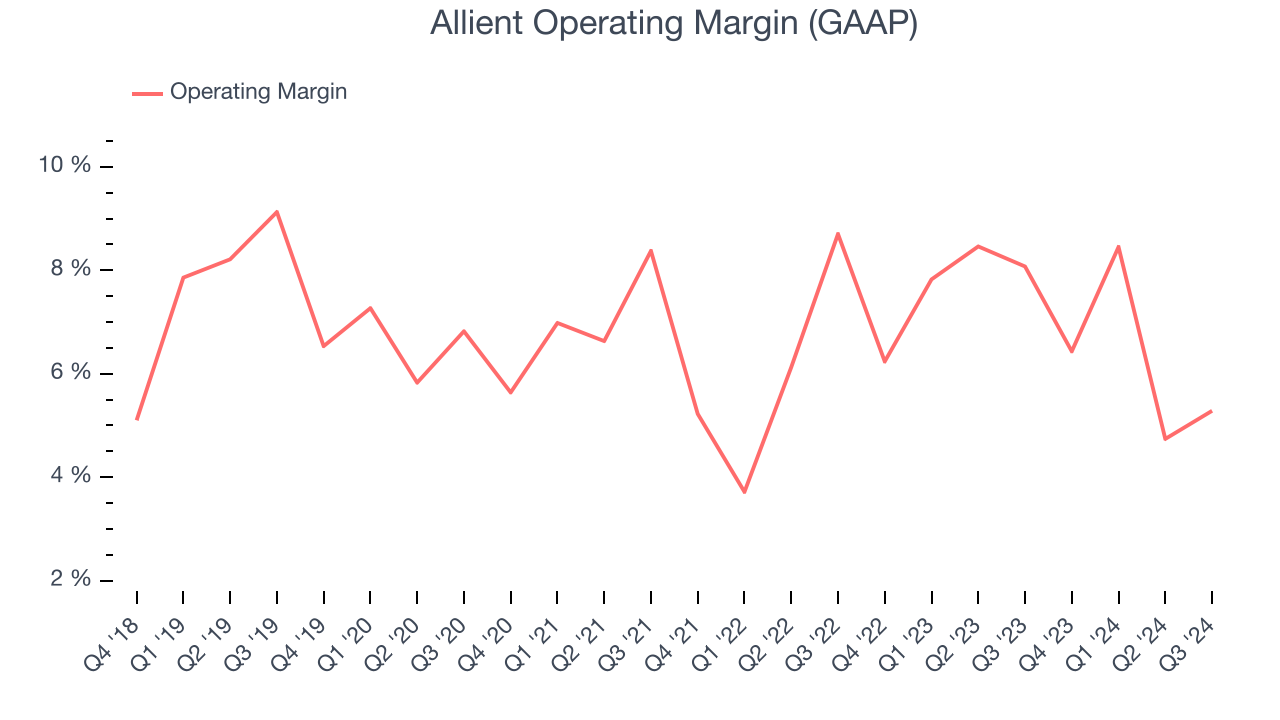
In Q3, Allient generated an operating profit margin of 5.3%, down 2.8 percentage points year on year. Since Allient’s operating margin decreased more than its gross margin, we can assume it was recently less efficient because expenses such as marketing, R&D, and administrative overhead increased.
Earnings Per Share
We track the long-term change in earnings per share (EPS) for the same reason as long-term revenue growth. Compared to revenue, however, EPS highlights whether a company’s growth was profitable.
Sadly for Allient, its EPS declined by 5.2% annually over the last five years while its revenue grew by 9%. However, its operating margin didn’t change during this timeframe, telling us that non-fundamental factors affected its ultimate earnings.
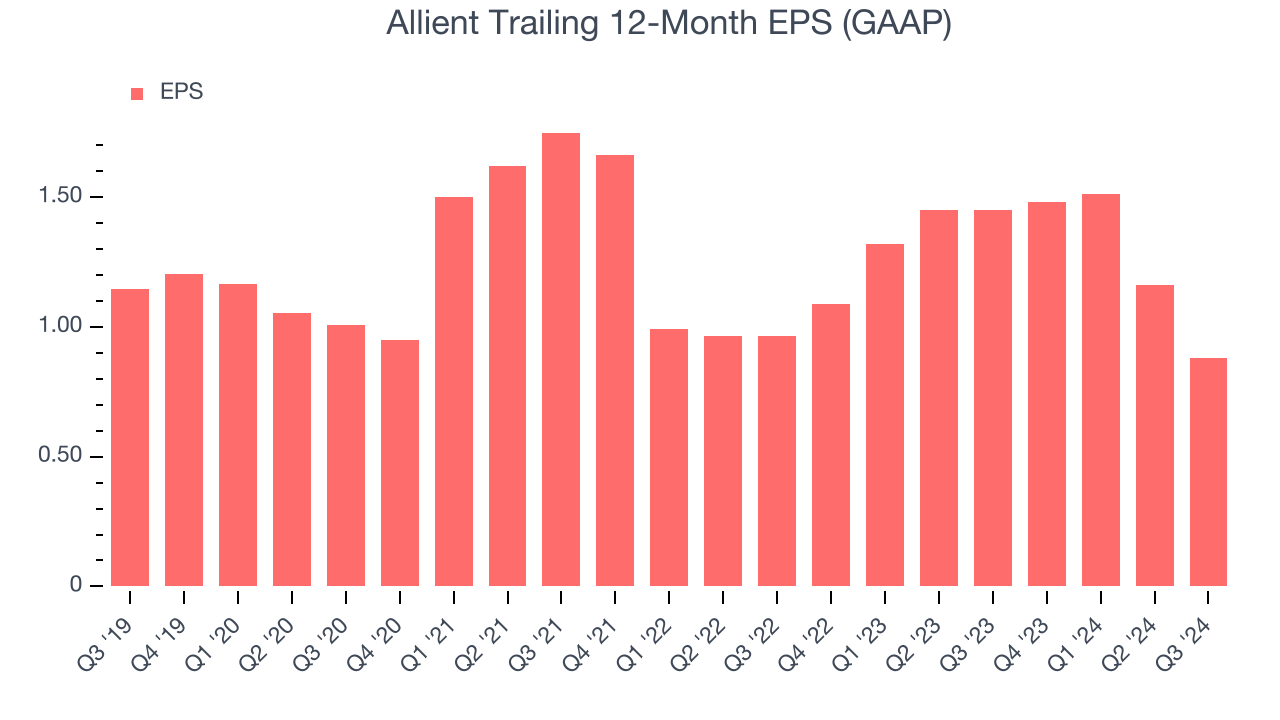
Diving into the nuances of Allient’s earnings can give us a better understanding of its performance. A five-year view shows Allient has diluted its shareholders, growing its share count by 17%. This has led to lower per share earnings. Taxes and interest expenses can also affect EPS but don’t tell us as much about a company’s fundamentals. 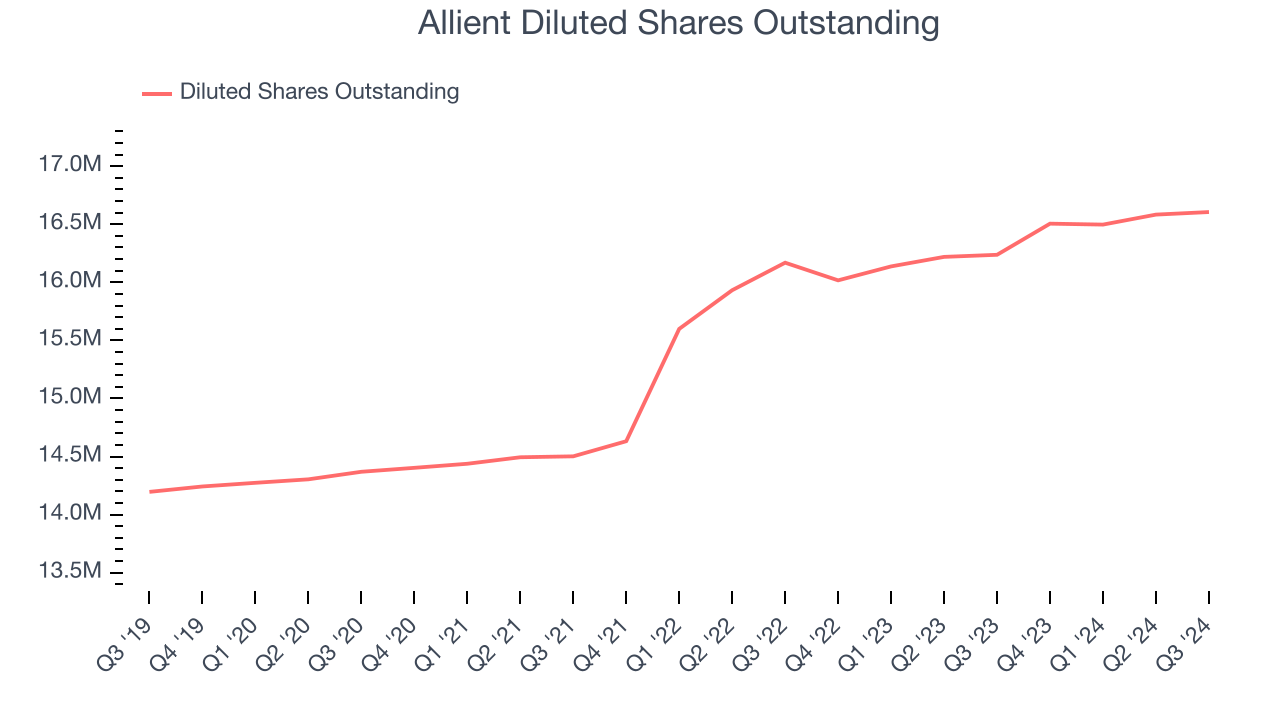
Like with revenue, we analyze EPS over a shorter period to see if we are missing a change in the business.
For Allient, its two-year annual EPS declines of 4.4% are similar to its five-year trend. These results were bad no matter how you slice the data.In Q3, Allient reported EPS at $0.13, down from $0.41 in the same quarter last year. Despite falling year on year, this print easily cleared analysts’ estimates. We also like to analyze expected EPS growth based on Wall Street analysts’ consensus projections, but there is insufficient data.
Key Takeaways from Allient’s Q3 Results
We were impressed by how significantly Allient blew past analysts’ EPS expectations this quarter. We were also excited its EBITDA outperformed Wall Street’s estimates. Zooming out, we think this was a good quarter with some key areas of upside. The stock traded up 5% to $21.50 immediately after reporting.
Allient put up rock-solid earnings, but one quarter doesn’t necessarily make the stock a buy. Let’s see if this is a good investment. We think that the latest quarter is only one piece of the longer-term business quality puzzle. Quality, when combined with valuation, can help determine if the stock is a buy. We cover that in our actionable full research report which you can read here, it’s free.
