
Maker of machinery employed in semiconductor manufacturing, Applied Materials (NASDAQ:AMAT) reported Q1 CY2024 results topping analysts' expectations, with revenue flat year on year at $6.65 billion. The company also expects next quarter's revenue to be around $6.65 billion, slightly above analysts' estimates. It made a non-GAAP profit of $2.09 per share, improving from its profit of $2.00 per share in the same quarter last year.
Applied Materials (AMAT) Q1 CY2024 Highlights:
- Revenue: $6.65 billion vs analyst estimates of $6.54 billion (1.7% beat)
- EPS (non-GAAP): $2.09 vs analyst estimates of $1.99 (5.3% beat)
- Revenue Guidance for Q2 CY2024 is $6.65 billion at the midpoint, above analyst estimates of $6.58 billion (EPS (non-GAAP) guidance of $2.01 also slightly ahead of expectations of $1.99)
- Gross Margin (GAAP): 47.4%, up from 46.7% in the same quarter last year
- Inventory Days Outstanding: 148, up from 147 in the previous quarter
- Free Cash Flow of $1.14 billion, down 45.8% from the previous quarter
- Market Capitalization: $180.7 billion
Founded in 1967 as the first company to develop tools for other businesses in the semiconductor industry, Applied Materials (NASDAQ:AMAT) is the largest provider of semiconductor wafer fabrication equipment.
Applied Materials is the only semiconductor manufacturing (capital) equipment maker who provides tools used in each of the processes used to create semiconductors. Roughly half its systems’ revenues come from deposition technologies, with another 30% from cleaning or removal systems.
Applied Materials counts among its customers the biggest chip makers in the world: TSMC, Intel, Samsung, and Micron, although it tilts more towards foundry and logic chip makers than memory producers.
Its primary peers and competitors are ASML (NASDAQ:ASML), Lam Research (NASDAQ:LCRX), KLA Corp (NASDAQ: KLAC), and Tokyo Electron (TSE:8035).Semiconductor Manufacturing
The semiconductor capital (manufacturing) equipment group has become highly concentrated over the past decade. Suppliers have consolidated, and the increasing cost of innovation have made it unaffordable to almost everybody, except the largest companies, to produce leading edge chips. The result of the increased industry concentration has been higher operating margins and free cash generation through the cycle. Despite this structural improvement, the businesses can still be quite volatile, as demand fluctuations for the semiconductor equipment are magnified by the already cyclical nature of underlying semiconductor demand.
Sales Growth
Applied Materials's revenue growth over the last three years has been unremarkable, averaging 11% annually. As you can see below, this was a weaker quarter for the company, with revenue growing from $6.63 billion in the same quarter last year to $6.65 billion. Semiconductors are a cyclical industry, and long-term investors should be prepared for periods of high growth followed by periods of revenue contractions (which can sometimes offer opportune times to buy).
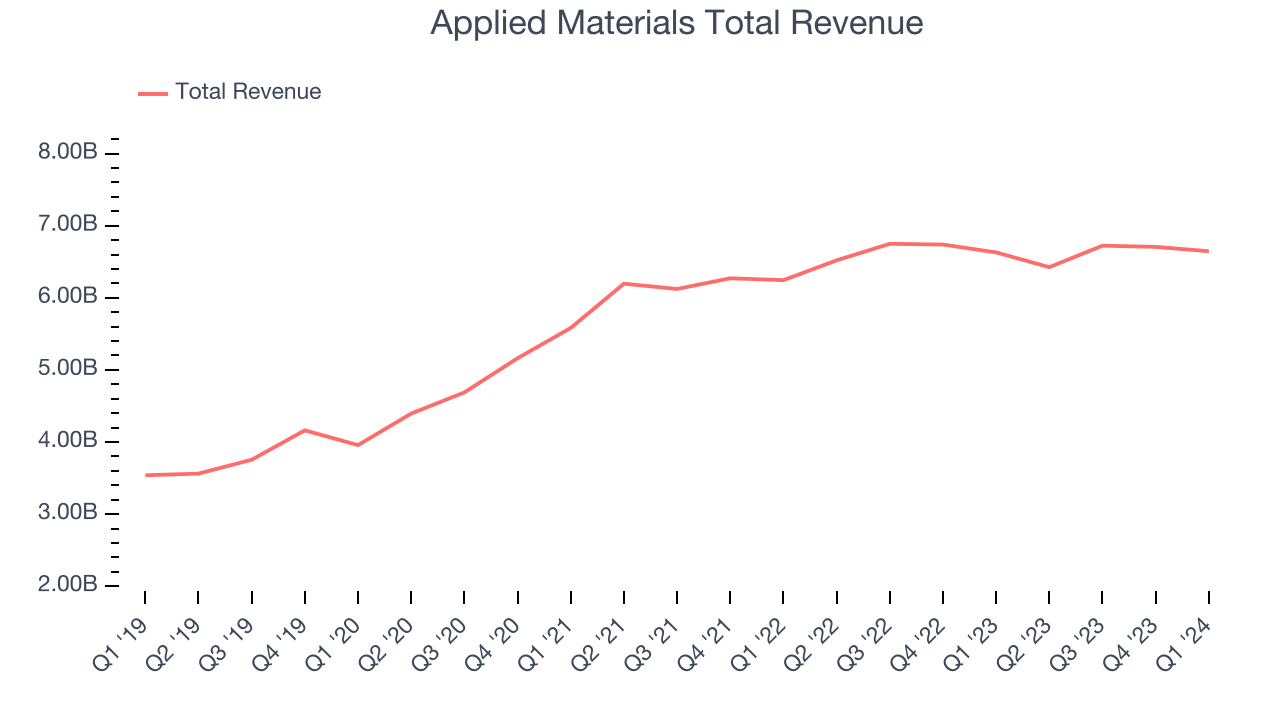
While Applied Materials beat analysts' revenue estimates, this was a sluggish quarter for the company as its revenue only grew 0.2% year on year. Applied Materials's growth, however, flipped from negative to positive this quarter. This encouraging sign will likely be welcomed by shareholders.
Applied Materials returned to positive revenue growth this quarter and its management team expects the trend to continue. The company is guiding to 3.5% year-on-year growth next quarter, and analysts seem to agree, forecasting 5.5% growth over the next 12 months.
Product Demand & Outstanding Inventory
Days Inventory Outstanding (DIO) is an important metric for chipmakers, as it reflects a business' capital intensity and the cyclical nature of semiconductor supply and demand. In a tight supply environment, inventories tend to be stable, allowing chipmakers to exert pricing power. Steadily increasing DIO can be a warning sign that demand is weak, and if inventories continue to rise, the company may have to downsize production.
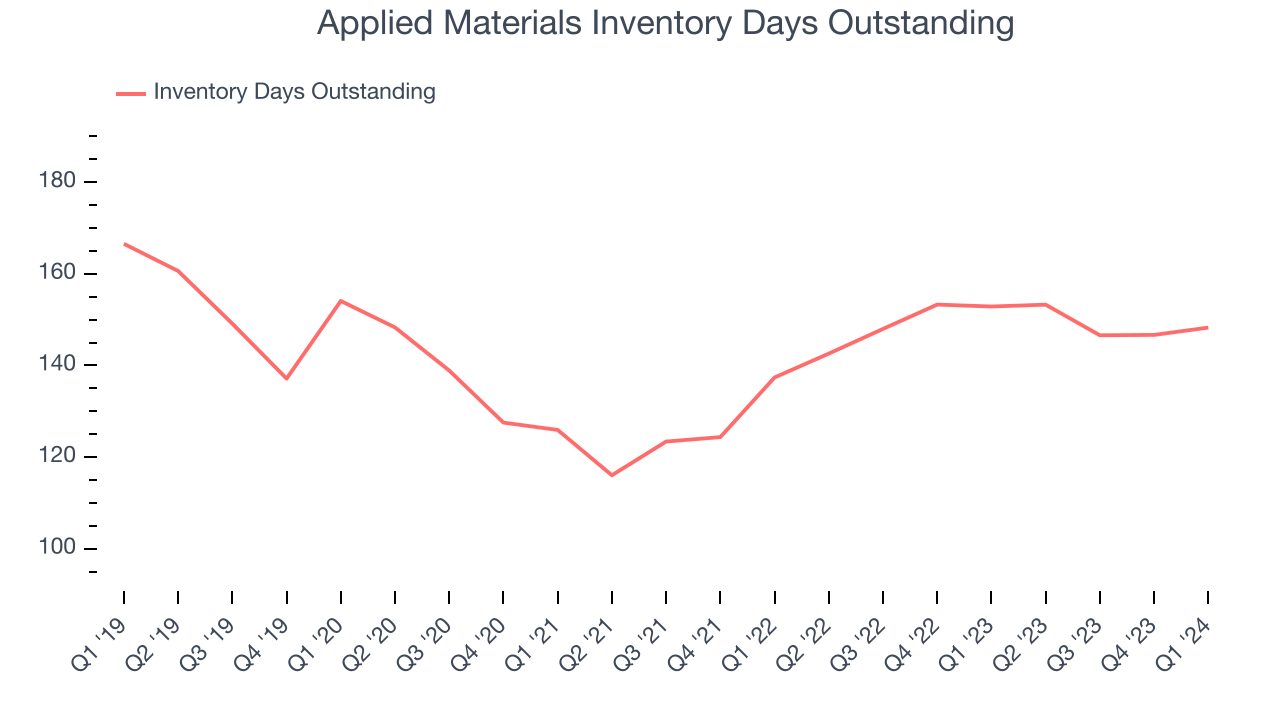
This quarter, Applied Materials's DIO came in at 148, which is 7 days above its five-year average, suggesting that the company's inventory has grown to higher levels than we've seen in the past.
Pricing Power
In the semiconductor industry, a company's gross profit margin is a critical metric to track because it sheds light on its pricing power, complexity of products, and ability to procure raw materials, equipment, and labor. Applied Materials's gross profit margin, which shows how much money the company gets to keep after paying key materials, input, and manufacturing costs, came in at 47.4% in Q1, up 0.8 percentage points year on year.
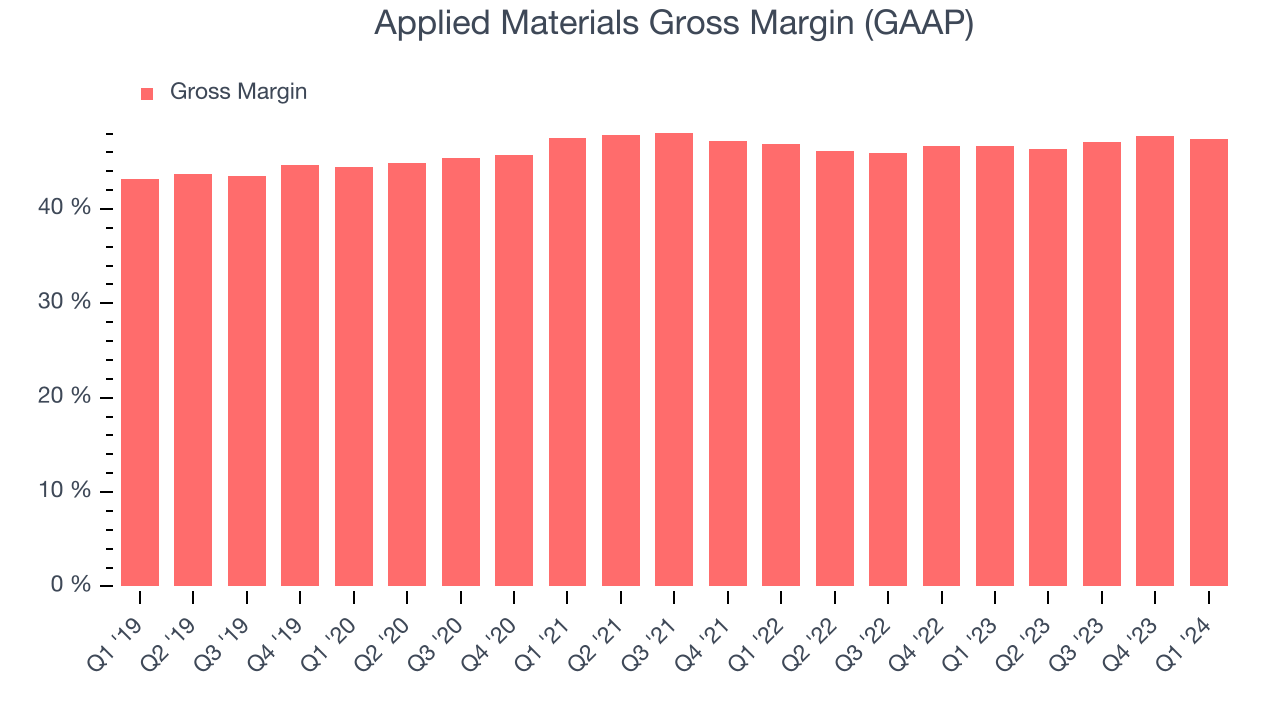
Applied Materials's gross margins have been trending up over the last 12 months, averaging 47.2%. This is a welcome development, as Applied Materials's margins are slightly below the peer group average and rising margins could suggest improved demand and pricing power.
Profitability
Applied Materials reported an operating margin of 0.1% in Q1, down 29 percentage points year on year. Operating margins are one of the best measures of profitability because they tell us how much money a company takes home after manufacturing its products, marketing and selling them, and, importantly, keeping them relevant through research and development.
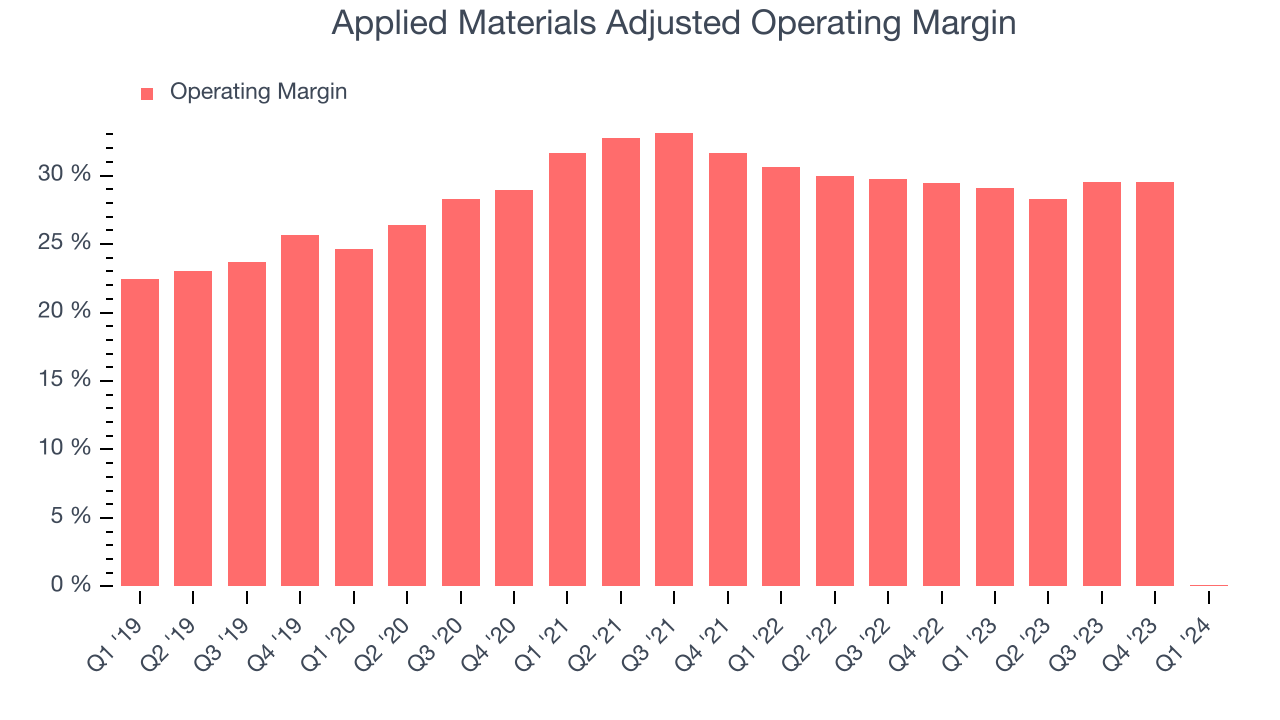
Applied Materials's operating margins have been trending down over the last year, averaging 21.8%. This is a bad sign for Applied Materials, whose margins are already below average for semiconductor companies. To its credit, however, the company's margins suggest modest pricing power and cost controls.
Earnings, Cash & Competitive Moat
Analysts covering Applied Materials expect earnings per share to be relatively flat over the next 12 months, although estimates will likely change after earnings.
Although earnings are important, we believe cash is king because you can't use accounting profits to pay the bills. Applied Materials's free cash flow came in at $1.14 billion in Q1, down 44.3% year on year.
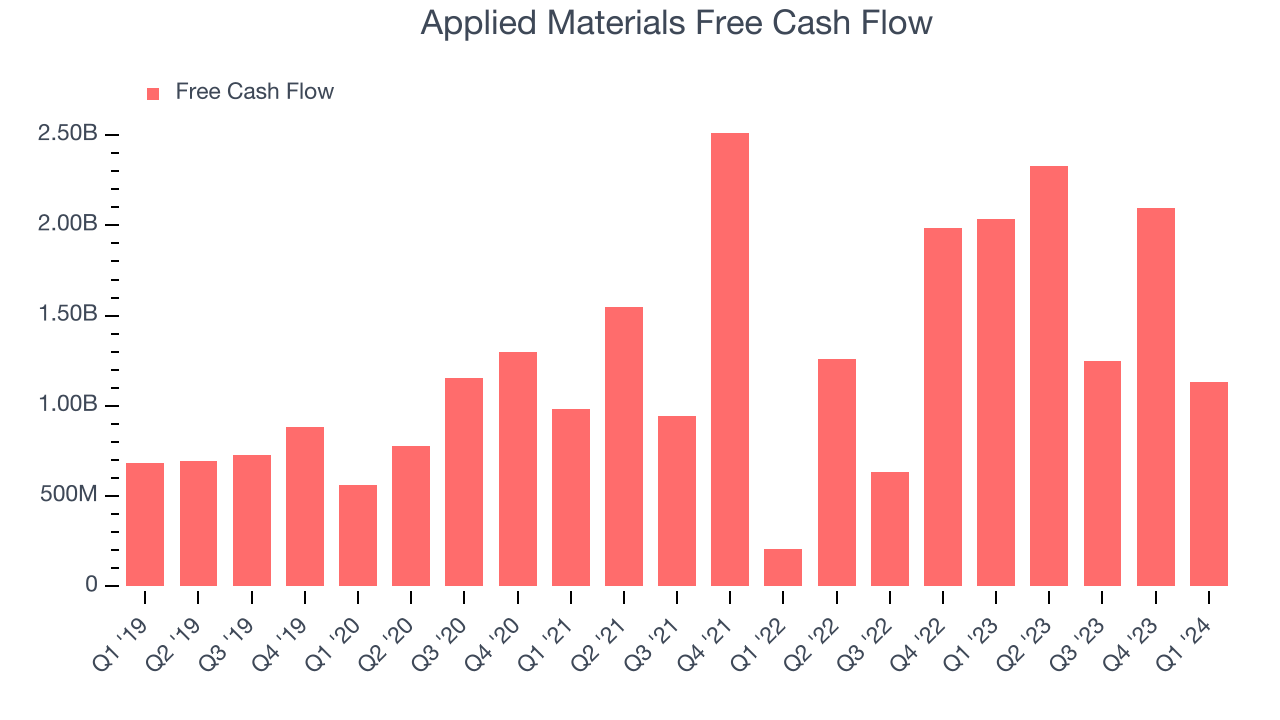
As you can see above, Applied Materials produced $6.81 billion in free cash flow over the last 12 months, an eye-popping 25.7% of revenue. This is a great result; Applied Materials's free cash flow conversion places it among the best semiconductor companies and, if sustainable, puts the company in an advantageous position to invest in new products while remaining resilient during industry downturns.
Return on Invested Capital (ROIC)
EPS and free cash flow tell us whether a company was profitable while growing revenue. But was it capital-efficient? A company’s ROIC explains this by showing how much operating profit a company makes compared to how much money the business raised (debt and equity).
Applied Materials's five-year average ROIC was 44.5%, placing it among the best semiconductor companies. Just as you’d like your investment dollars to generate returns, Applied Materials's invested capital has produced excellent profits.
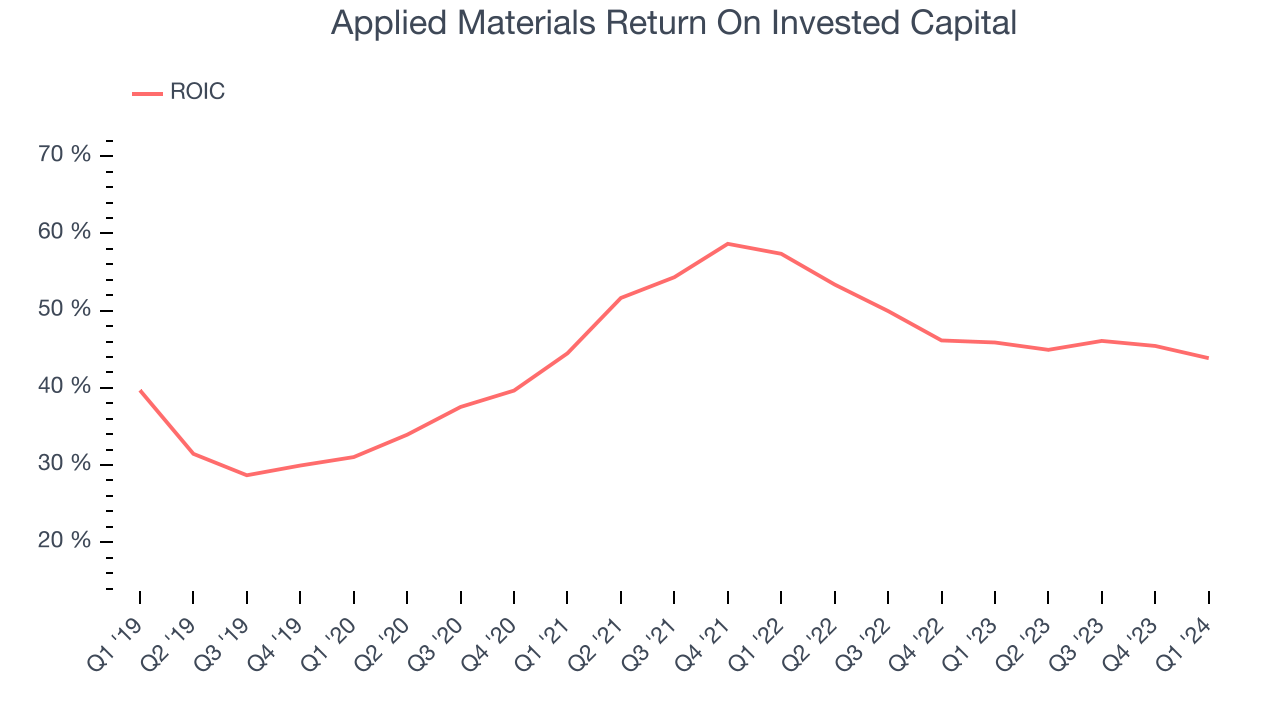
The trend in its ROIC, however, is often what surprises the market and drives the stock price. Over the last few years, Applied Materials's ROIC averaged 7.1 percentage point increases. The company has historically shown the ability to generate good returns, and its rising ROIC is a great sign. It could suggest its competitive advantage or profitable business opportunities are expanding.
Key Takeaways from Applied Materials's Q1 Results
We enjoyed seeing Applied Materials exceed analysts' revenue and EPS expectations this quarter. Next quarter's guidance was also solid, with the revenue and EPS outlooks coming in ahead of expectations. On the other hand, its operating margin regrettably fell. Zooming out, we think this was still a decent, albeit mixed, quarter, showing that the company is staying on track. Investors were likely expecting more, and the stock is down 1.3% after reporting, trading at $211.42 per share.
Is Now The Time?
When considering an investment in Applied Materials, investors should take into account its valuation and business qualities as well as what's happened in the latest quarter.
We think Applied Materials is a solid business. Although its revenue growth has been a little slower over the last three years with analysts expecting growth to slow from here, its powerful free cash generation enables it to sustainably invest in growth initiatives while maintaining an ample cash cushion. And while its operating margins are below average compared to its semiconductor peers, its stellar ROIC suggests it has been a well-run company historically.
Applied Materials's price-to-earnings ratio based on the next 12 months is 24.8x. There are definitely things to like about Applied Materials and looking at the semiconductors landscape right now, it seems that the company trades at a pretty interesting price.
Wall Street analysts covering the company had a one-year price target of $220.76 per share right before these results (compared to the current share price of $211.42), implying they saw upside in buying Applied Materials in the short term.
To get the best start with StockStory check out our most recent Stock picks, and then sign up to our earnings alerts by adding companies to your watchlist here. We typically have the quarterly earnings results analyzed within seconds of the data being released, and especially for the companies reporting pre-market, this often gives investors the chance to react to the results before the market has fully absorbed the information.