
Semiconductor packaging and testing company Amkor Technology (NASDAQ:AMKR) reported results ahead of analysts' expectations in Q4 FY2023, with revenue down 8.1% year on year to $1.75 billion. On the other hand, next quarter's revenue guidance of $1.35 billion was less impressive, coming in 10.5% below analysts' estimates. It made a GAAP profit of $0.48 per share, down from its profit of $0.67 per share in the same quarter last year.
Amkor (AMKR) Q4 FY2023 Highlights:
- Revenue: $1.75 billion vs analyst estimates of $1.72 billion (2.1% beat)
- EPS: $0.48 vs analyst estimates of $0.41 (17.3% beat)
- Revenue Guidance for Q1 2024 is $1.35 billion at the midpoint, below analyst estimates of $1.51 billion
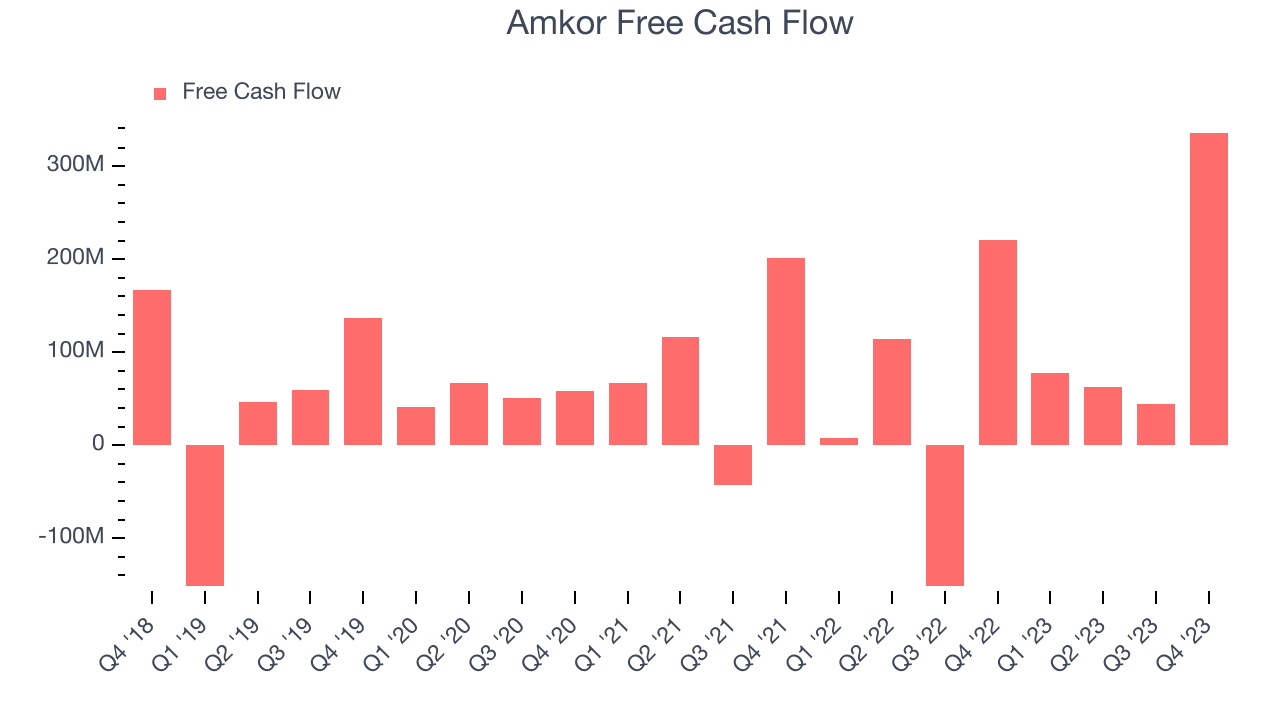
- Free Cash Flow of $336 million, up from $44.26 million in the previous quarter
- Inventory Days Outstanding: 24, down from 28 in the previous quarter
- Gross Margin (GAAP): 15.9%, down from 17.5% in the same quarter last year
- Market Capitalization: $7.85 billion
Operating through a largely Asian facility footprint, Amkor Technologies (NASDAQ:AMKR) provides outsourced packaging and testing for semiconductors.
Semiconductor manufacturing begins with a silicon wafer upon which circuit patterns are transferred. The fabricated material (the die) is then separated (dicing), typically using automation and precision tools such as lasers. Packaging comes next and serves three key purposes: connects the chip to an external environment (e.g. a circuit board), protects the chips against physical damage, and dissipates excess heat.
Amkor’s customers are semiconductor foundries (manufacturers), fabless semiconductor companies (designers who outsource manufacturing), and original equipment manufacturers (OEMs). The company’s packaging aims to meet customers’ requirements for size, electrical and mechanical performance, and interconnect technology (wiring systems to connect chips). For example, one of Amkor’s key packaging offerings is the ‘Flip-Chip Chip Scale Package’, where the package is no larger than the chip. This supports increasingly small form factors found in smartphones, tablets and other mobile devices. In addition to packaging, Amkor also offers testing services to ensure that semiconductors are defect-free and meet specifications before being deployed or sold.
Other companies offering outsourced semiconductor packaging and testing services include ASE Technology (TWSE:3711), Powertech Technology (TWSE:6239), and Siliconware Technology.Sales Growth
Amkor's revenue growth over the last three years has been unremarkable, averaging 9.6% annually. This quarter, its revenue declined from $1.91 billion in the same quarter last year to $1.75 billion. Semiconductors are a cyclical industry, and long-term investors should be prepared for periods of high growth followed by periods of revenue contractions (which can sometimes offer opportune times to buy).
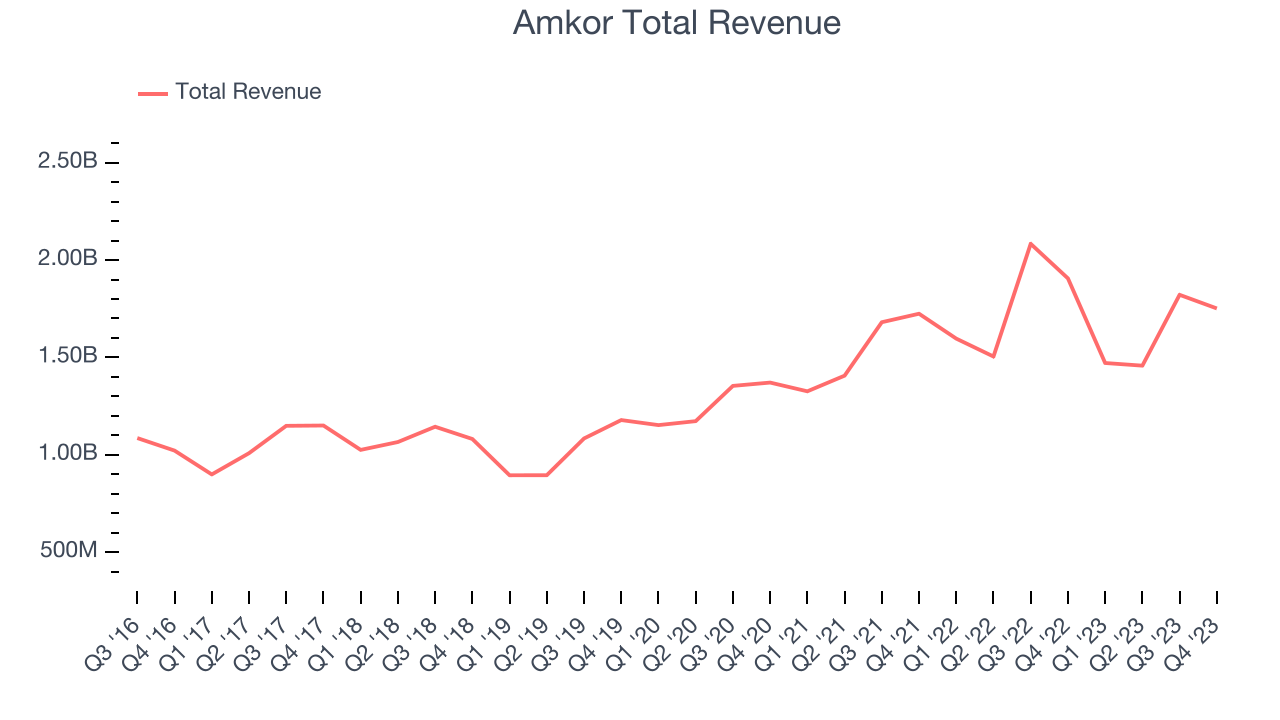
Even though Amkor surpassed analysts' revenue estimates, this was a slow quarter for the company as its revenue dropped 8.1% year on year. This could mean that the current downcycle is deepening.
But Amkor may be headed for an upturn soon. Although the company is guiding for a year-on-year revenue decline of 8.3% next quarter, analysts are expecting revenue to grow 5.3% over the next 12 months.
Product Demand & Outstanding Inventory
Days Inventory Outstanding (DIO) is an important metric for chipmakers, as it reflects a business' capital intensity and the cyclical nature of semiconductor supply and demand. In a tight supply environment, inventories tend to be stable, allowing chipmakers to exert pricing power. Steadily increasing DIO can be a warning sign that demand is weak, and if inventories continue to rise, the company may have to downsize production.
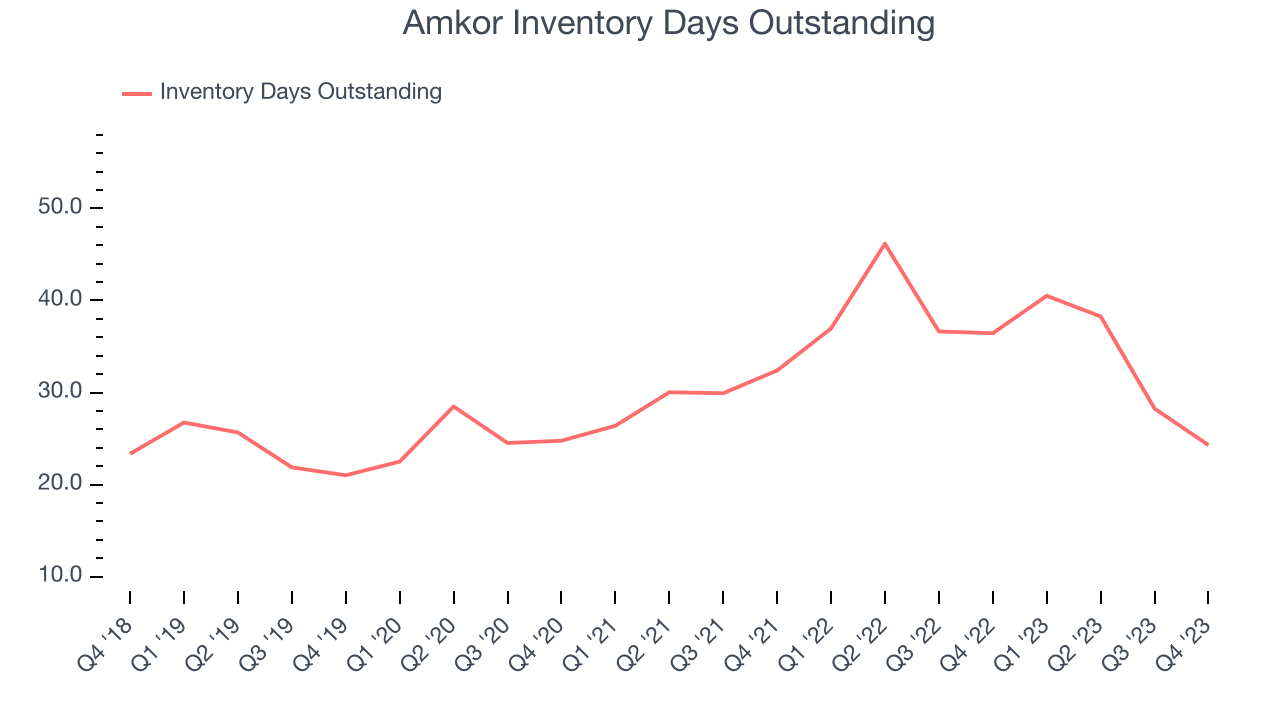
This quarter, Amkor's DIO came in at 24, which is 6 days below its five-year average. At the moment, these numbers show no indication of an excessive inventory buildup.
Pricing Power
In the semiconductor industry, a company's gross profit margin is a critical metric to track because it sheds light on its pricing power, complexity of products, and ability to procure raw materials, equipment, and labor. Amkor's gross profit margin, which shows how much money the company gets to keep after paying key materials, input, and manufacturing costs, came in at 15.9% in Q4, down 1.6 percentage points year on year.
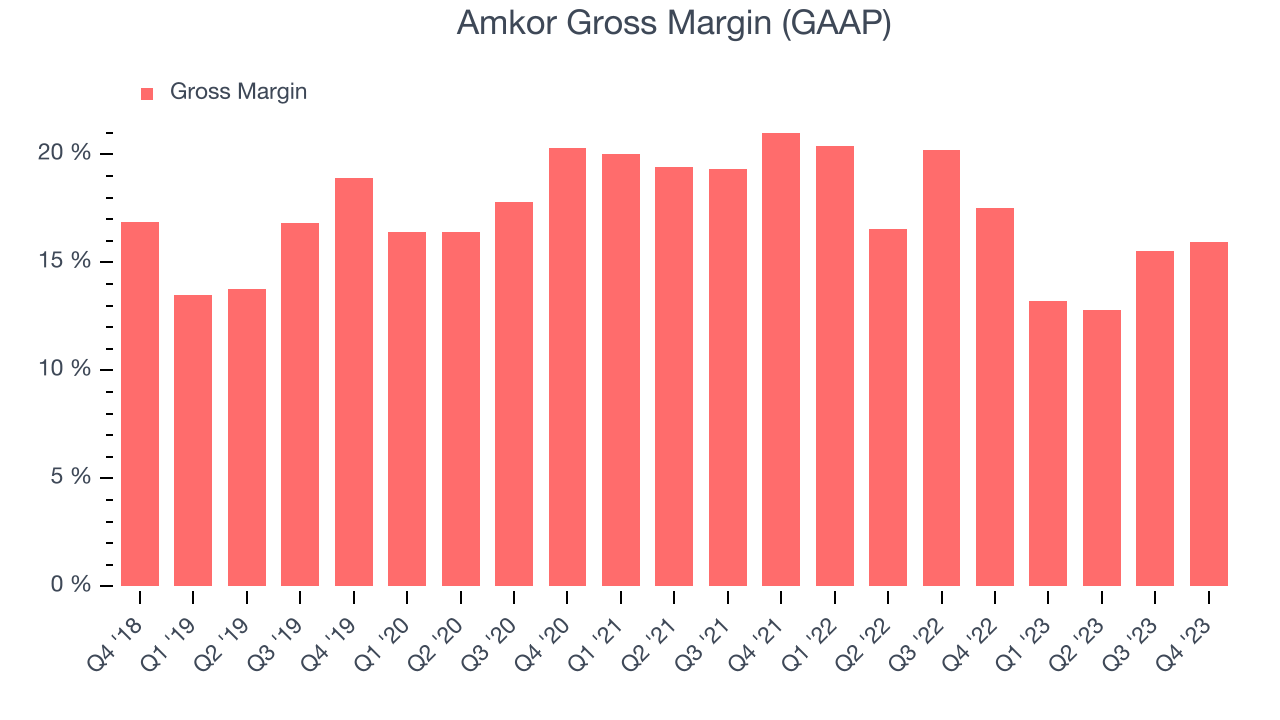
Amkor's gross margins have been trending down over the last 12 months, averaging 14.4%. This weakness isn't great as Amkor's margins are already far below other semiconductor companies and suggest shrinking pricing power and loose cost controls.
Profitability
Amkor reported an operating margin of 18.1% in Q4, up 6.3 percentage points year on year. Operating margins are one of the best measures of profitability because they tell us how much money a company takes home after manufacturing its products, marketing and selling them, and, importantly, keeping them relevant through research and development.
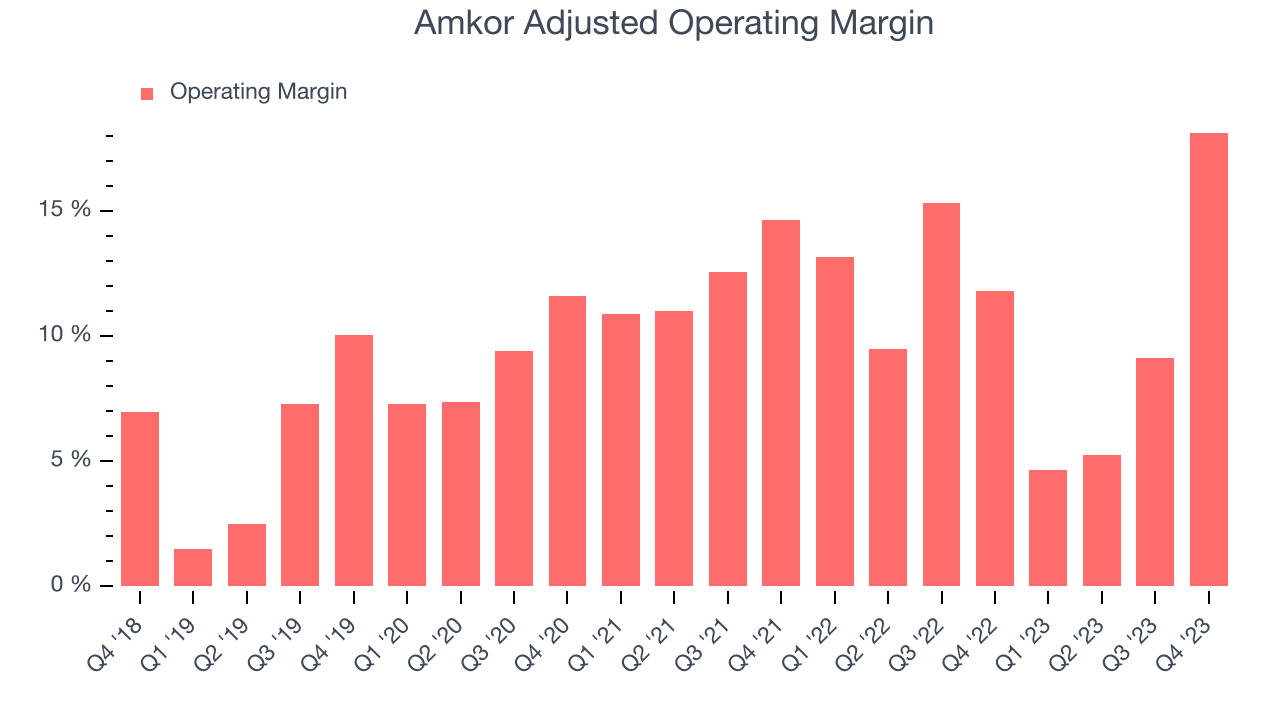
Amkor's operating margins have been trending down over the last year, averaging 9.3%. This is a bad sign for Amkor, whose margins are already below average for semiconductor companies. To its credit, however, the company's margins suggest modest pricing power and cost controls.
Earnings, Cash & Competitive Moat
Analysts covering Amkor expect earnings per share to grow 55.8% over the next 12 months, although estimates will likely change after earnings.
Although earnings are important, we believe cash is king because you can't use accounting profits to pay the bills. Amkor's free cash flow came in at $336 million in Q4, up 52.6% year on year.
As you can see above, Amkor produced free cash flow of just $520.6 million in the last year, resulting in a measly 7.8% free cash flow margin. Amkor might need to improve its free cash flow conversion if it wants to stay competitive.
Return on Invested Capital (ROIC)
EPS and free cash flow tell us whether a company's revenue growth was profitable. But was it capital-efficient? If two companies had equal growth, we’d prefer the one with lower reinvestment requirements.
Understanding a company’s ROIC (return on invested capital) gives us insight into this because it factors the total debt and equity needed to generate operating profits. This metric is a proxy for not only the capital efficiency of a business but also a management team's ability to allocate limited resources.
Amkor's five-year average ROIC was 16.8%, somewhat low compared to the best semiconductor companies that consistently pump out 35%+. Its returns suggest it historically did a subpar job investing in profitable growth initiatives.
The trend in its ROIC, however, is often what surprises the market and drives the stock price. Over the last two years, Amkor's ROIC has averaged a 5.3 percentage point increase each year. This is a good sign, and if Amkor's returns keep rising, there's a chance it could evolve into an investable business.
Key Takeaways from Amkor's Q4 Results
We were impressed by Amkor's strong improvement in inventory levels. We were also glad its operating margin improved. On the other hand, its revenue guidance for next quarter missed analysts' expectations and its gross margin shrunk. Zooming out, we think this was mixed. The market was likely expecting more, and the stock is down 7.1% after reporting, trading at $30.01 per share.
Is Now The Time?
When considering an investment in Amkor, investors should take into account its valuation and business qualities as well as what's happened in the latest quarter.
We cheer for everyone who's making the lives of others easier through technology, but in the case of Amkor, we'll be cheering from the sidelines. Its revenue growth has been uninspiring over the last three years, and analysts expect growth to deteriorate from here. On top of that, its gross margin indicate some combination of pricing pressures or rising production costs, and its operating margins reveal subpar cost controls compared to other semiconductor businesses.
Amkor's price-to-earnings ratio based on the next 12 months is 14.9x. While we have no doubt one can find things to like about the company, and the price is not completely unreasonable, we think that at the moment there might be better opportunities in the market.
To get the best start with StockStory check out our most recent Stock picks, and then sign up to our earnings alerts by adding companies to your watchlist here. We typically have the quarterly earnings results analyzed within seconds of the data being released, and especially for the companies reporting pre-market, this often gives investors the chance to react to the results before the market has fully absorbed the information.