
Data analytics software provider Amplitude (NASDAQ:AMPL) reported results in line with analysts' expectations in Q1 CY2024, with revenue up 9.2% year on year to $72.62 million. The company expects next quarter's revenue to be around $72 million, in line with analysts' estimates. It made a non-GAAP profit of $0.01 per share, improving from its loss of $0.04 per share in the same quarter last year.
Amplitude (AMPL) Q1 CY2024 Highlights:
- Revenue: $72.62 million vs analyst estimates of $72.25 million (small beat)
- EPS (non-GAAP): $0.01 vs analyst estimates of $0 ($0.01 beat)
- Revenue Guidance for Q2 CY2024 is $72 million at the midpoint, roughly in line with what analysts were expecting
- The company reconfirmed its revenue guidance for the full year of $294 million at the midpoint
- Gross Margin (GAAP): 74%, up from 71.1% in the same quarter last year
- Free Cash Flow was -$1.14 million, down from $1.48 million in the previous quarter
- Net Revenue Retention Rate: 99%, in line with the previous quarter
- Customers: 2,970, up from 2,723 in the previous quarter
- Market Capitalization: $1.15 billion
Born out of a failed voice recognition startup by founder Spenser Skates, Amplitude (NASDAQ:AMPL) is data analytics software helping companies improve and optimize their digital products.
Digital products are at the center of how companies interact with customers. Think DoorDash or Paypal or Dropbox - each of these commonly used digital products are built by product managers who tend to create innovative new product features on what they think the customer wants. Intuition. Gut feel. As a result, digital products often introduce new features and then employ data scientists to create a combination of user surveys and complex behavioral models to answer questions like – What drives more revenue, subscriptions or on-demand purchases? or Why aren’t my free users converting to paid?
The plus side of the massive adoption of digital products is the generation of lots of product data. Amplitude's proprietary Behavioral Graph connects millions of seemingly random events from a single user to identify patterns and derive data-driven insights on how users are engaging with digital products. Product designers can gain insight from the specific actions end users take within digital products and answer important questions, such as where in the purchase journey do users experience friction, what are the top user paths between signup and trial conversion, and which features increase new customer retention.
As a result, Amplitude allows businesses to save money on utilizing a patchwork of data visualization and marketing analytics products by instead having Amplitude provide an all in one solution. Amplitude has the added benefit of accelerating the pace of innovation, effectively allowing strategic product decisions to be made in near real time.
Data Analytics
Organizations generate a lot of data that is stored in silos, often in incompatible formats, making it slow and costly to extract actionable insights, which in turn drives demand for modern cloud-based data analysis platforms that can efficiently analyze the siloed data.
Amplitude’s competitors in the digital optimization space include web and marketing analytics vendors such as Adobe Experience Cloud (NASDAQ: ADBE) and Google Analytics (NASDAQ: GOOGL), along with business intelligence solutions like Salesforce.com’s Tableau (NYSE:CRM).
Sales Growth
As you can see below, Amplitude's revenue growth has been very strong over the last three years, growing from $33.11 million in Q1 2021 to $72.62 million this quarter.
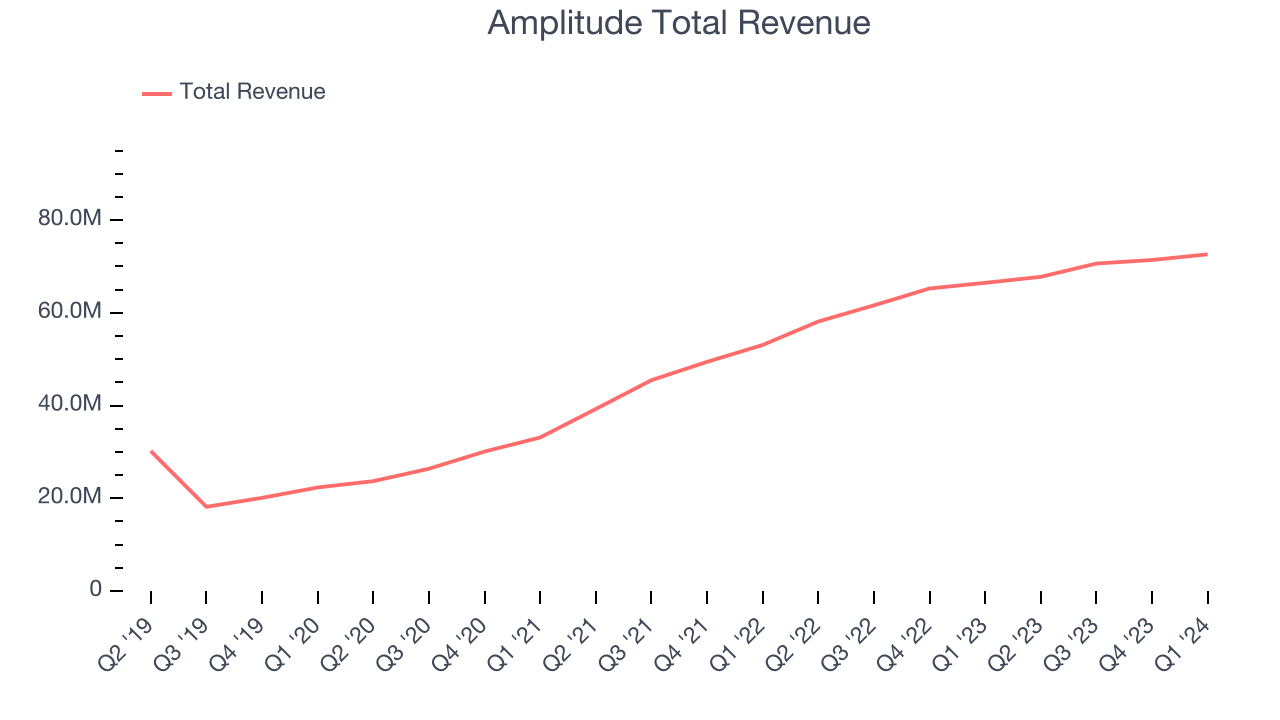
Amplitude's quarterly revenue was only up 9.2% year on year, which might disappoint some shareholders. However, we can see that the company's revenue grew by $1.22 million quarter on quarter, accelerating from $766,000 in Q4 CY2023.
Next quarter's guidance suggests that Amplitude is expecting revenue to grow 6.2% year on year to $72 million, slowing down from the 16.6% year-on-year increase it recorded in the same quarter last year. Looking ahead, analysts covering the company were expecting sales to grow 5.7% over the next 12 months before the earnings results announcement.
Customer Growth
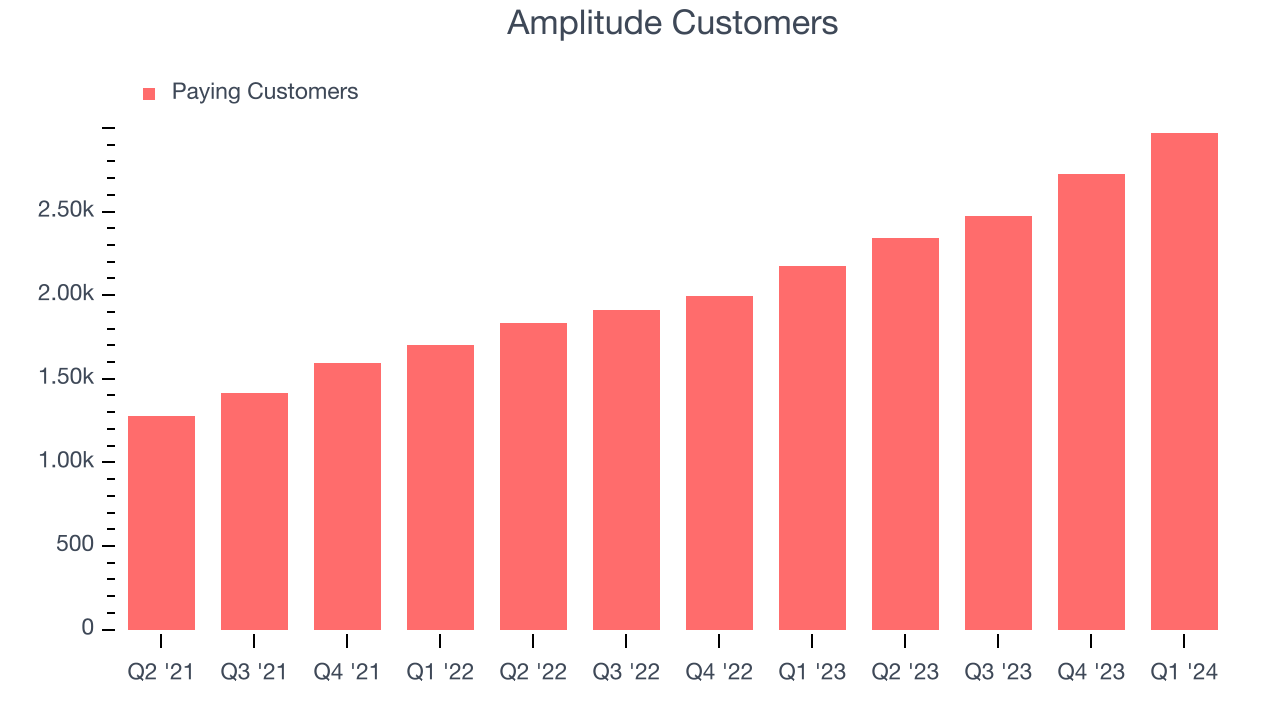
Amplitude reported 2,970 customers at the end of the quarter, an increase of 247 from the previous quarter. That's roughly the same customer growth as we observed last quarter and quite a bit above what we've typically seen over the last year, confirming that the company is sustaining a good sales pace.
Product Success
One of the best parts about the software-as-a-service business model (and a reason why SaaS companies trade at such high valuation multiples) is that customers typically spend more on a company's products and services over time.
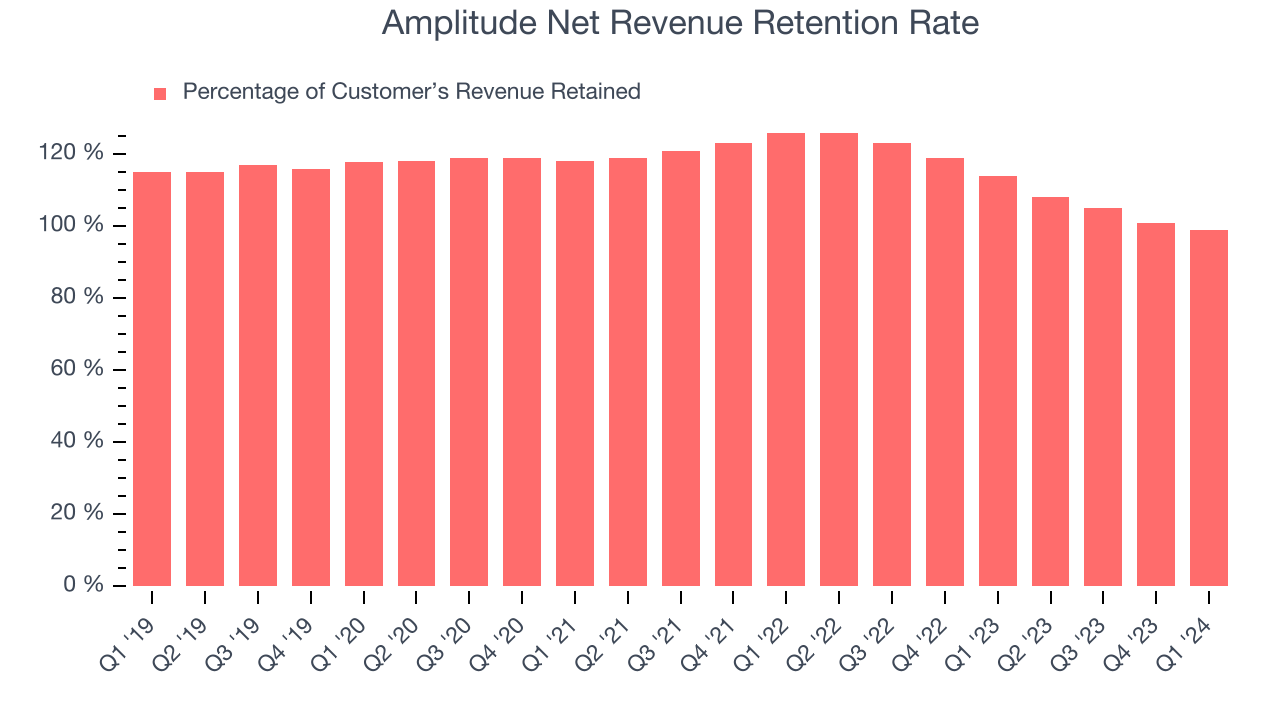
Amplitude's net revenue retention rate, a key performance metric measuring how much money existing customers from a year ago are spending today, was 99% in Q1. This means Amplitude's revenue would've decreased by 1% over the last 12 months if it didn't win any new customers.
Amplitude's already weak net retention rate has been dropping the last year, signaling that some customers aren't satisfied with its products, leading to lost contracts and revenue streams.
Profitability
What makes the software as a service business so attractive is that once the software is developed, it typically shouldn't cost much to provide it as an ongoing service to customers. Amplitude's gross profit margin, an important metric measuring how much money there's left after paying for servers, licenses, technical support, and other necessary running expenses, was 74% in Q1.
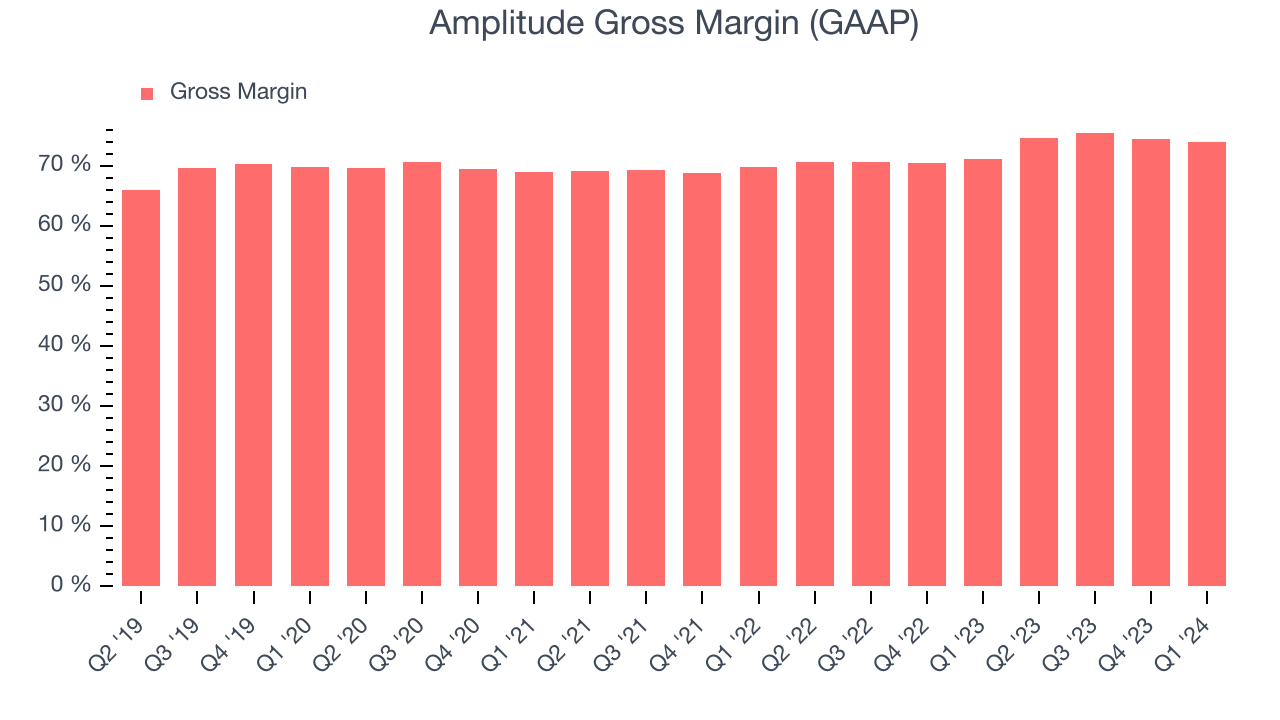
That means that for every $1 in revenue the company had $0.74 left to spend on developing new products, sales and marketing, and general administrative overhead. Amplitude's gross margin is around the average of a typical SaaS businesses. It's encouraging to see its gross margin remain stable, indicating that Amplitude is controlling its costs and not under pressure from its competitors to lower prices.
Cash Is King
If you've followed StockStory for a while, you know that we emphasize free cash flow. Why, you ask? We believe that in the end, cash is king, and you can't use accounting profits to pay the bills. Amplitude burned through $1.14 million of cash in Q1 , increasing its cash burn by 80.5% year on year.
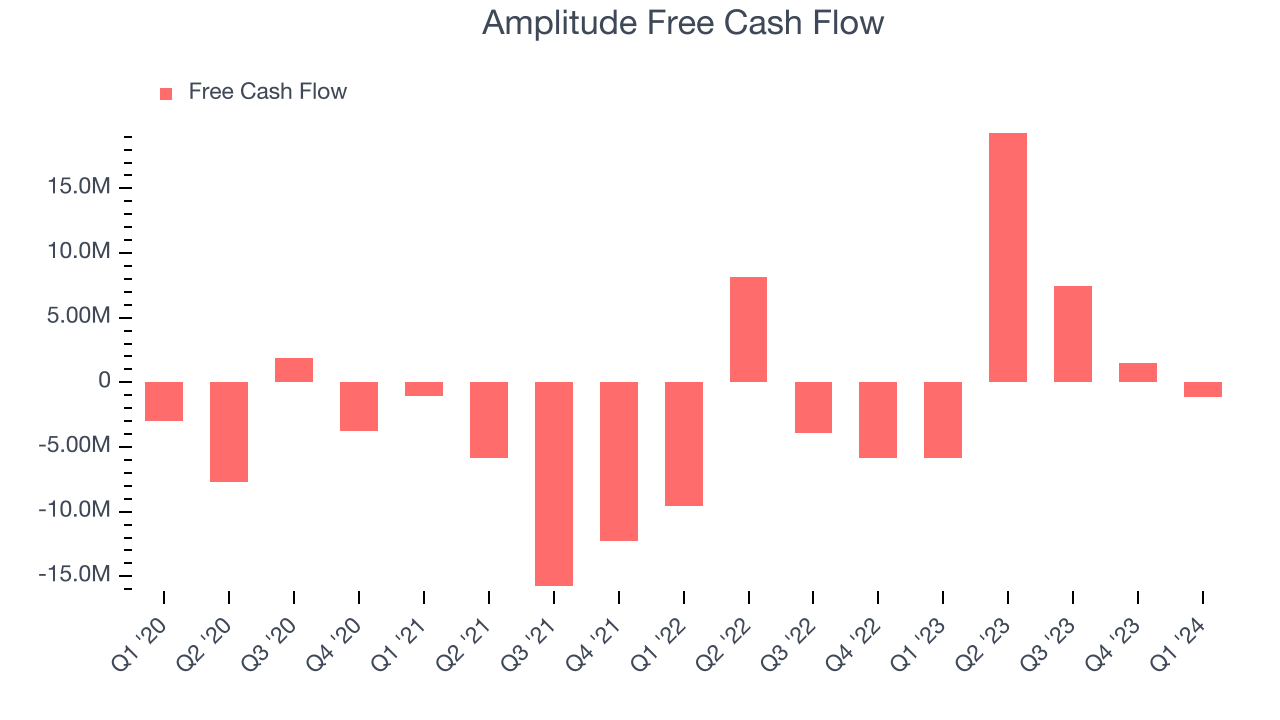
Amplitude has generated $27.15 million in free cash flow over the last 12 months, or 9.6% of revenue. This FCF margin enables it to reinvest in its business without depending on the capital markets.
Key Takeaways from Amplitude's Q1 Results
It was encouraging to see Amplitude slightly beat analysts' revenue guidance expectations. Next quarter's revenue guidance was in line and full year revenue guidance was maintained, meaning there are no major surprises with regards to demand trends. A minor negative was that its net revenue retention declined. Zooming out, we think this was still a decent, albeit mixed, quarter, showing that the company is staying on track. The stock is up 1.8% after reporting and currently trades at $9.45 per share.
Is Now The Time?
When considering an investment in Amplitude, investors should take into account its valuation and business qualities as well as what's happened in the latest quarter.
Although Amplitude isn't a bad business, it probably wouldn't be one of our picks. Although its revenue growth has been exceptional over the last three years, Wall Street expects growth to deteriorate from here.
Amplitude's price-to-sales ratio based on the next 12 months is 3.8x, suggesting the market has lower expectations for the business relative to the hottest tech stocks. We can find things to like about Amplitude, and there's no doubt it's a bit of a market darling, at least for some. However, we think there are better opportunities elsewhere right now.
Wall Street analysts covering the company had a one-year price target of $12.13 right before these results (compared to the current share price of $9.45).
To get the best start with StockStory, check out our most recent Stock picks, and then sign up for our earnings alerts by adding companies to your watchlist here. We typically have the quarterly earnings results analyzed within seconds of the data being released. Especially for companies reporting pre-market, this often gives investors the chance to react to the results before everyone else has fully absorbed the information.