American restaurant chain BJ’s Restaurants (NASDAQ:BJRI) reported results in line with analysts' expectations in Q1 CY2024, with revenue down 1.2% year on year to $337.3 million. It made a GAAP profit of $0.32 per share, improving from its profit of $0.15 per share in the same quarter last year.
BJ's (BJRI) Q1 CY2024 Highlights:
- Revenue: $337.3 million vs analyst estimates of $335.4 million (small beat)
- EPS: $0.32 vs analyst estimates of $0.15 ($0.17 beat)
- Gross Margin (GAAP): 15%, up from 12.6% in the same quarter last year
- Same-Store Sales were down 1.7% year on year (beat vs. expectations of down 2.3% year on year)
- Store Locations: 217 at quarter end, increasing by 1 over the last 12 months
- Market Capitalization: $750.4 million
Founded in 1978 in California, BJ’s Restaurants (NASDAQ:BJRI) is a chain of restaurants whose menu features classic American dishes, often with a twist.
The concept began as a simple pizza joint but has since grown into a more comprehensive casual dining experience. BJ's is known for its deep-dish pizza, desserts, and craft beers. As mentioned, there is often creativity in the dishes, as seen by offerings such as the cheeseburger pizza that features a ground beef crumble and bacon on top of traditional pizza ingredients. The fan-favorite Pizookie is a dessert that is a chocolate chip cookie baked into a pizza pan and topped with marshmallows for the family to share.
The core BJ’s Restaurants customer is a middle-income family looking for a special night out on the one hand, but an experience that is also relaxed and affordable on the other hand. The kids can get some creative pizza or chicken dishes while being a little rowdy while adults can have some grownup fare and a drink. Everyone leaves full without breaking the bank.
Stepping into a BJ's location, you’ll notice ample space with seating options for groups large and small. The interiors have a contemporary vibe, adorned with wood finishes and soft lighting. In short, the decor is nice but not overly memorable. And because BJ’s caters to families, the atmosphere is usually lively, especially during peak lunch and dinner times on the weekends.
Sit-Down Dining
Sit-down restaurants offer a complete dining experience with table service. These establishments span various cuisines and are renowned for their warm hospitality and welcoming ambiance, making them perfect for family gatherings, special occasions, or simply unwinding. Their extensive menus range from appetizers to indulgent desserts and wines and cocktails. This space is extremely fragmented and competition includes everything from publicly-traded companies owning multiple chains to single-location mom-and-pop restaurants.
Competitors offering a full-service, casual family dining experience include Darden (NYSE:DRI), Dine Brands (NYSE:DIN), Brinker International (NYSE:EAT), and The Cheesecake Factory (NASDAQ:CAKE).Sales Growth
BJ's is larger than most restaurant chains and benefits from economies of scale, giving it an edge over its smaller competitors.
As you can see below, the company's annualized revenue growth rate of 3.3% over the last five years was weak , but to its credit, it opened new restaurants and grew sales at existing, established dining locations.
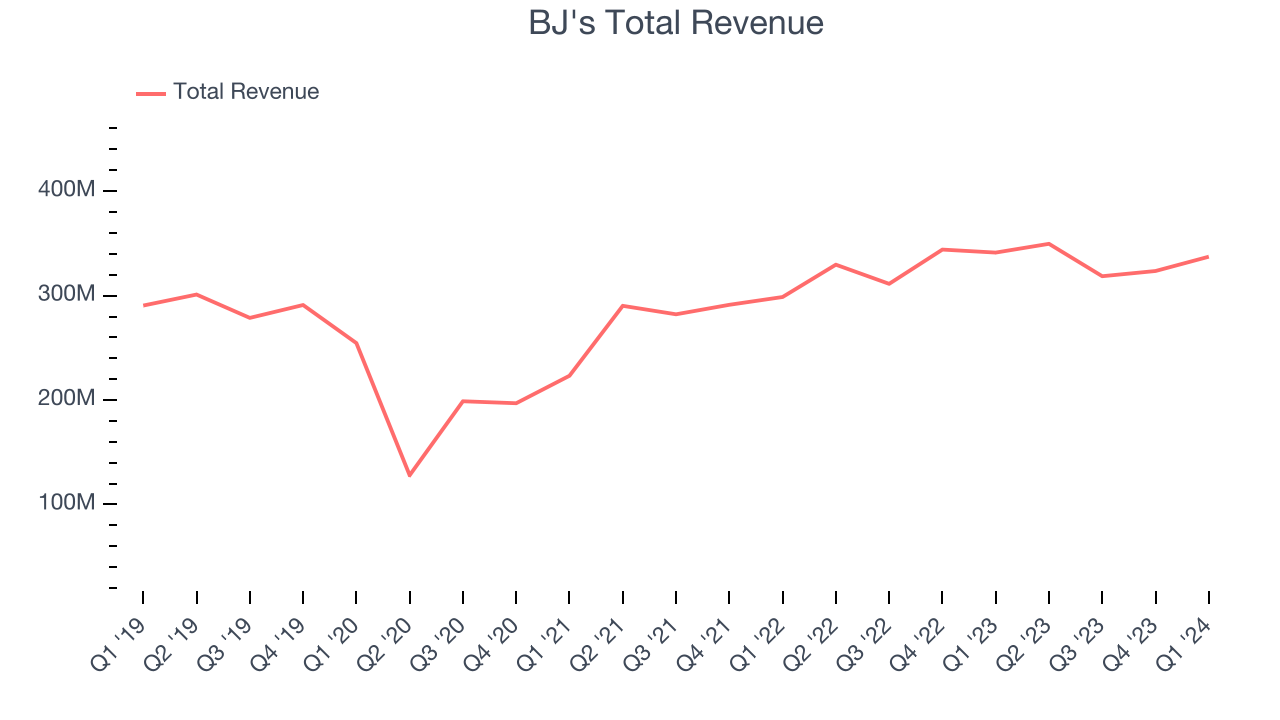
This quarter, BJ's reported a rather uninspiring 1.2% year-on-year revenue decline to $337.3 million in revenue, in line with Wall Street's estimates. Looking ahead, Wall Street expects sales to grow 3.5% over the next 12 months, an acceleration from this quarter.
Same-Store Sales
BJ's demand within its existing restaurants has generally risen over the last two years but lagged behind the broader sector. On average, the company's same-store sales have grown by 5% year on year. With positive same-store sales growth amid an increasing number of restaurants, BJ's is reaching more diners and growing sales.
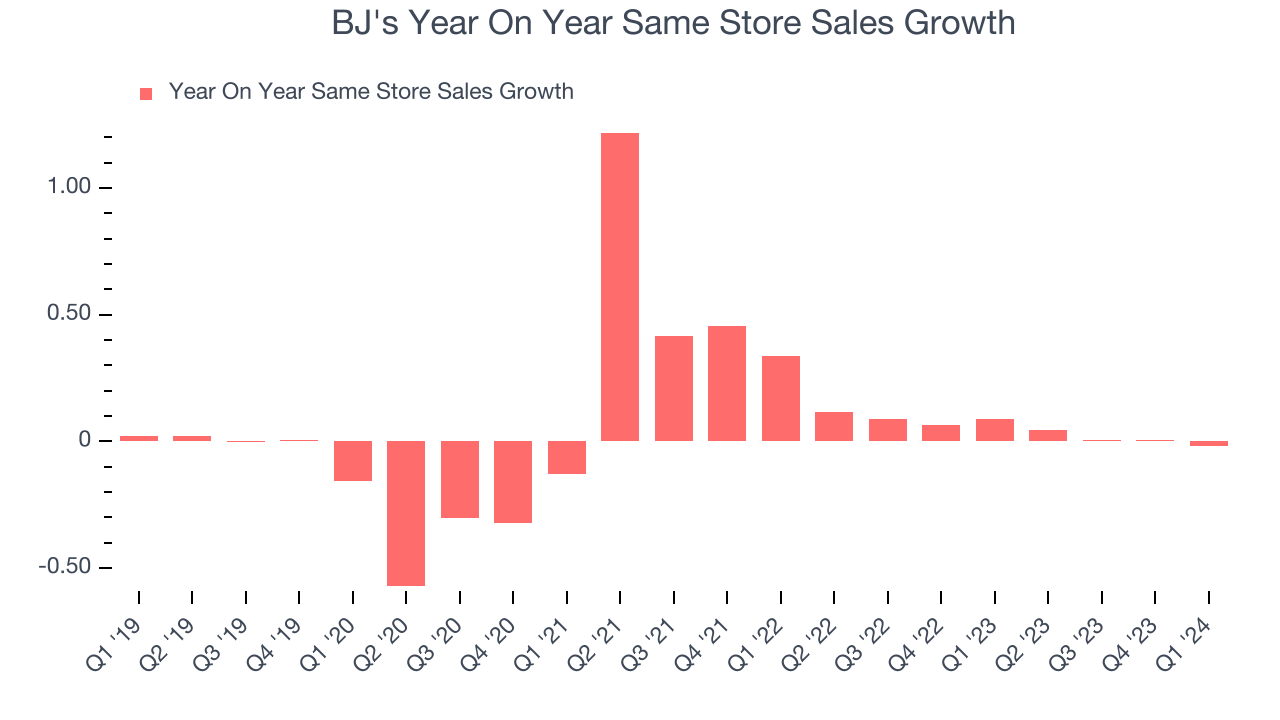
In the latest quarter, BJ's same-store sales fell 1.7% year on year. This decline was a reversal from the 9% year-on-year increase it posted 12 months ago. We'll be keeping a close eye on the company to see if this turns into a longer-term trend.
Number of Stores
A restaurant chain's total number of dining locations often determines how much revenue it can generate.
When a chain like BJ's is opening new restaurants, it usually means it's investing for growth because there's healthy demand for its meals and there are markets where the concept has few or no locations. As of the most recently reported quarter, BJ's operated 217 total locations, in line with its restaurant count a year ago.
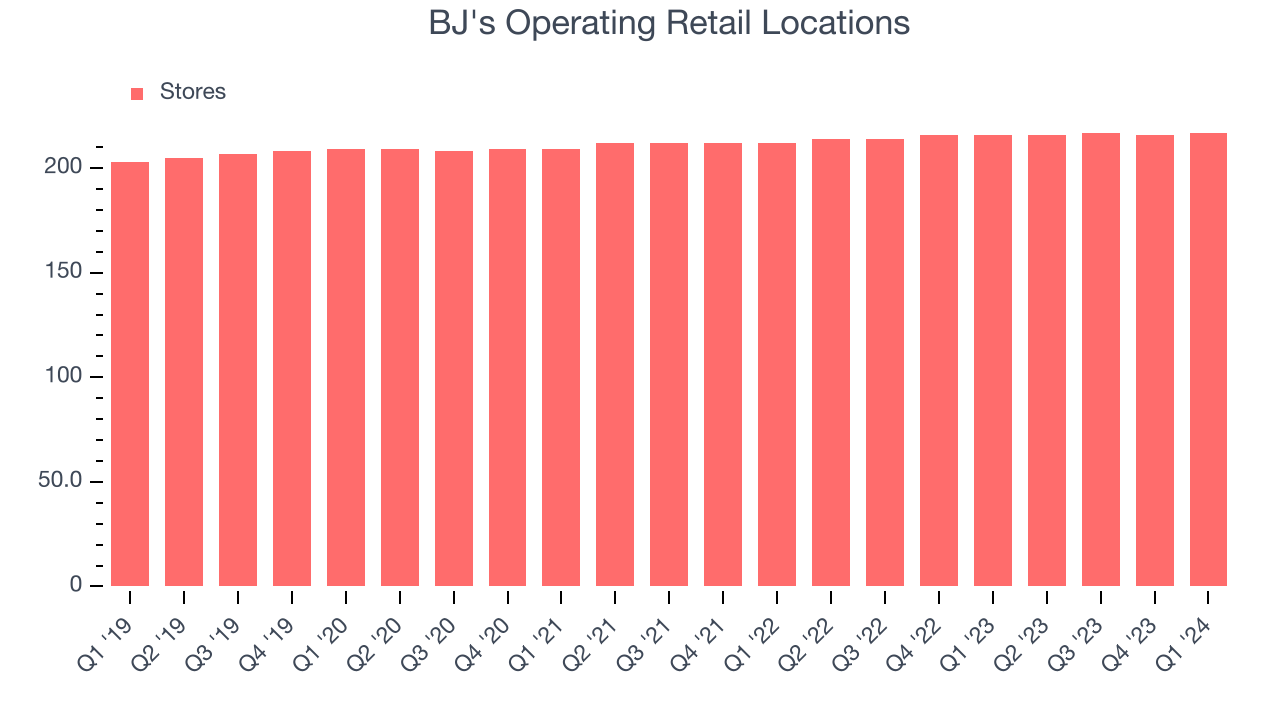
Over the last two years, BJ's has generally opened new restaurants and averaged 1.1% annual growth in new locations, which is on par with the broader sector. Comparisons, however, should be taken with a grain of salt as the industry is quite mature. Analyzing a restaurant's location growth is important because expansion means BJ's has more opportunities to feed customers and generate sales.
Gross Margin & Pricing Power
Gross profit margins are an important measure of a restaurant's pricing power and differentiation, whether it be the dining experience or quality and taste of food.
In Q1, BJ's gross profit margin was 15%. up 2.4 percentage points year on year. This means the company makes $0.13 for every $1 in revenue before accounting for its operating expenses.
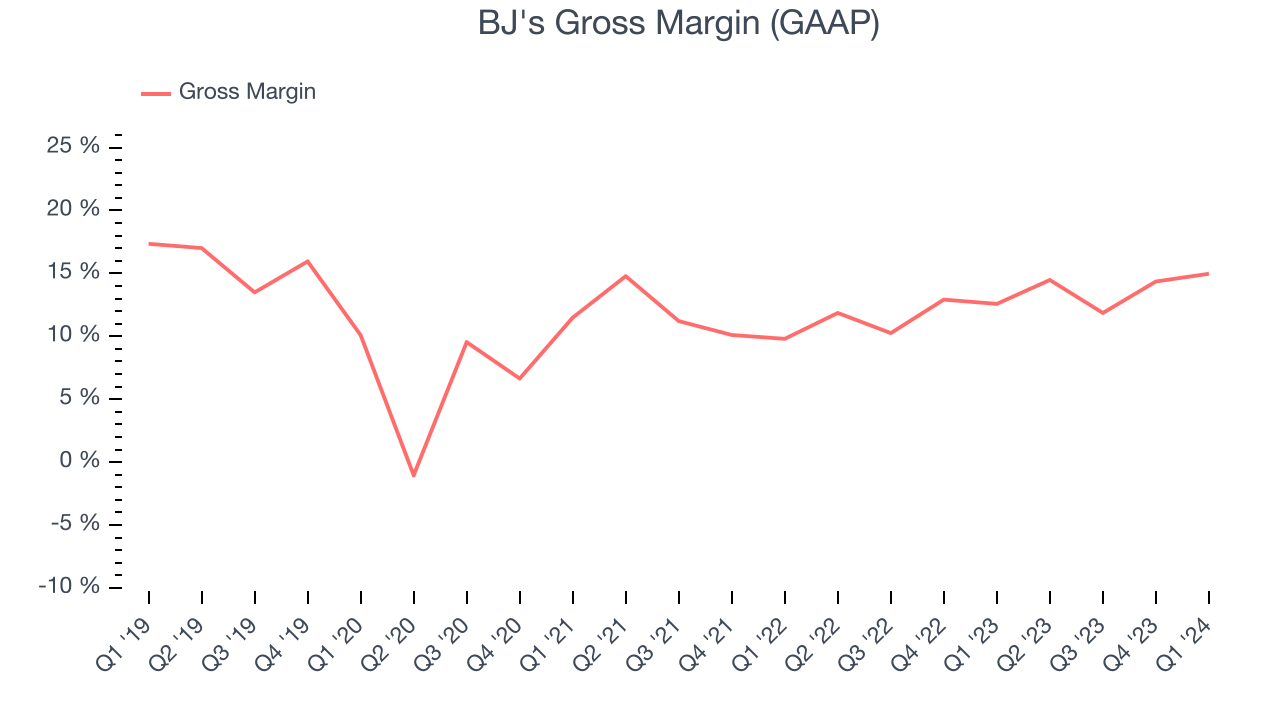
BJ's has poor unit economics for a restaurant company, leaving it with little room for error if things go awry. As you can see above, it's averaged a 12.9% gross margin over the last two years. Its margin, however, has been trending up over the last 12 months, averaging 17% year-on-year increases each quarter. If this trend continues, it could suggest a less competitive environment.
Operating Margin
Operating margin is an important measure of profitability for restaurants as it accounts for all expenses keeping the lights on, including wages, rent, advertising, and other administrative costs.
This quarter, BJ's generated an operating profit margin of 2.4%, up 1.7 percentage points year on year. This increase was encouraging and driven by stronger pricing power or lower ingredient/transportation costs, as indicated by the company's larger rise in gross margin.
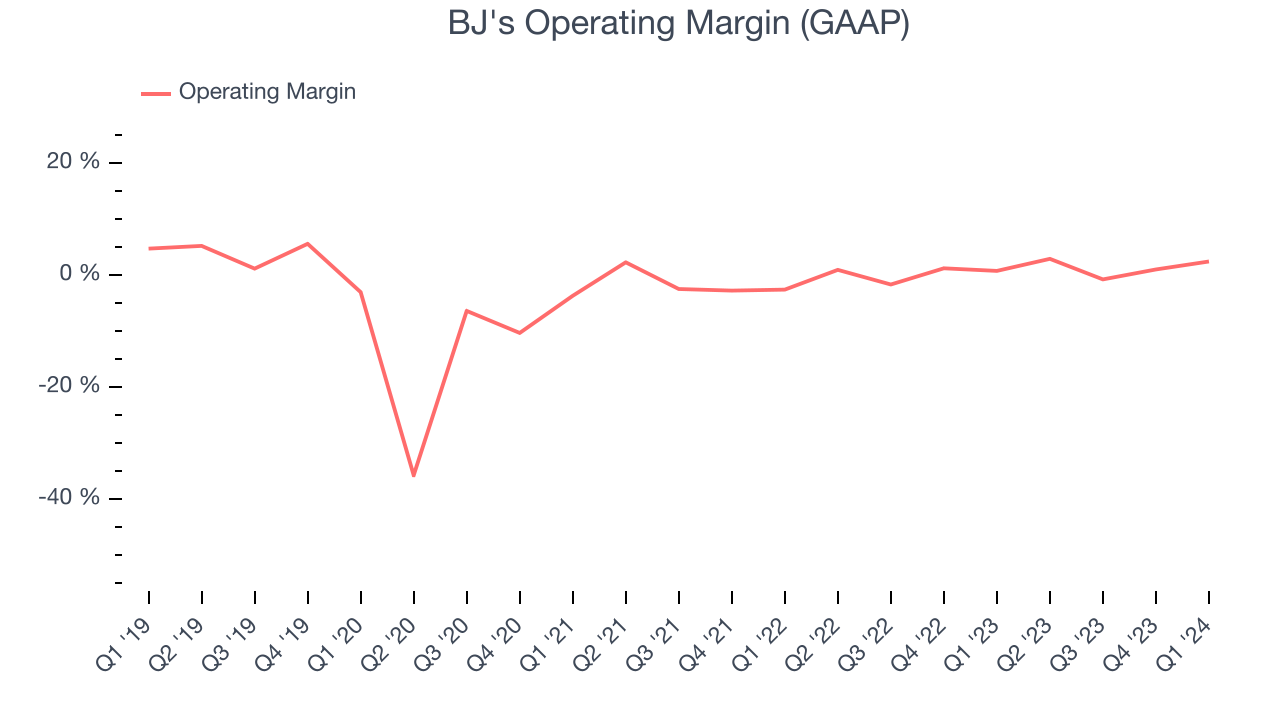 Zooming out, BJ's was profitable over the last eight quarters but held back by its large expense base. Its average operating margin of 0.9% has been among the worst in the restaurant sector. However, BJ's margin has improved, on average, by 1.1 percentage points each year, showing the company is heading in the right direction.
EPS
Earnings growth is a critical metric to track, but for long-term shareholders, earnings per share (EPS) is more telling because it accounts for dilution and share repurchases.
In Q1, BJ's reported EPS at $0.32, up from $0.15 in the same quarter a year ago. This print easily cleared Wall Street's estimates, and shareholders should be content with the results.
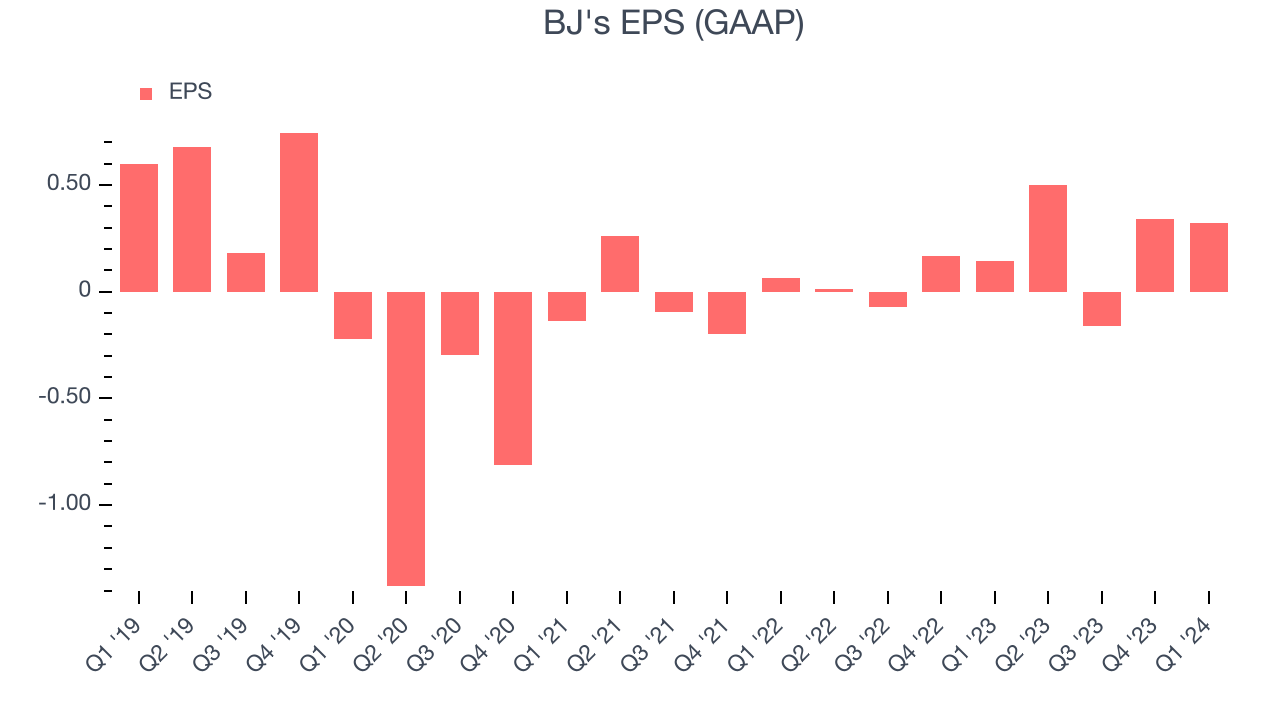
On the bright side, Wall Street expects the company's earnings to grow over the next 12 months, with analysts projecting an average 42.6% year-on-year increase in EPS.
Return on Invested Capital (ROIC)
EPS and free cash flow tell us whether a company was profitable while growing revenue. But was it capital-efficient? Enter ROIC, a metric showing how much operating profit a company generates relative to how much money the business raised (debt and equity).
BJ's five-year average ROIC was 0.4%, somewhat low compared to the best restaurant companies that consistently pump out 15%+. Its returns suggest it historically did a subpar job investing in profitable business initiatives.
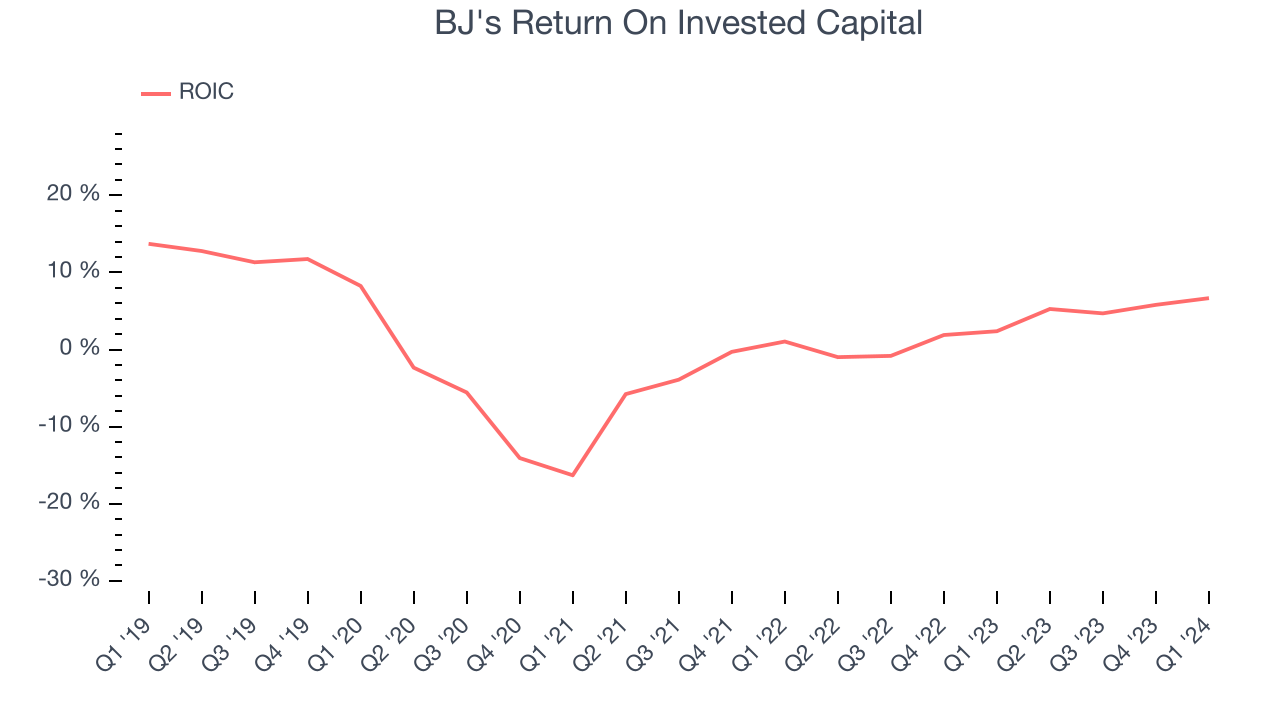
The trend in its ROIC, however, is often what surprises the market and drives the stock price. Over the last few years, BJ's ROIC averaged 8.5 percentage point increases. This is a good sign, and we hope the company can continue improving.
Balance Sheet Risk
As long-term investors, the risk we care most about is the permanent loss of capital. This can happen when a company goes bankrupt or raises money from a disadvantaged position and is separate from short-term stock price volatility, which we are much less bothered by.
BJ's reported $18.82 million of cash and $58 million of debt on its balance sheet in the most recent quarter. As investors in high-quality companies, we primarily focus on two things: 1) that a company's debt level isn't too high and 2) that its interest payments are not excessively burdening the business.
With $108.2 million of EBITDA over the last 12 months, we view BJ's 0.4x net-debt-to-EBITDA ratio as safe. We also see its $5.21 million of annual interest expenses as appropriate. The company's profits give it plenty of breathing room, allowing it to continue investing in new initiatives.
Key Takeaways from BJ's Q1 Results
We were impressed that BJ's beat analysts' same store sales, gross margin, and EPS expectations this quarter. Zooming out, we think this was a great quarter that shareholders will appreciate. The stock is up 4.6% after reporting and currently trades at $34.25 per share.
Is Now The Time?
BJ's may have had a good quarter, but investors should also consider its valuation and business qualities when assessing the investment opportunity.
We cheer for all companies serving consumers, but in the case of BJ's, we'll be cheering from the sidelines. Its revenue growth has been uninspiring over the last five years, but at least growth is expected to increase in the short term. And while its projected EPS for the next year implies the company's fundamentals will improve, the downside is its declining EPS over the last five years makes it hard to trust. On top of that, its relatively low ROIC suggests it has struggled to grow profits historically.
BJ's price-to-earnings ratio based on the next 12 months is 24.4x. While there are some things to like about BJ's and its valuation is reasonable, we think there are better opportunities elsewhere in the market right now.
Wall Street analysts covering the company had a one-year price target of $36.89 per share right before these results (compared to the current share price of $34.25).
To get the best start with StockStory, check out our most recent stock picks, and then sign up to our earnings alerts by adding companies to your watchlist here. We typically have the quarterly earnings results analyzed within seconds of the data being released, and especially for companies reporting pre-market, this often gives investors the chance to react to the results before the market has fully absorbed the information.