
Restaurant company Bloomin’ Brands (NASDAQ:BLMN) reported results in line with analysts' expectations in Q1 CY2024, with revenue down 4% year on year to $1.20 billion. It made a non-GAAP profit of $0.70 per share, down from its profit of $0.98 per share in the same quarter last year.
Bloomin' Brands (BLMN) Q1 CY2024 Highlights:
- Revenue: $1.20 billion vs analyst estimates of $1.20 billion (small miss)
- EPS (non-GAAP): $0.70 vs analyst expectations of $0.74 (5.9% miss)
- EPS (non-GAAP) Guidance for Q2 CY2024 is $0.58 at the midpoint, below analyst estimates of $0.69
- Gross Margin (GAAP): 17.1%, down from 19% in the same quarter last year
- Same-Store Sales were down 1.6% year on year
- Store Locations: 1,451 at quarter end, decreasing by 46 over the last 12 months
- Market Capitalization: $2.17 billion
Owner of the iconic Australian-themed Outback Steakhouse, Bloomin’ Brands (NASDAQ:BLMN) is a leading American restaurant company that owns and operates a portfolio of popular restaurant brands.
The company was founded in 1988 when a group of three visionary restauranteurs (Chris Sullivan, Bob Basham, and Tim Gannon) came together to form Multi-Venture Partners, whose objective was to build durable restaurant franchises.
They launched their first eatery, Outback Steakhouse, shortly after forming the company and have since expanded its banners to include Carrabba's Italian Grill, Bonefish Grill, and Fleming's Prime Steakhouse & Wine Bar. Aside from the upscale Fleming’s, each restaurant caters to those seeking a casual dining experience.
Each banner within the Bloomin’ Brands’ family offers a unique culinary journey. Outback is known for its heavy appetizers such as the Bloomin’ Onion and hearty portions of grilled steaks, seafood, and chicken. Carrabba's captures the essence of Italian cuisine with its made-from-scratch pastas and wood-fired pizzas. Bonefish specializes in fresh seafood dishes prepared with unique and vibrant flavors, and Fleming's sets the stage for a sophisticated dining experience with its prime steaks, indulgent sides, and extensive wine selection.
Bloomin’ Brands’ restaurants are typically located in suburban areas and designed to create an inviting ambiance for guests, providing the perfect setting for any occasion whether it be a family dinner, romantic date night, or celebratory gathering.
Sit-Down Dining
Sit-down restaurants offer a complete dining experience with table service. These establishments span various cuisines and are renowned for their warm hospitality and welcoming ambiance, making them perfect for family gatherings, special occasions, or simply unwinding. Their extensive menus range from appetizers to indulgent desserts and wines and cocktails. This space is extremely fragmented and competition includes everything from publicly-traded companies owning multiple chains to single-location mom-and-pop restaurants.
Multi-brand full-service restaurant competitors include Brinker International (NYSE:EAT), Darden (NYSE:DRI), Dine Brands (NYSE:DIN), Texas Roadhouse (NASDAQ:TXRH), and The Cheesecake Factory (NASDAQ:CAKE).Sales Growth
Bloomin' Brands is one of the larger restaurant chains in the industry and benefits from a strong brand, giving it customer mindshare and influence over purchasing decisions.
As you can see below, the company's annualized revenue growth rate of 2.2% over the last five years was weak as its restaurant footprint remained unchanged, implying that growth was driven by more sales at existing, established dining locations.
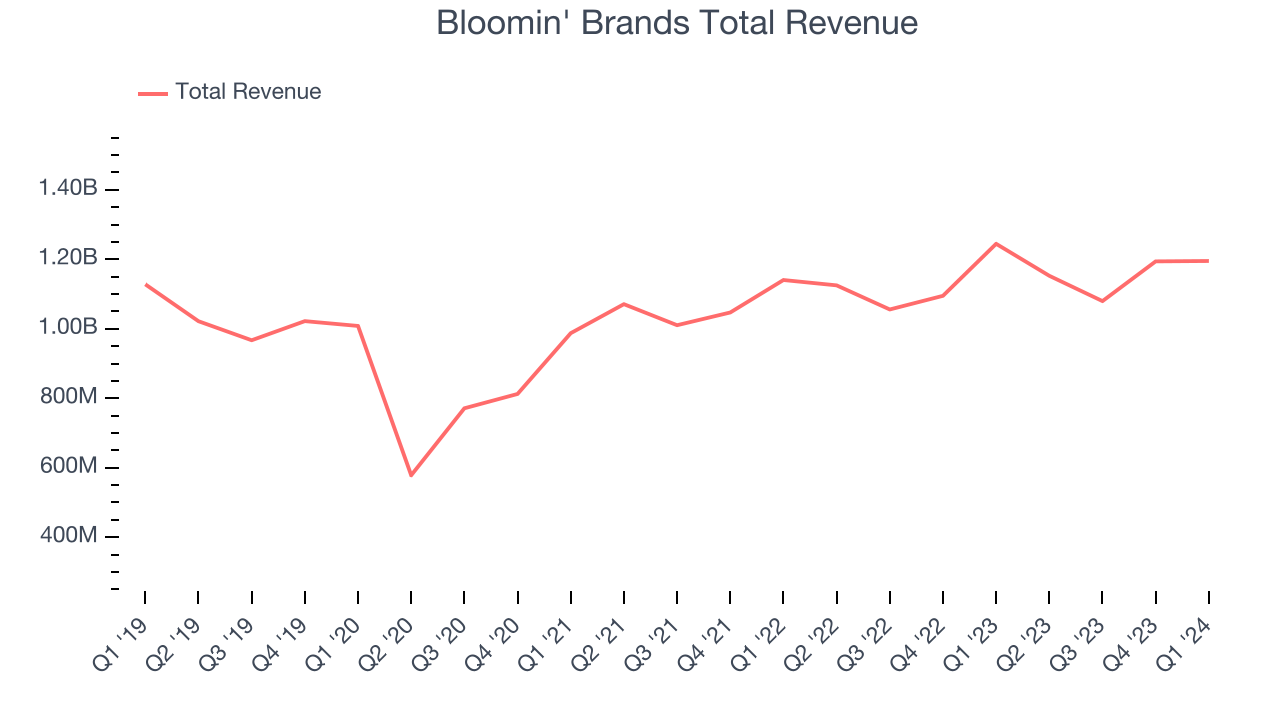
This quarter, Bloomin' Brands missed Wall Street's estimates and reported a rather uninspiring 4% year-on-year revenue decline, generating $1.20 billion in revenue. Looking ahead, Wall Street expects revenue to remain flat over the next 12 months.
Same-Store Sales
Same-store sales growth is an important metric that tracks organic growth and demand for a restaurant's established locations.
Bloomin' Brands's demand within its existing restaurants has barely risen over the last eight quarters. On average, the company's same-store sales growth has been flat.
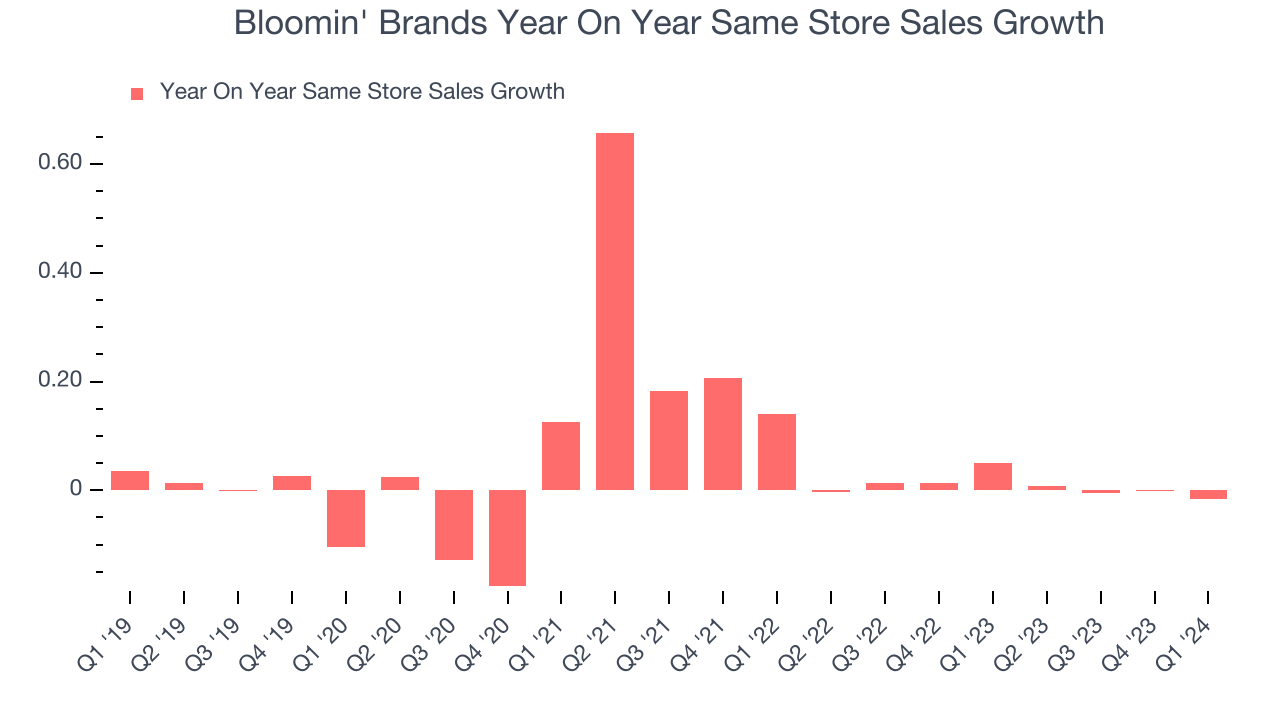
In the latest quarter, Bloomin' Brands's same-store sales fell 1.6% year on year. This decline was a reversal from the 5.1% year-on-year increase it posted 12 months ago. We'll be keeping a close eye on the company to see if this turns into a longer-term trend.
Number of Stores
A restaurant chain's total number of dining locations often determines how much revenue it can generate.
When a chain like Bloomin' Brands doesn't open many new restaurants, it usually means there's stable demand for its meals and it's focused on improving operational efficiency to increase profitability. At the end of this quarter, Bloomin' Brands operated 1,451 total locations, in line with its restaurant count 12 months ago.
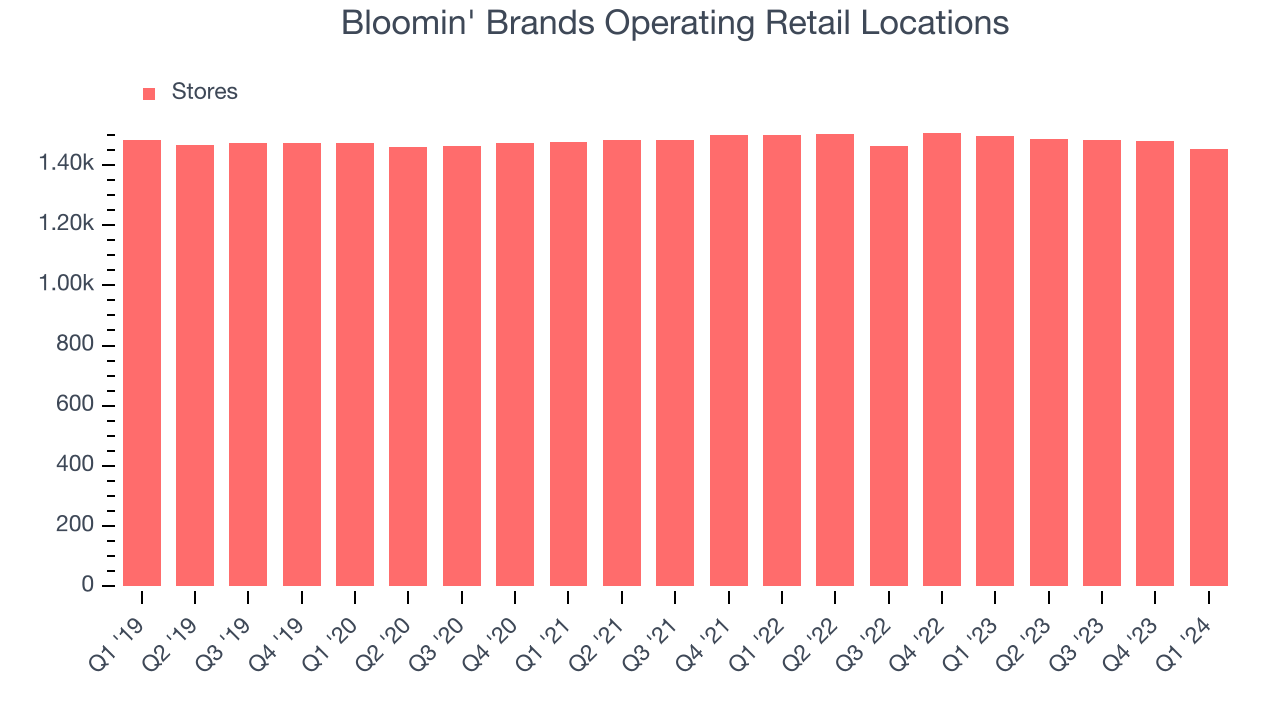
Taking a step back, Bloomin' Brands has kept its locations more or less flat over the last two years compared to other restaurant businesses. A flat restaurant base means Bloomin' Brands needs to boost foot traffic and turn tables faster at existing restaurants or raise prices to generate revenue growth.
Gross Margin & Pricing Power
Gross profit margins tell us how much money a restaurant gets to keep after paying for the direct costs of the meals it sells.
Bloomin' Brands's gross profit margin came in at 17.1% this quarter. down 1.9 percentage points year on year. This means the company makes $0.17 for every $1 in revenue before accounting for its operating expenses.
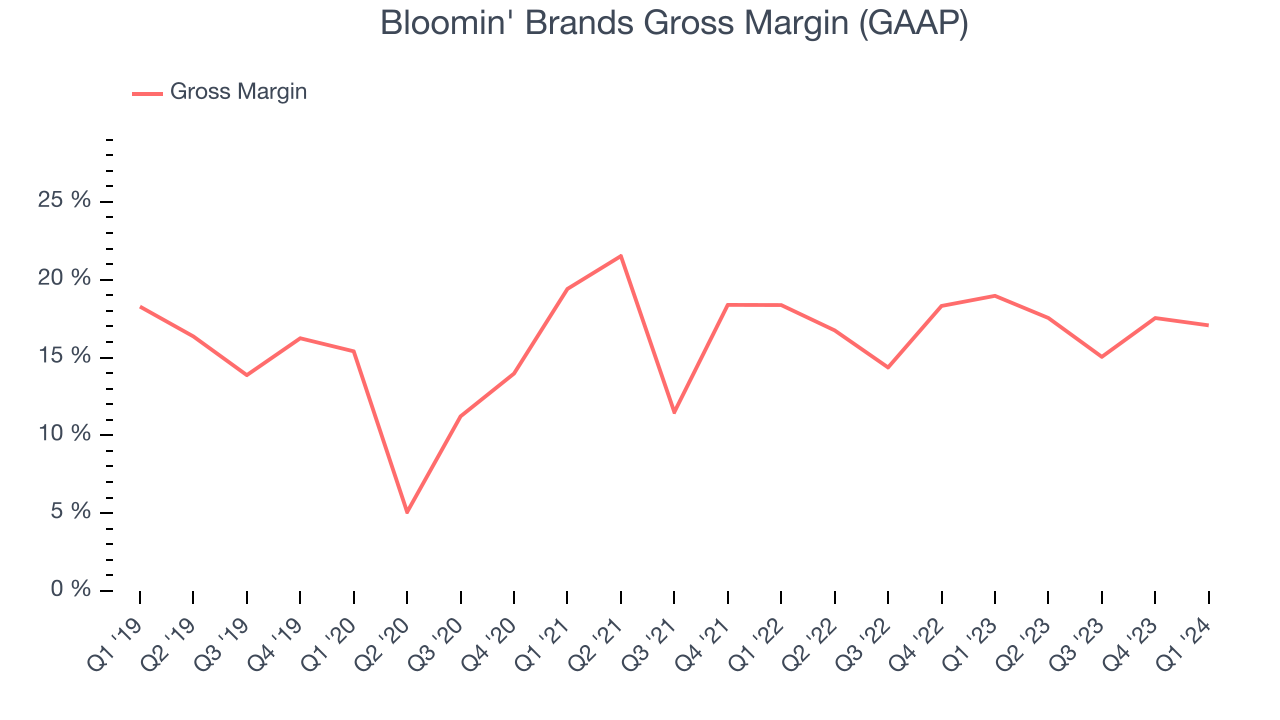
Bloomin' Brands has poor unit economics for a restaurant company, leaving it with little room for error if things go awry. As you can see above, it's averaged a 17% gross margin over the last two years. Its margin has also been trending down over the last year, averaging 1.2% year-on-year decreases each quarter. If this trend continues, it could suggest a more competitive environment where Bloomin' Brands has diminishing pricing power and less favorable input costs (such as ingredients and transportation expenses).
Operating Margin
Operating margin is a key profitability metric for restaurants because it accounts for all expenses keeping the lights on, including wages, rent, advertising, and other administrative costs.
This quarter, Bloomin' Brands generated an operating profit margin of 6.4%, down 3.2 percentage points year on year. Because Bloomin' Brands's operating margin decreased more than its gross margin, we can infer the company was less efficient with its expenses or had lower leverage on its fixed costs.
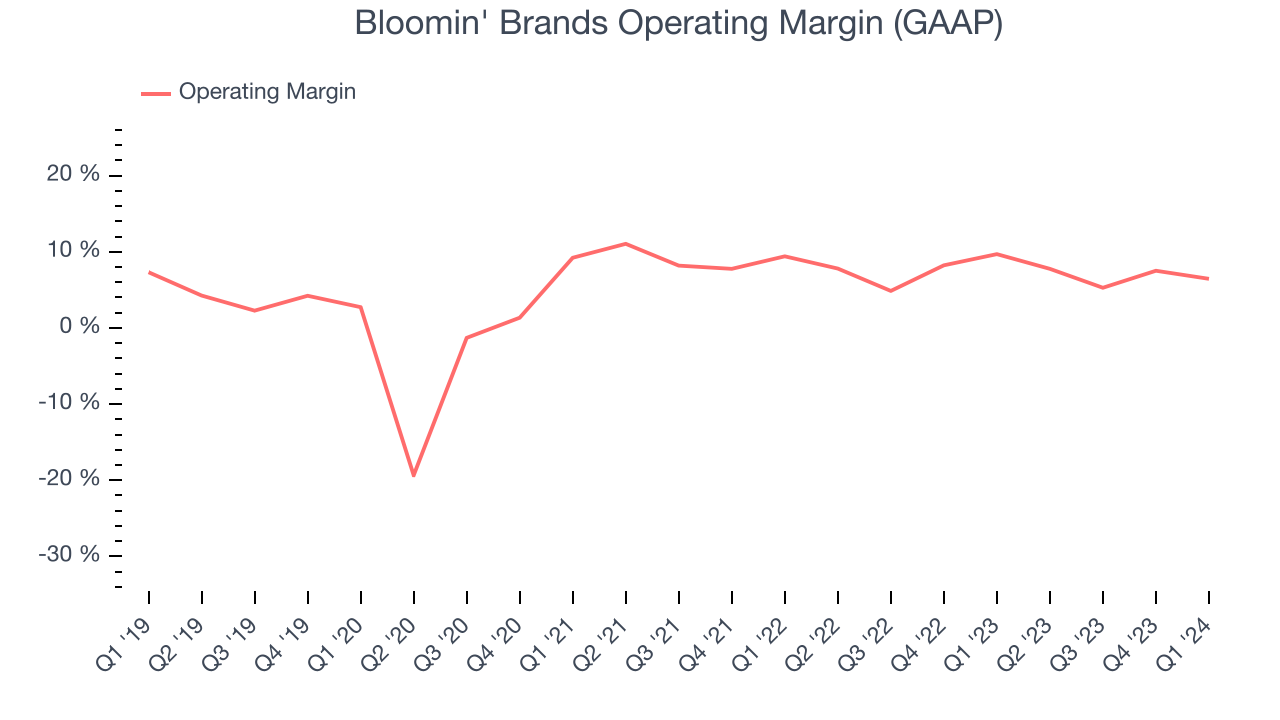 Zooming out, Bloomin' Brands was profitable over the last two years but held back by its large expense base. It's demonstrated mediocre profitability for a restaurant business, producing an average operating margin of 7.3%. Its margin has also seen few fluctuations, meaning it will take a big change to improve profitability.
EPS
Earnings growth is a critical metric to track, but for long-term shareholders, earnings per share (EPS) is more telling because it accounts for dilution and share repurchases.
In Q1, Bloomin' Brands reported EPS at $0.70, down from $0.98 in the same quarter a year ago. This print unfortunately missed Wall Street's estimates, but we care more about long-term EPS growth rather than short-term movements.
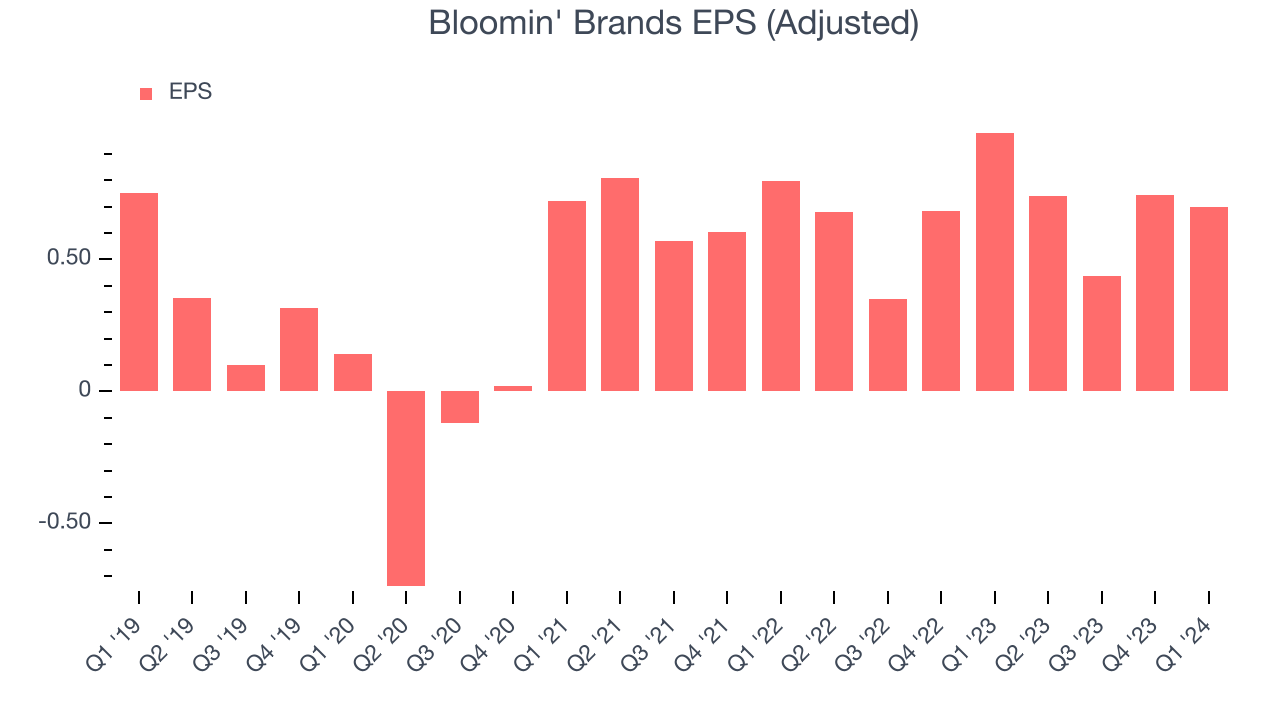
Wall Street expects the company to continue growing earnings over the next 12 months, with analysts projecting an average 1.4% year-on-year increase in EPS.
Return on Invested Capital (ROIC)
EPS and free cash flow tell us whether a company was profitable while growing revenue. But was it capital-efficient? A company’s ROIC explains this by showing how much operating profit a company makes compared to how much money the business raised (debt and equity).
Although Bloomin' Brands hasn't been the highest-quality company lately because of its poor top-line performance, it historically did a solid job investing in profitable business initiatives. Its five-year average ROIC was 13.1%, higher than most restaurant companies.
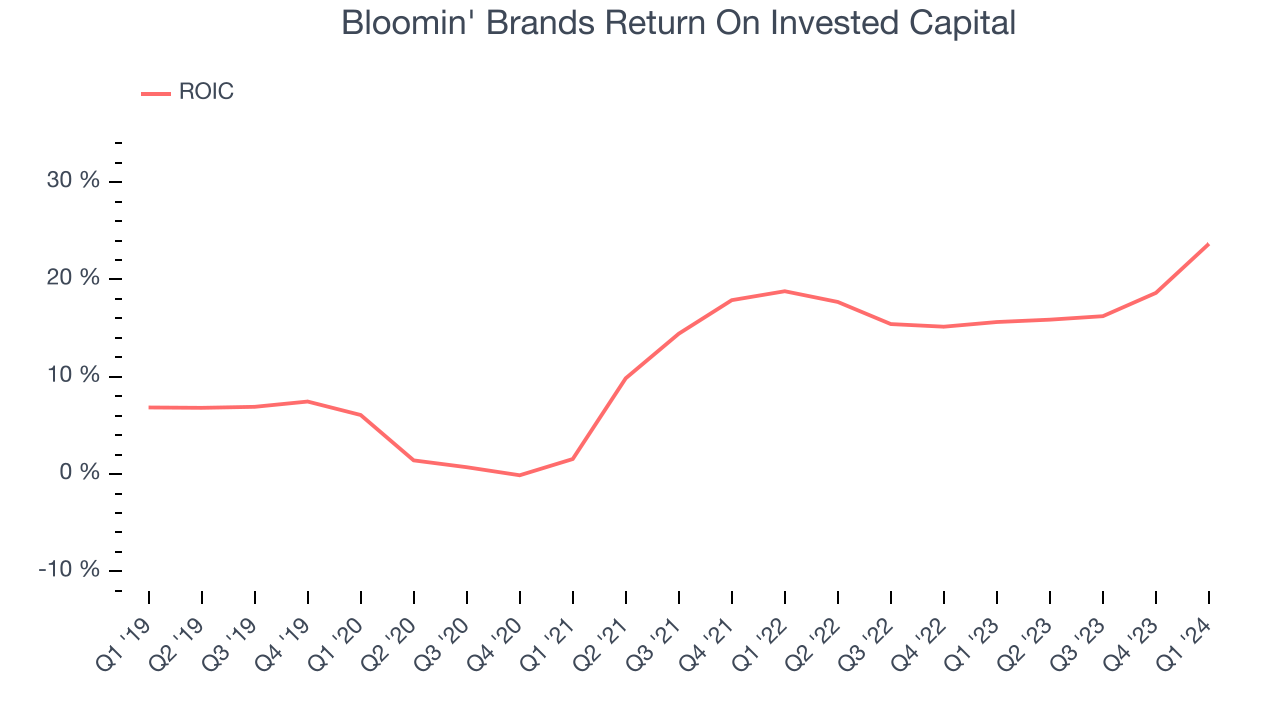
The trend in its ROIC, however, is often what surprises the market and drives the stock price. Over the last few years, Bloomin' Brands's ROIC has significantly increased. This is a good sign, and we hope the company can continue improving.
Key Takeaways from Bloomin' Brands's Q1 Results
It was disappointing to see Bloomin' Brands miss analysts' revenue and EPS estimates this quarter as its same-store sales fell 1.6%. On the bright side, its gross margin outperformed while its full-year earnings guidance beat Wall Street's expectations. Overall, this was a mediocre quarter for Bloomin' Brands. The stock is flat after reporting and currently trades at $24.8 per share.
Is Now The Time?
Bloomin' Brands may have had a tough quarter, but investors should also consider its valuation and business qualities when assessing the investment opportunity.
We cheer for all companies serving consumers, but in the case of Bloomin' Brands, we'll be cheering from the sidelines. Its revenue growth has been weak over the last five years, and analysts expect growth to deteriorate from here. And while its well-known reputation makes consumers more likely to eat at its restaurants, the downside is its projected EPS for the next year is lacking. On top of that, its poor same-store sales performance has been a headwind.
Bloomin' Brands's price-to-earnings ratio based on the next 12 months is 9.4x. While there are some things to like about Bloomin' Brands and its valuation is reasonable, we think there are better opportunities elsewhere in the market right now.
Wall Street analysts covering the company had a one-year price target of $29.50 per share right before these results (compared to the current share price of $24.80).
To get the best start with StockStory, check out our most recent stock picks, and then sign up to our earnings alerts by adding companies to your watchlist here. We typically have the quarterly earnings results analyzed within seconds of the data being released, and especially for companies reporting pre-market, this often gives investors the chance to react to the results before the market has fully absorbed the information.