
Restaurant company Cracker Barrel (NASDAQ:CBRL) announced better-than-expected results in Q2 FY2024, with revenue flat year on year at $935.4 million. The company's full-year revenue guidance of $3.55 billion at the midpoint also came in 2.3% above analysts' estimates. It made a non-GAAP profit of $1.37 per share, down from its profit of $1.48 per share in the same quarter last year.
Cracker Barrel (CBRL) Q2 FY2024 Highlights:
- Revenue: $935.4 million vs analyst estimates of $917.8 million (1.9% beat)
- EPS (non-GAAP): $1.37 vs analyst expectations of $1.41 (3.1% miss)
- The company lifted its revenue guidance for the full year from $3.45 billion to $3.55 billion at the midpoint, a 2.9% increase (above current expectations)
- Free Cash Flow of $51.23 million is up from -$40.43 million in the previous quarter
- Gross Margin (GAAP): 31.8%, up from 31.4% in the same quarter last year
- Same-Store Sales were up 1.2% year on year (beat vs. expectations of a slight decline)
- Store Locations: 725 at quarter end, increasing by 4 over the last 12 months
- Market Capitalization: $1.60 billion
Known for its country-themed food and merchandise, Cracker Barrel (NASDAQ:CBRL) is a beloved American restaurant and retail chain that celebrates the warmth and charm of Southern hospitality.
The company was founded in 1969 when founder Dan Evins envisioned creating a welcoming stop along the highway to provide travelers with a taste of home-cooked Southern meals and a place to rest and relax. This idea led to the first Cracker Barrel Old Country Store in Lebanon, Tennessee.
Today, Cracker Barrel is a nationwide brand and has become a cherished destination for travelers and locals alike. Its extensive menu features classic favorites such as chicken and dumplings, meatloaf, and country-fried steak, served with delectable sides including macaroni and cheese, green beans, and cornbread.
The Cracker Barrel experience, however, is about more than just delicious food; it's a journey back in time. Each restaurant evokes the nostalgic charm of an old country store, complete with wooden rocking chairs on the front porch, vintage memorabilia, and unique decorations that tell a story of American heritage.
To further immerse themselves, guests can also explore the fan-favorite Cracker Barrel gift shop after their meals, offering anything from country-inspired clothing and home décor to old-school toys and classic candies. Just like its meals, Cracker Barrel's retail offerings are carefully curated to reflect the best of country living.
Sit-Down Dining
Sit-down restaurants offer a complete dining experience with table service. These establishments span various cuisines and are renowned for their warm hospitality and welcoming ambiance, making them perfect for family gatherings, special occasions, or simply unwinding. Their extensive menus range from appetizers to indulgent desserts and wines and cocktails. This space is extremely fragmented and competition includes everything from publicly-traded companies owning multiple chains to single-location mom-and-pop restaurants.
Full-service restaurant competitors include Bloomin’ Brands (NASDAQ:BLMN), Darden Restaurants (NYSE:DRI), Dine Brands (NYSE:DIN), and Texas Roadhouse (NASDAQ:TXRH).Sales Growth
Cracker Barrel is one of the larger restaurant chains in the industry and benefits from a strong brand, giving it customer mindshare and influence over purchasing decisions.
As you can see below, the company's annualized revenue growth rate of 2.4% over the last four years (we compare to 2019 to normalize for COVID-19 impacts) was weak , but to its credit, it opened new restaurants and grew sales at existing, established dining locations.
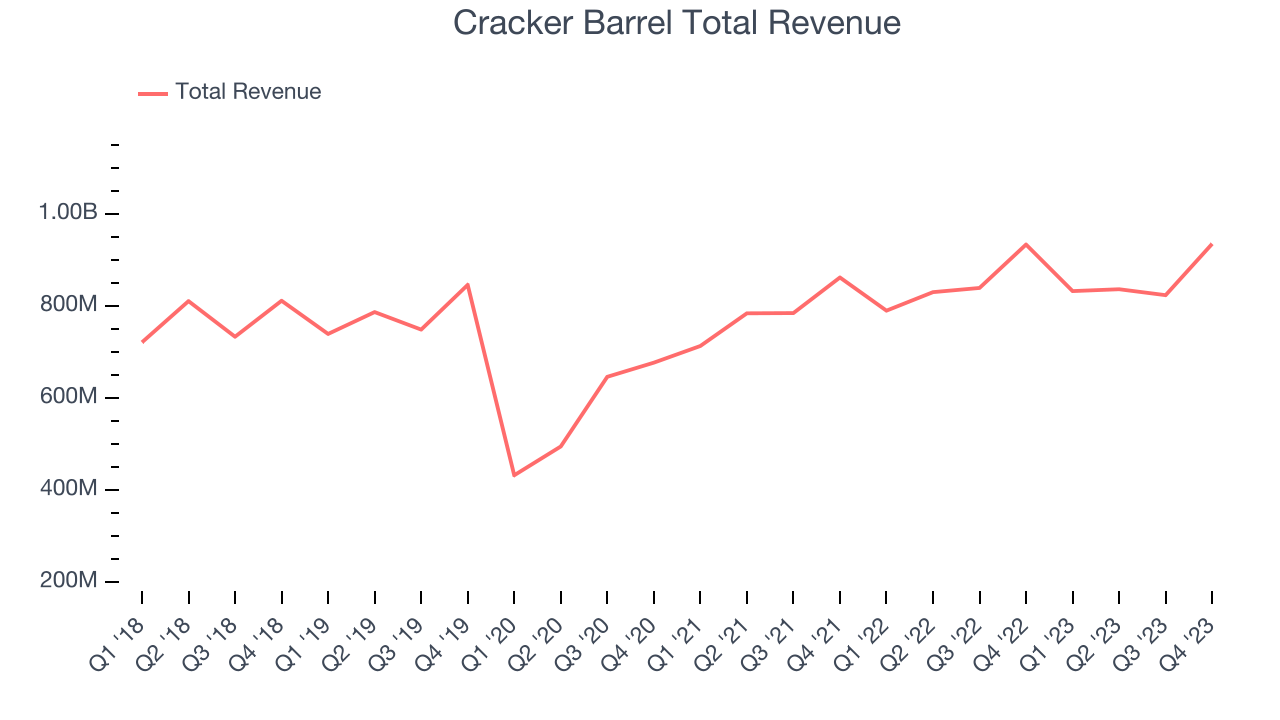
This quarter, Cracker Barrel reported decent year-on-year revenue growth of 0.2%, and its $935.4 million in revenue topped Wall Street's estimates by 1.9%. Looking ahead, Wall Street expects sales to grow 2.2% over the next 12 months, an acceleration from this quarter.
Number of Stores
The number of dining locations a restaurant chain operates is a major determinant of how much it can sell and how quickly company-level sales can grow.
When a chain like Cracker Barrel is opening new restaurants, it usually means it's investing for growth because there's healthy demand for its meals and there are markets where the concept has few or no locations. As of the most recently reported quarter, Cracker Barrel operated 725 total locations, in line with its restaurant count a year ago.
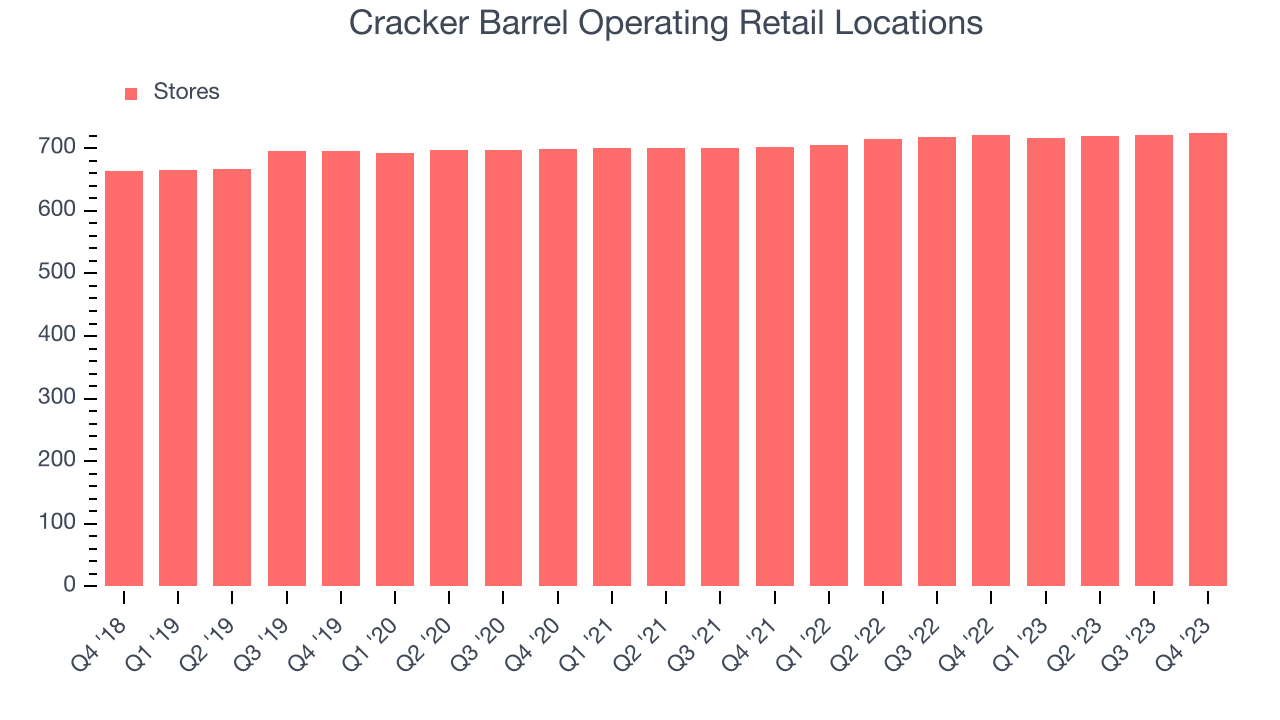
Taking a step back, Cracker Barrel has generally opened new restaurants over the last eight quarters, averaging 1.4% annual increases in new locations. This growth is decent compared to other restaurant businesses but should be taken lightly as the industry is quite mature. Analyzing a restaurant's location growth is important because expansion means Cracker Barrel has more opportunities to feed customers and generate sales.
Same-Store Sales
A company's same-store sales growth shows the year-on-year change in sales for its restaurants that have been open for at least a year, give or take. This is a key performance indicator because it measures organic growth and demand.
Cracker Barrel's demand within its existing restaurants has generally risen over the last two years but lagged behind the broader sector. On average, the company's same-store sales have grown by 5.4% year on year. With positive same-store sales growth amid an increasing number of restaurants, Cracker Barrel is reaching more diners and growing sales.
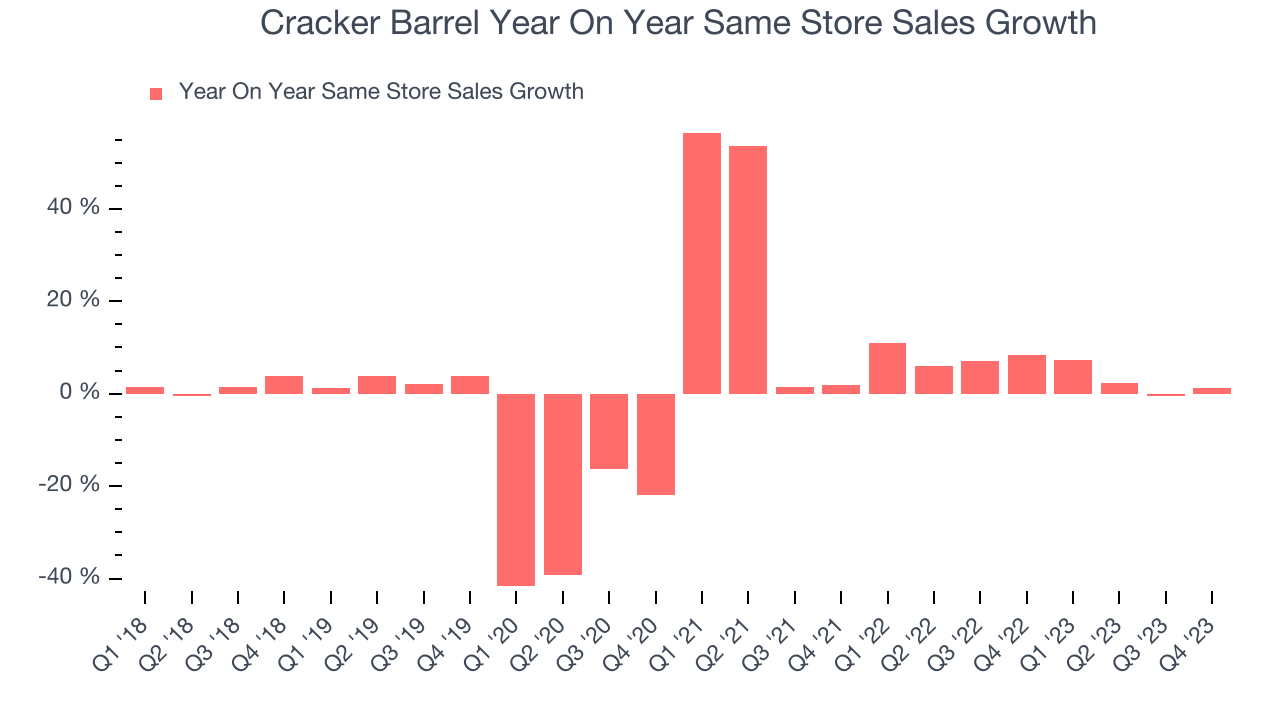
In the latest quarter, Cracker Barrel's same-store sales rose 1.2% year on year. By the company's standards, this growth was a meaningful deceleration from the 8.4% year-on-year increase it posted 12 months ago. We'll be watching Cracker Barrel closely to see if it can reaccelerate growth.
Gross Margin & Pricing Power
Gross profit margins are an important measure of a restaurant's pricing power and differentiation, whether it be the dining experience or quality and taste of food.
In Q2, Cracker Barrel's gross profit margin was 31.8%. in line with the same quarter last year. This means the company makes $0.32 for every $1 in revenue before accounting for its operating expenses. 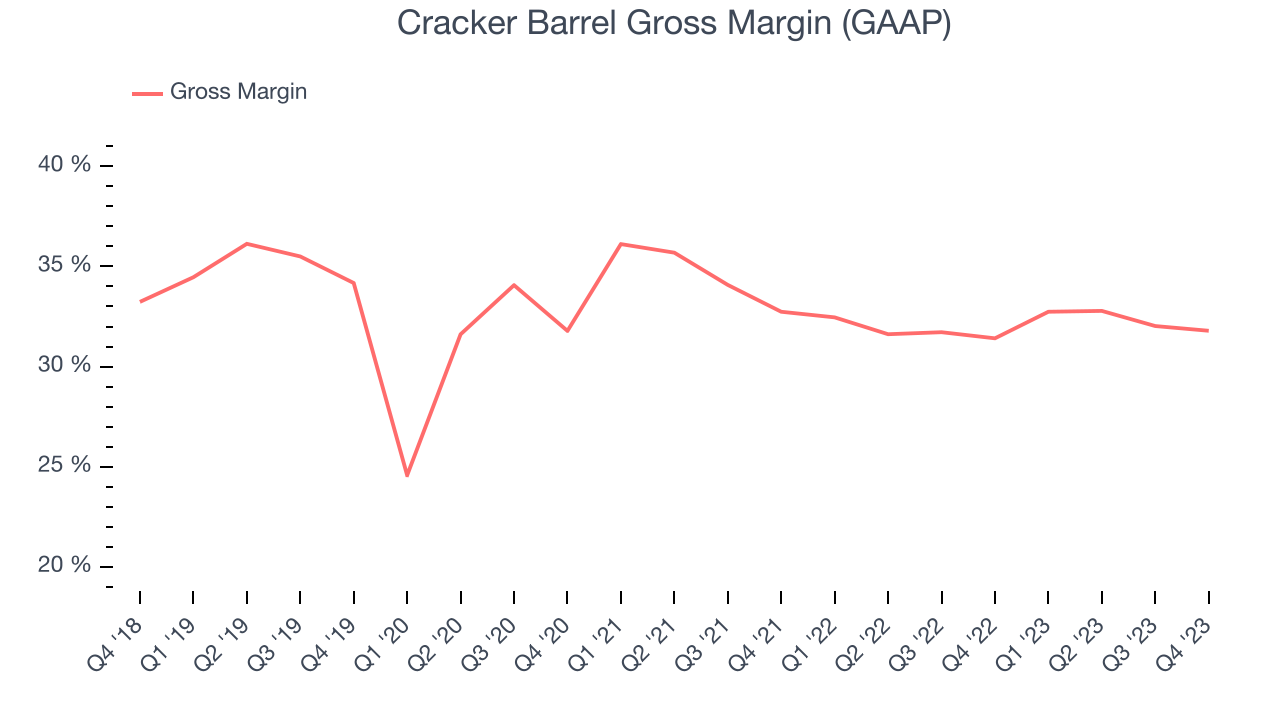
Cracker Barrel has good unit economics for a restaurant company, giving it the opportunity to invest in areas such as marketing and talent to stay competitive. As you can see above, it's averaged a healthy 32.1% gross margin over the last two years. Its margin has also been trending up over the last 12 months, averaging 1.7% year-on-year increases each quarter. If this trend continues, it could suggest a less competitive environment where the company has better pricing power and more stable input costs (such as ingredients and transportation expenses).
Operating Margin
Operating margin is an important measure of profitability for restaurants as it accounts for all expenses keeping the lights on, including wages, rent, advertising, and other administrative costs.
In Q2, Cracker Barrel generated an operating profit margin of 3.3%, in line with the same quarter last year. This indicates the company's costs have been relatively stable.
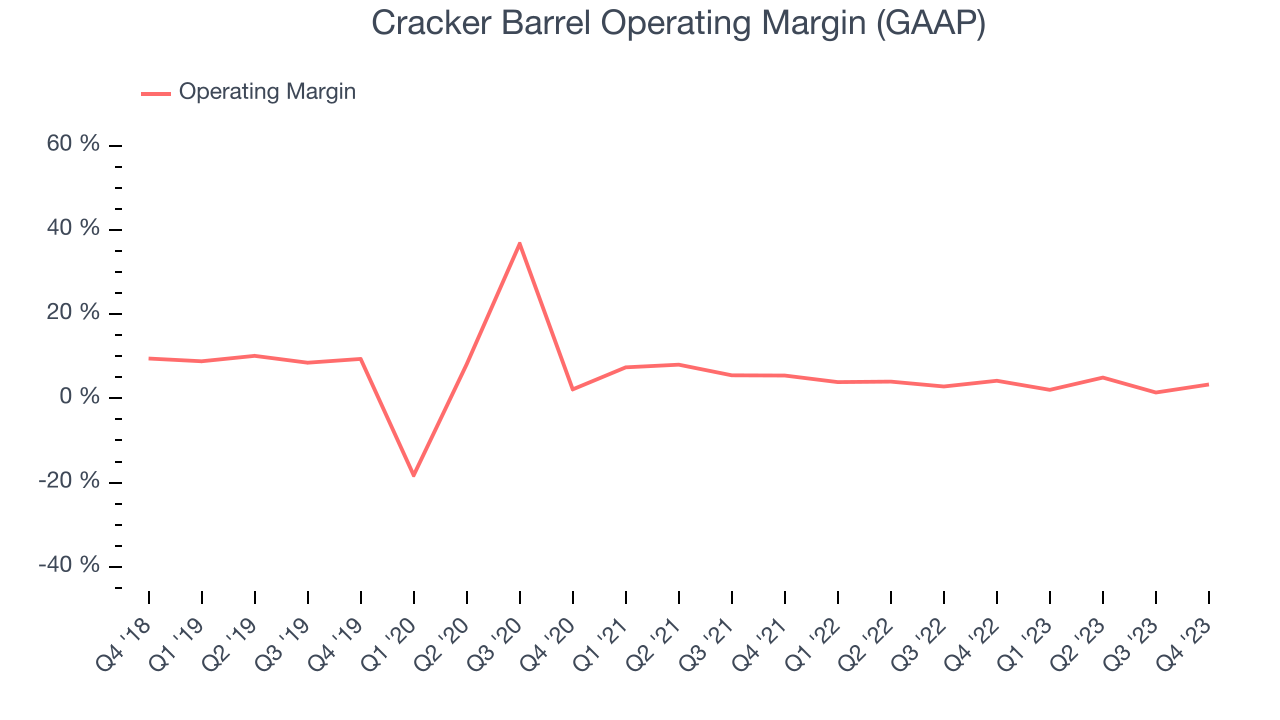 Zooming out, Cracker Barrel was profitable over the last two years but held back by its large expense base. Its average operating margin of 3.3% has been paltry for a restaurant business. Its margin has also seen few fluctuations, meaning it will take a big change to improve profitability.
EPS
These days, some companies issue new shares like there's no tomorrow. That's why we like to track earnings per share (EPS) because it accounts for shareholder dilution and share buybacks.
In Q2, Cracker Barrel reported EPS at $1.37, down from $1.48 in the same quarter a year ago. This print unfortunately missed Wall Street's estimates, but we care more about long-term EPS growth rather than short-term movements.
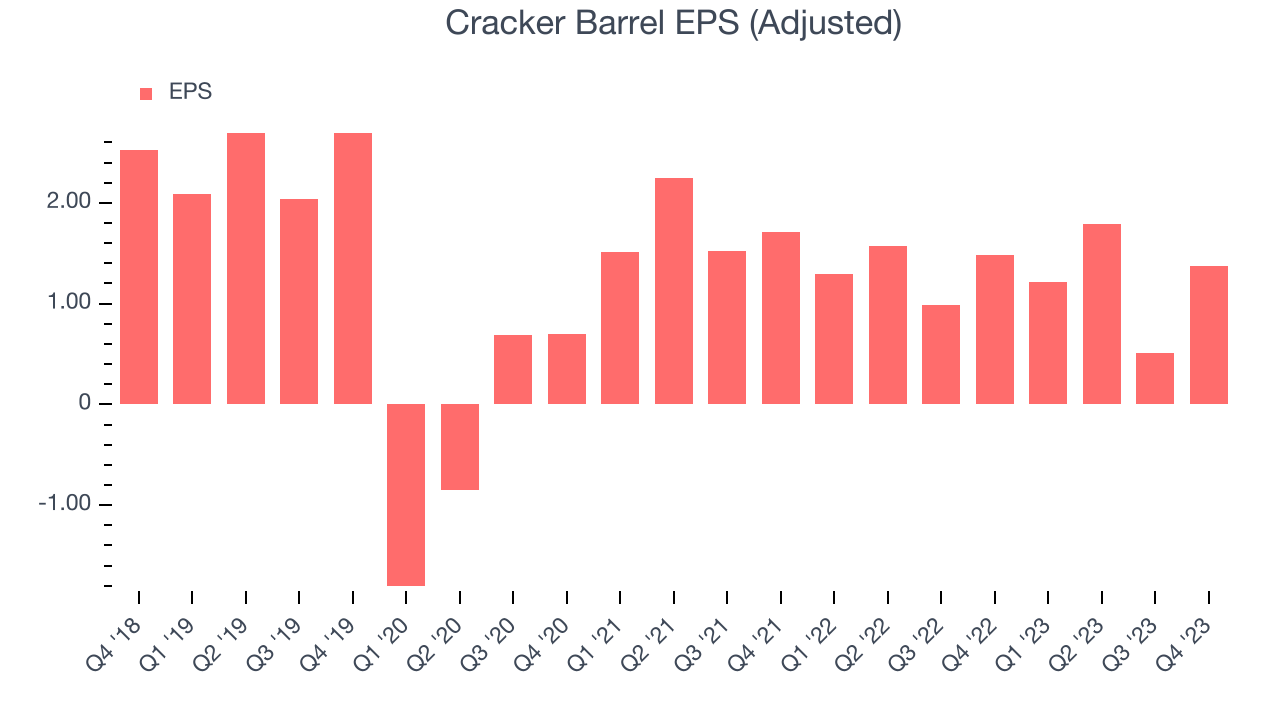
Between FY2020 and FY2024, Cracker Barrel's adjusted diluted EPS dropped 48.7%, translating into 15.4% annualized declines. We tend to steer our readers away from companies with falling EPS, especially restaurants, which are arguably some of the hardest businesses to manage because of constantly changing consumer tastes, input costs, and labor dynamics. If there's no earnings growth, it's difficult to build confidence in a company's underlying fundamentals, leaving a low margin of safety around its valuation (making the stock susceptible to large downward swings).
On the bright side, Wall Street expects the company's earnings to grow over the next 12 months, with analysts projecting an average 2.4% year-on-year increase in EPS.
Cash Is King
Although earnings are undoubtedly valuable for assessing company performance, we believe cash is king because you can't use accounting profits to pay the bills.
Cracker Barrel's free cash flow came in at $51.23 million in Q2, down 31.4% year on year. This result represents a 5.5% margin.
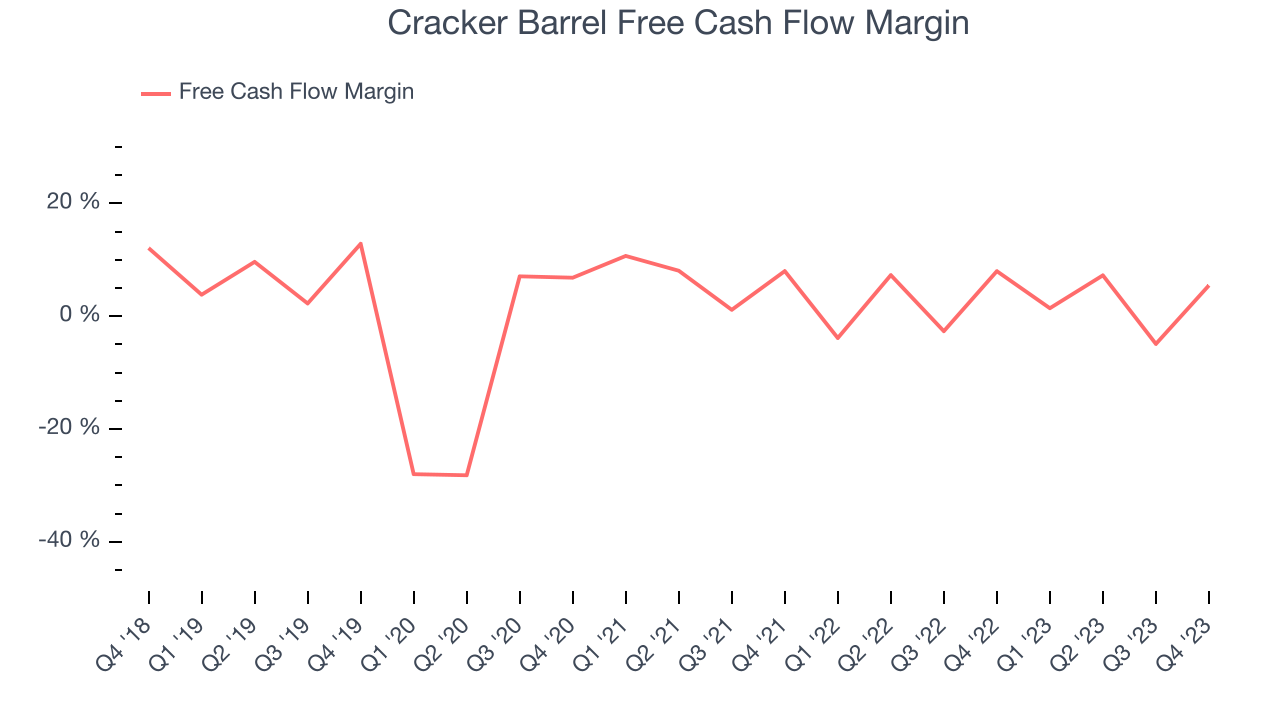
Over the last eight quarters, Cracker Barrel has shown mediocre cash profitability, putting it in a pinch as it gives the company limited opportunities to reinvest, pay down debt, or return capital to shareholders. Its free cash flow margin has averaged 2.4%, subpar for a restaurant business. Cracker Barrel's margin has also been flat during that time, showing the company needs to take action and improve its cash profitability.
Return on Invested Capital (ROIC)
EPS and free cash flow tell us whether a company was profitable while growing revenue. But was it capital-efficient? Enter ROIC, a metric showing how much operating profit a company generates relative to how much money the business raised (debt and equity).
Although Cracker Barrel hasn't been the highest-quality company lately because of its poor top-line performance, it historically did a solid job investing in profitable business initiatives. Its five-year average ROIC was 11.7%, higher than most restaurant companies.
The trend in its ROIC, however, is often what surprises the market and drives the stock price. Unfortunately, Cracker Barrel's ROIC over the last two years averaged 9.5 percentage point decreases each year. We like what management has done historically but are concerned its ROIC is declining, perhaps a symptom of waning business opportunities to invest profitably.
Key Takeaways from Cracker Barrel's Q2 Results
We liked how revenue outperformed Wall Street's estimates. Additionally, full year revenue guidance was raised and came in above expectations. On the other hand, its EPS missed. Zooming out, we think this was still a solid quarter that shareholders will appreciate. The stock is up 1.3% after reporting and currently trades at $73.3 per share.
Is Now The Time?
Cracker Barrel may have had a good quarter, but investors should also consider its valuation and business qualities when assessing the investment opportunity.
We cheer for all companies serving consumers, but in the case of Cracker Barrel, we'll be cheering from the sidelines. Its revenue growth has been weak over the last four years. And while its well-known reputation makes consumers more likely to eat at its restaurants, the downside is its declining EPS over the last four years makes it hard to trust. On top of that, its projected EPS for the next year is lacking.
Cracker Barrel's price-to-earnings ratio based on the next 12 months is 14.5x. While we've no doubt one can find things to like about Cracker Barrel, we think there are better opportunities elsewhere in the market. We don't see many reasons to get involved at the moment.
Wall Street analysts covering the company had a one-year price target of $74.75 per share right before these results (compared to the current share price of $73.30).
To get the best start with StockStory, check out our most recent stock picks, and then sign up to our earnings alerts by adding companies to your watchlist here. We typically have the quarterly earnings results analyzed within seconds of the data being released, and especially for companies reporting pre-market, this often gives investors the chance to react to the results before the market has fully absorbed the information.