
Cable, internet, and telephone services provider Charter (NASDAQ:CHTR) reported results in line with analysts' expectations in Q1 CY2024, with revenue flat year on year at $13.68 billion. It made a GAAP profit of $7.55 per share, improving from its profit of $6.65 per share in the same quarter last year.
Charter (CHTR) Q1 CY2024 Highlights:
- Revenue: $13.68 billion vs analyst estimates of $13.74 billion (small miss)
- Adjusted EBITDA: $5.50 billion vs analyst estimates of $5.46 billion (small beat)
- EPS: $7.55 vs analyst expectations of $7.74 (2.5% miss)
- Gross Margin (GAAP): 38.6%, up from 37.7% in the same quarter last year
- Free Cash Flow of $358 million, down 66.3% from the previous quarter (big miss vs. expectations of $609 million)
- Internet Subscribers: 28,472
- Market Capitalization: $37.41 billion
Operating as Spectrum, Charter (NASDAQ:CHTR) is a leading telecommunications company offering cable television, high-speed internet, and voice services across the United States.
Founded in 1993, Charter initially focused on cable TV services, but over the years, it expanded to meet evolving customer needs. Key acquisitions, including Time Warner Cable and Bright House Networks, solidified Charter's position in the industry, aiming to provide a comprehensive communication and entertainment experience.
Today, Charter delivers cable TV, high-speed internet, and voice services to both residential and business customers. Their offerings address the demand for reliable internet access, diverse entertainment choices, and efficient communication solutions. By providing these integrated services, Charter simplifies the fragmented telecom landscape.
Revenue primarily comes from subscriptions to these services, with a focus on quality, reliability, and customer service. Charter's adaptability and commitment to customer satisfaction have made it a leading telecom provider in the U.S. market, appealing to a broad range of customers seeking comprehensive, high-quality telecommunications services.
Cable and Satellite
The massive physical footprints of fiber in the ground or satellites in space make it challenging for companies in this industry to adjust to shifting consumer habits. Over the last decade-plus, consumers have ‘cut the cord’ to their traditional cable subscriptions in favor of streaming options. While that is a headwind, this affinity to streaming means more households need high-speed internet, and companies that successfully serve customers can enjoy high retention rates and pricing power since the options for internet connectivity in any geography is usually limited.
Competitors in the telecommunications and media services industry include Comcast (NASDAQ:CMCSA), DISH Network (NASDAQ:DISH), and AT&T (NYSE:T).Sales Growth
A company’s long-term performance can give signals about its business quality. Even a bad business can shine for one or two quarters, but a top-tier one may grow for years. Charter's annualized revenue growth rate of 4.3% over the last five years was weak for a consumer discretionary business. 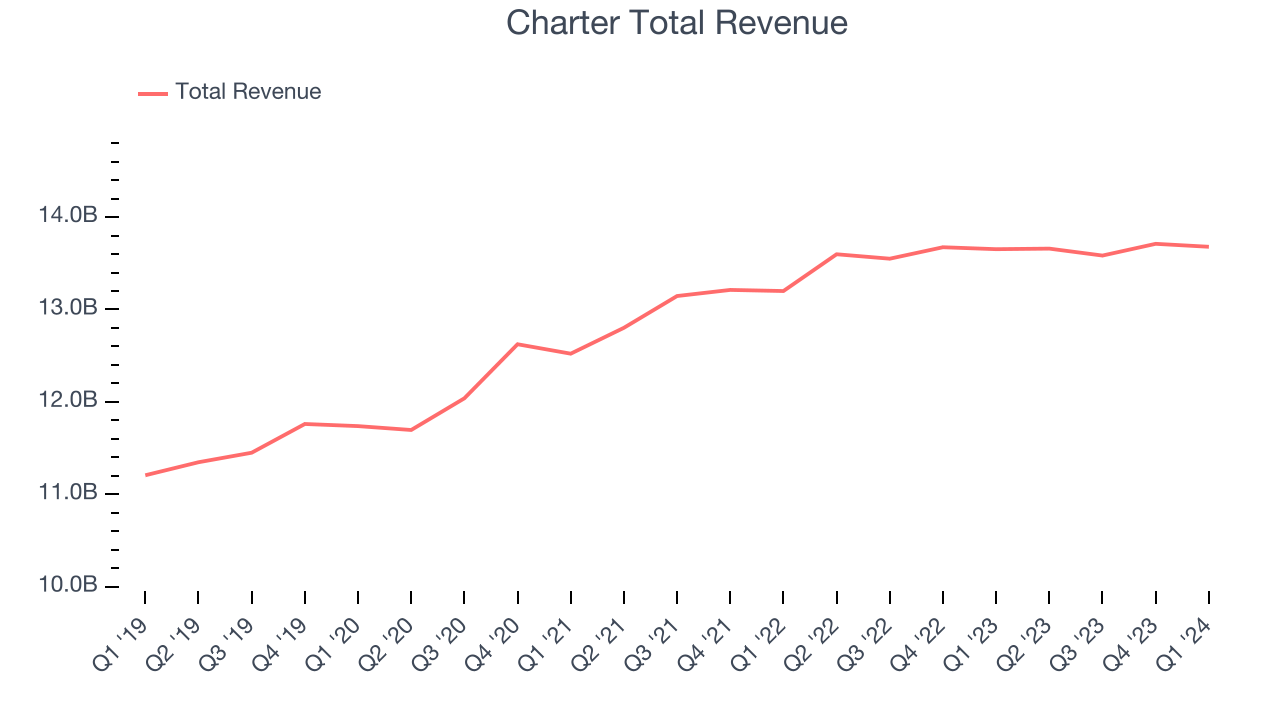 Within consumer discretionary, a long-term historical view may miss a company riding a successful new product or emerging trend. That's why we also follow short-term performance. Charter's recent history shows the business has slowed as its annualized revenue growth of 2.1% over the last two years is below its five-year trend.
This quarter, Charter's $13.68 billion of revenue was flat year on year and in line with Wall Street's estimates. Looking ahead, Wall Street expects revenue to remain flat over the next 12 months.
Operating Margin
Operating margin is a key measure of profitability. Think of it as net income–the bottom line–excluding the impact of taxes and interest on debt, which are less connected to business fundamentals.
Charter has been a well-oiled machine over the last two years. It's demonstrated elite profitability for a consumer discretionary business, boasting an average operating margin of 22.8%.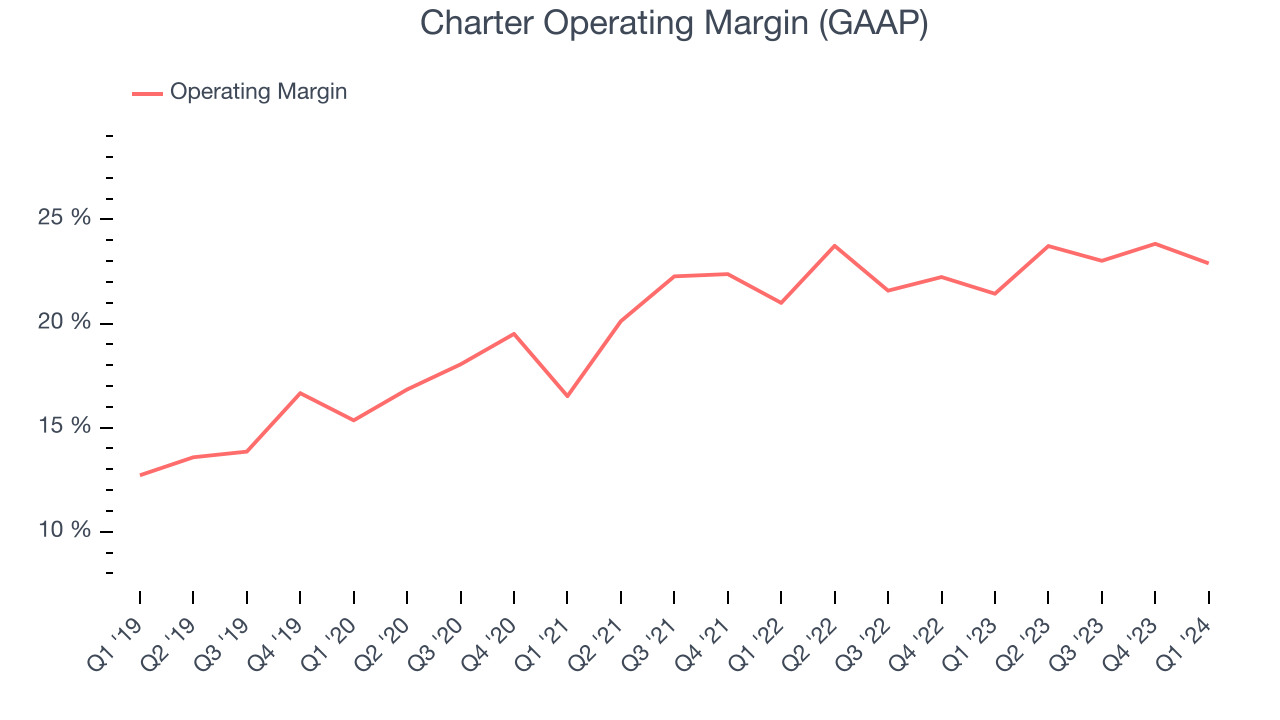
In Q1, Charter generated an operating profit margin of 22.9%, up 1.5 percentage points year on year.
Over the next 12 months, Wall Street expects Charter to maintain its LTM operating margin of 23.4%.EPS
We track long-term historical earnings per share (EPS) growth for the same reason as long-term revenue growth. Compared to revenue, however, EPS highlights whether a company's growth was profitable. 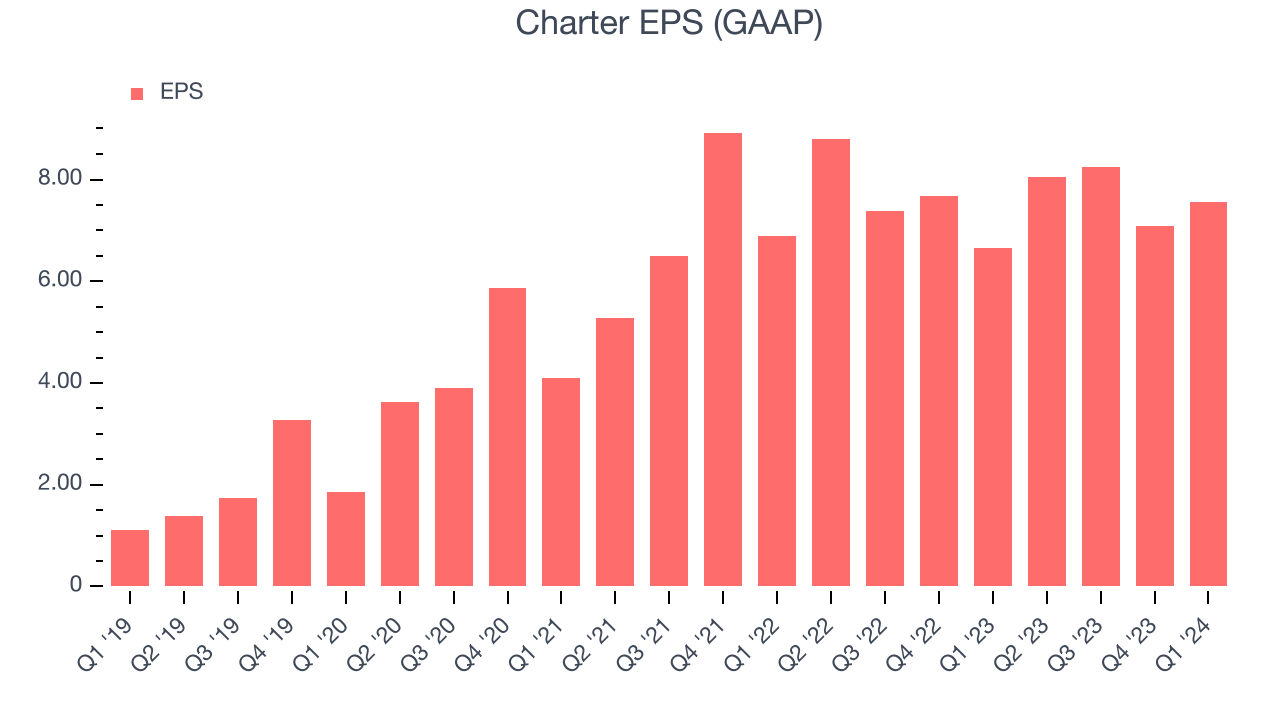
Over the last five years, Charter's EPS grew 407%, translating into an astounding 38.4% compounded annual growth rate. This performance is materially higher than its 4.3% annualized revenue growth over the same period. Let's dig into why.
Charter's operating margin has expanded 10.2 percentage points over the last five years while its share count has shrunk 35.6%. Improving profitability and share buybacks are positive signs as they juice EPS growth relative to revenue growth.In Q1, Charter reported EPS at $7.55, up from $6.65 in the same quarter last year. Despite growing year on year, this print unfortunately missed analysts' estimates, but we care more about long-term EPS growth rather than short-term movements. Over the next 12 months, Wall Street expects Charter to grow its earnings. Analysts are projecting its LTM EPS of $30.93 to climb by 7.4% to $33.23.
Cash Is King
If you've followed StockStory for a while, you know we emphasize free cash flow. Why, you ask? We believe that in the end, cash is king, and you can't use accounting profits to pay the bills.
Over the last two years, Charter has shown mediocre cash profitability, putting it in a pinch as it gives the company limited opportunities to reinvest, pay down debt, or return capital to shareholders. Its free cash flow margin has averaged 7.5%, subpar for a consumer discretionary business.
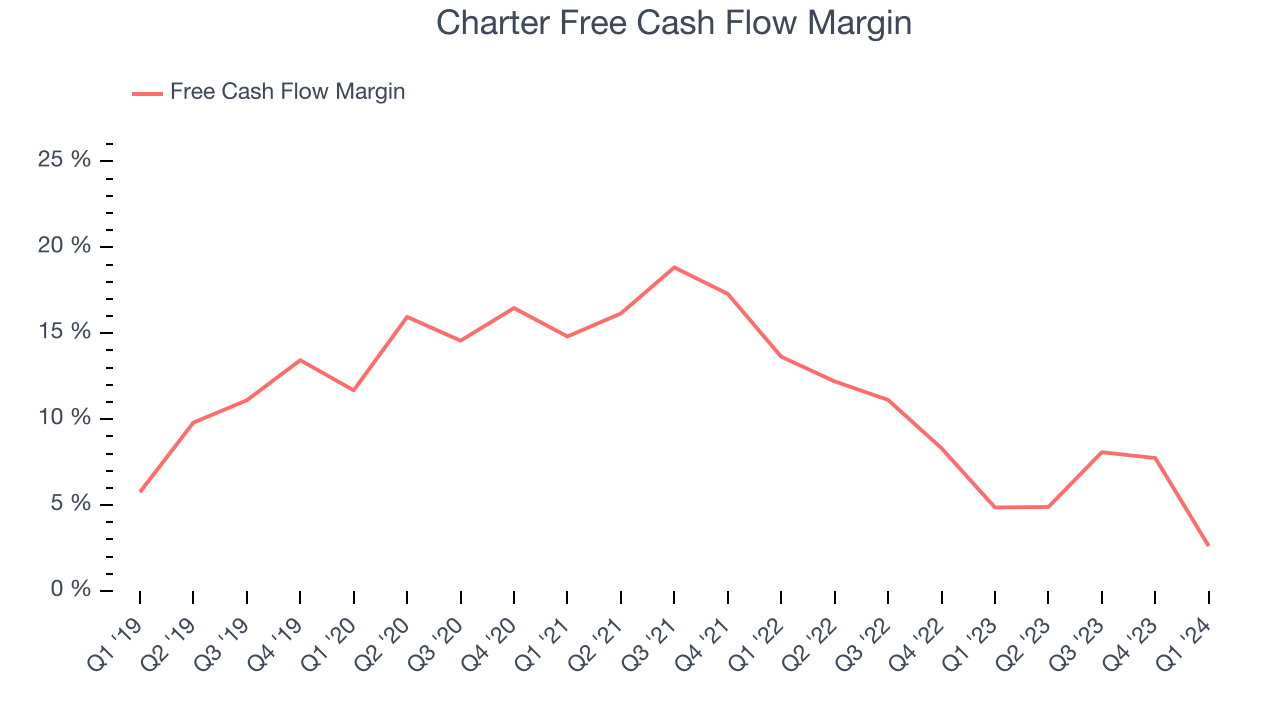
Charter's free cash flow came in at $358 million in Q1, equivalent to a 2.6% margin and down 46.1% year on year.
Return on Invested Capital (ROIC)
EPS and free cash flow tell us whether a company was profitable while growing revenue. But was it capital-efficient? Enter ROIC, a metric showing how much operating profit a company generates relative to how much money the business raised (debt and equity).
Charter's five-year average return on invested capital was 8.9%, somewhat low compared to the best consumer discretionary companies that pump out 25%+. Its returns suggest it historically did a subpar job investing in profitable business initiatives.
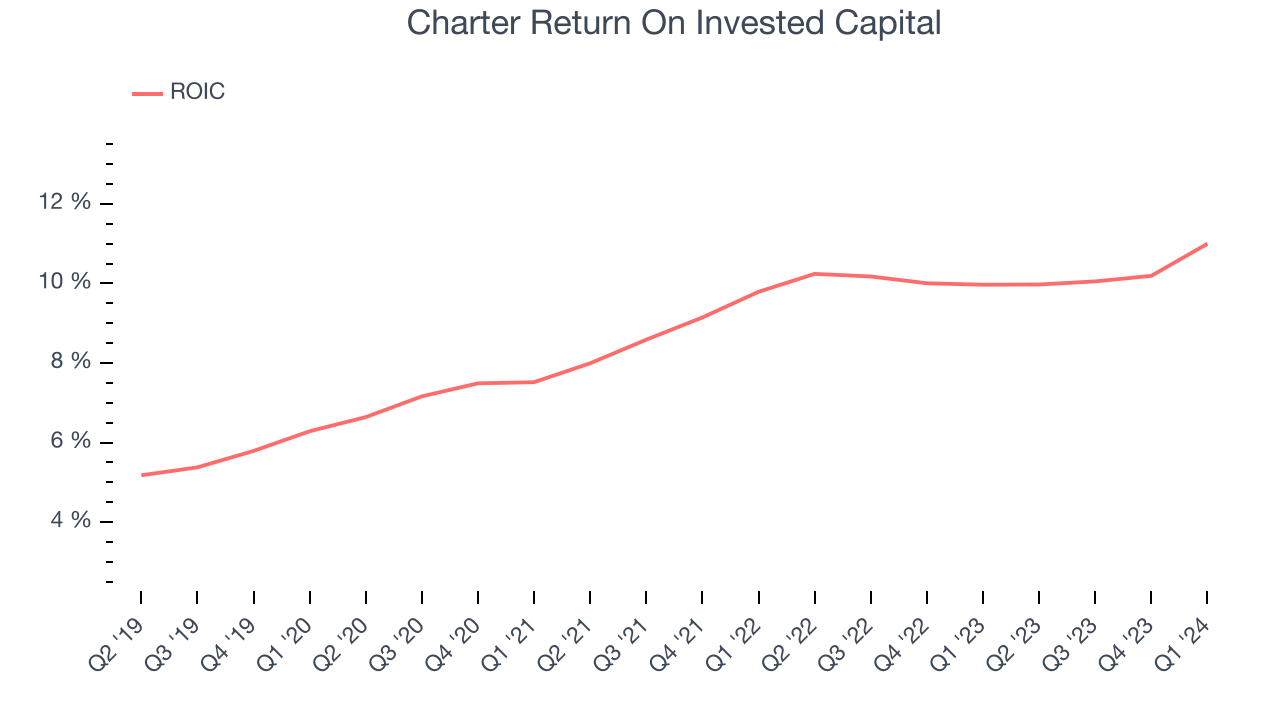
The trend in its ROIC, however, is often what surprises the market and drives the stock price. Over the last few years, Charter's ROIC averaged 3.6 percentage point increases. This is a good sign, and we hope the company can continue improving.
Balance Sheet Risk
Debt is a tool that can boost company returns but presents risks if used irresponsibly.
Charter reported $661 million of cash and $97.97 billion of debt on its balance sheet in the most recent quarter. As investors in high-quality companies, we primarily focus on two things: 1) that a company's debt level isn't too high and 2) that its interest payments are not excessively burdening the business.
With $22.04 billion of EBITDA over the last 12 months, we view Charter's 4.4x net-debt-to-EBITDA ratio as safe. We also see its $5.24 billion of annual interest expenses as appropriate. The company's profits give it plenty of breathing room, allowing it to continue investing in new initiatives.
Key Takeaways from Charter's Q1 Results
It wasn't a great quarter. Charter's revenue, EPS, and free cash flow all fell short of Wall Street's estimates. Internet subscribers were roughly in line, video subscribers missed, and adjusted EBITDA was in line. Overall, the results could have been better. The company is down 2.6% on the results and currently trades at $252.65 per share.
Is Now The Time?
When considering an investment in Charter, investors should take into account its valuation and business qualities as well as what's happened in the latest quarter.
We cheer for all companies serving consumers, but in the case of Charter, we'll be cheering from the sidelines. Its revenue growth has been uninspiring over the last five years, and analysts expect growth to deteriorate from here. And while its EPS growth over the last five years has been fantastic, the downside is its . On top of that, its relatively low ROIC suggests it has historically struggled to find compelling business opportunities.
Charter's price-to-earnings ratio based on the next 12 months is 7.7x. While there are some things to like about Charter and its valuation is reasonable, we think there are better opportunities elsewhere in the market right now.
Wall Street analysts covering the company had a one-year price target of $352.45 per share right before these results (compared to the current share price of $252.65).
To get the best start with StockStory, check out our most recent stock picks, and then sign up for our earnings alerts by adding companies to your watchlist here. We typically have the quarterly earnings results analyzed within seconds of the data being released, and especially for companies reporting pre-market, this often gives investors the chance to react to the results before the market has fully absorbed the information.