
Diner restaurant chain Denny’s (NASDAQ:DENN) fell short of analysts' expectations in Q1 CY2024, with revenue down 6.4% year on year to $110 million. It made a non-GAAP profit of $0.11 per share, down from its profit of $0.13 per share in the same quarter last year.
Denny's (DENN) Q1 CY2024 Highlights:
- Revenue: $110 million vs analyst estimates of $115.2 million (4.5% miss)
- EPS (non-GAAP): $0.11 vs analyst expectations of $0.14 (22.5% miss)
- Full year guidance maintained for same store sales, increased slightly for adjusted EBITDA
- Gross Margin (GAAP): 31.4%, down from 39% in the same quarter last year
- Same-Store Sales were up 1.3% year on year
- Store Locations: 1,614 at quarter end, decreasing by 34 over the last 12 months
- Market Capitalization: $428.1 million
Open around the clock, Denny’s (NASDAQ:DENN) is a chain of diner restaurants serving breakfast and traditional American fare.
Established in 1953 by Harold Butler and Richard Jezak, it initially opened its doors as a donut stand named "Danny's Donuts." Over the decades, it underwent numerous transformations and name changes, but what remained consistent was its commitment to serving hearty meals 24 hours a day.
Today, Denny's is known for dishes like the Grand Slam breakfast, which is a customizable combination of breakfast items such as eggs, pancakes, bacon, sausage, etc. There are also non-breakfast items such as burgers, steaks, and salads. A fulsome kids menu makes sure that Denny’s remains a family-friendly restaurant.
The inside of a Denny’s location channels traditional diners of eras past. There are booths, tables, and counter seating. The ambiance is usually lively, with waiters and waitresses buzzing around with hearty plates and refilling coffee cups while diners of all ages and group sizes chat.
Sit-Down Dining
Sit-down restaurants offer a complete dining experience with table service. These establishments span various cuisines and are renowned for their warm hospitality and welcoming ambiance, making them perfect for family gatherings, special occasions, or simply unwinding. Their extensive menus range from appetizers to indulgent desserts and wines and cocktails. This space is extremely fragmented and competition includes everything from publicly-traded companies owning multiple chains to single-location mom-and-pop restaurants.
Competitors offering breakfast or diner fare include IHOP owner Dine Brands (NYSE:DIN), The Cheesecake Factory (NASDAQ:CAKE), and private company Waffle House.Sales Growth
Denny's is a small restaurant chain, which sometimes brings disadvantages compared to larger competitors benefitting from better brand awareness and economies of scale.
As you can see below, the company's revenue has declined over the last five years, dropping 6.1% annually as it didn't open many new restaurants.
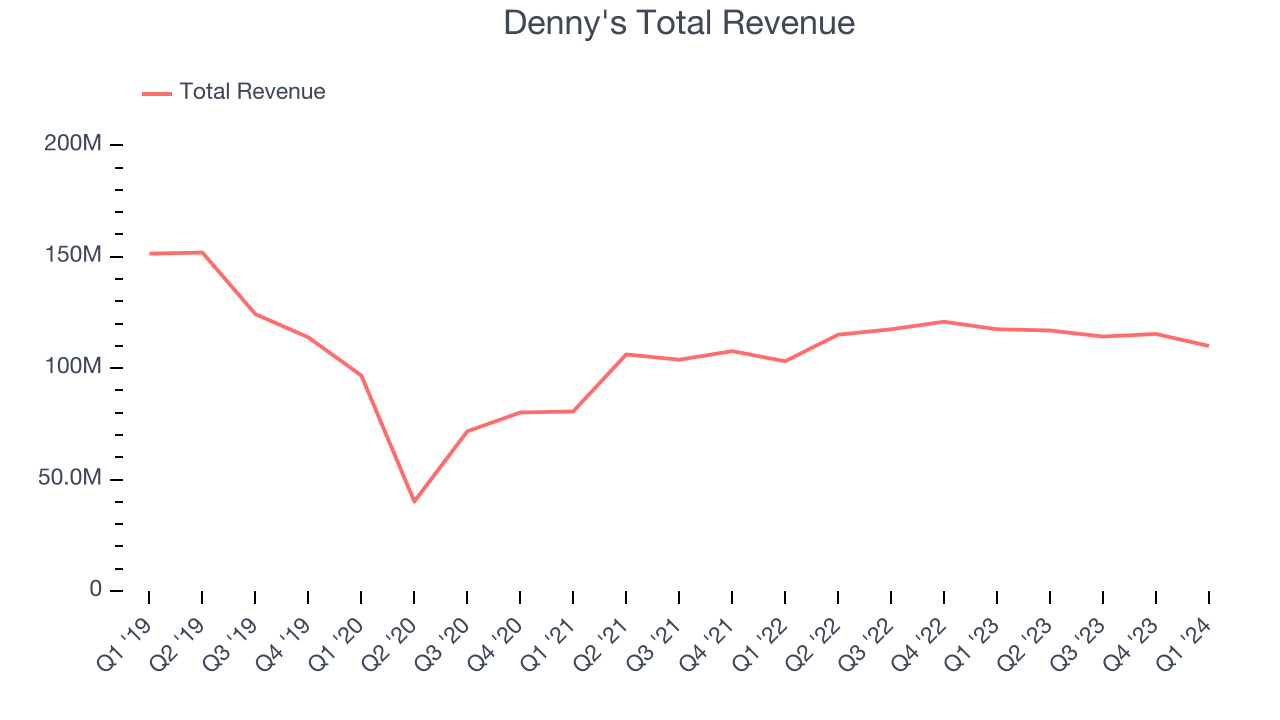
This quarter, Denny's missed Wall Street's estimates and reported a rather uninspiring 6.4% year-on-year revenue decline, generating $110 million in revenue. Looking ahead, Wall Street expects sales to grow 4.2% over the next 12 months, an acceleration from this quarter.
Same-Store Sales
Same-store sales growth is an important metric that tracks organic growth and demand for a restaurant's established locations.
Denny's demand within its existing restaurants has generally risen over the last two years but lagged behind the broader sector. On average, the company's same-store sales have grown by 2.7% year on year. Given its flat restaurant base over the same period, this performance stems from increased foot traffic or larger order sizes per customer at existing locations.
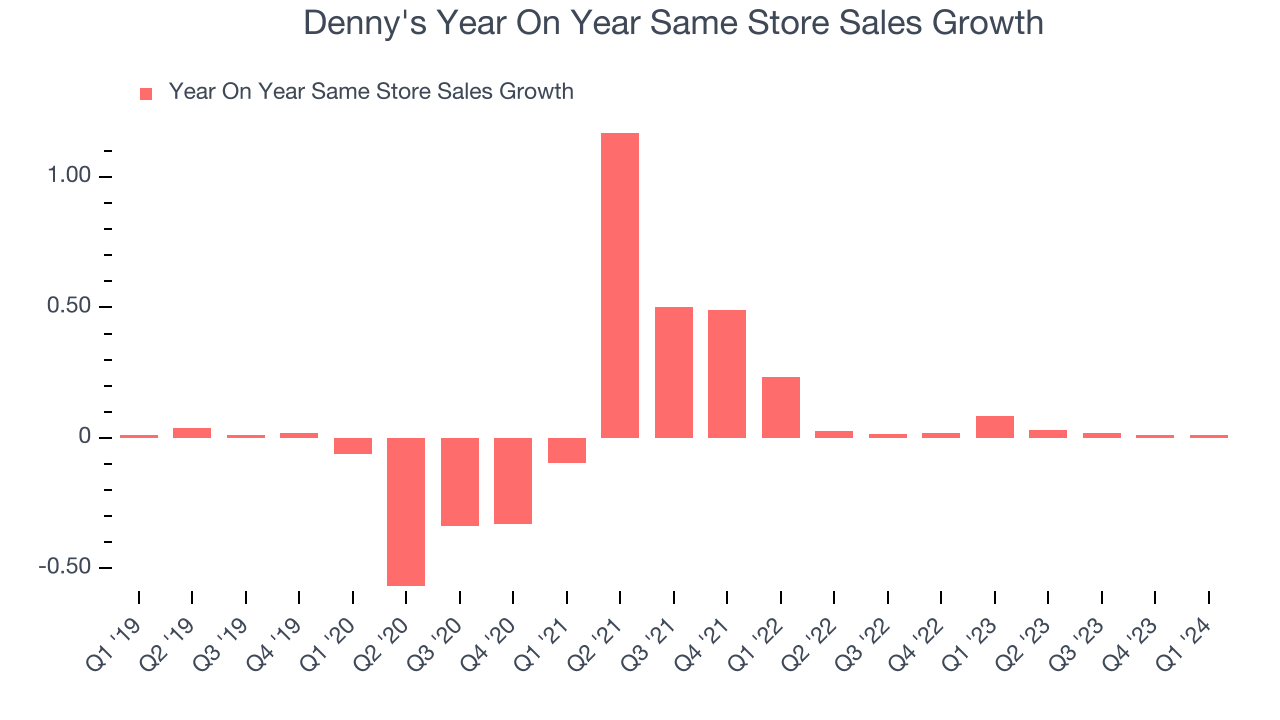
In the latest quarter, Denny's same-store sales rose 1.3% year on year. By the company's standards, this growth was a meaningful deceleration from the 8.4% year-on-year increase it posted 12 months ago. We'll be watching Denny's closely to see if it can reaccelerate growth.
Number of Stores
When a chain like Denny's doesn't open many new restaurants, it usually means there's stable demand for its meals and it's focused on improving operational efficiency to increase profitability. As of the most recently reported quarter, Denny's operated 1,614 total locations, in line with its restaurant count a year ago.
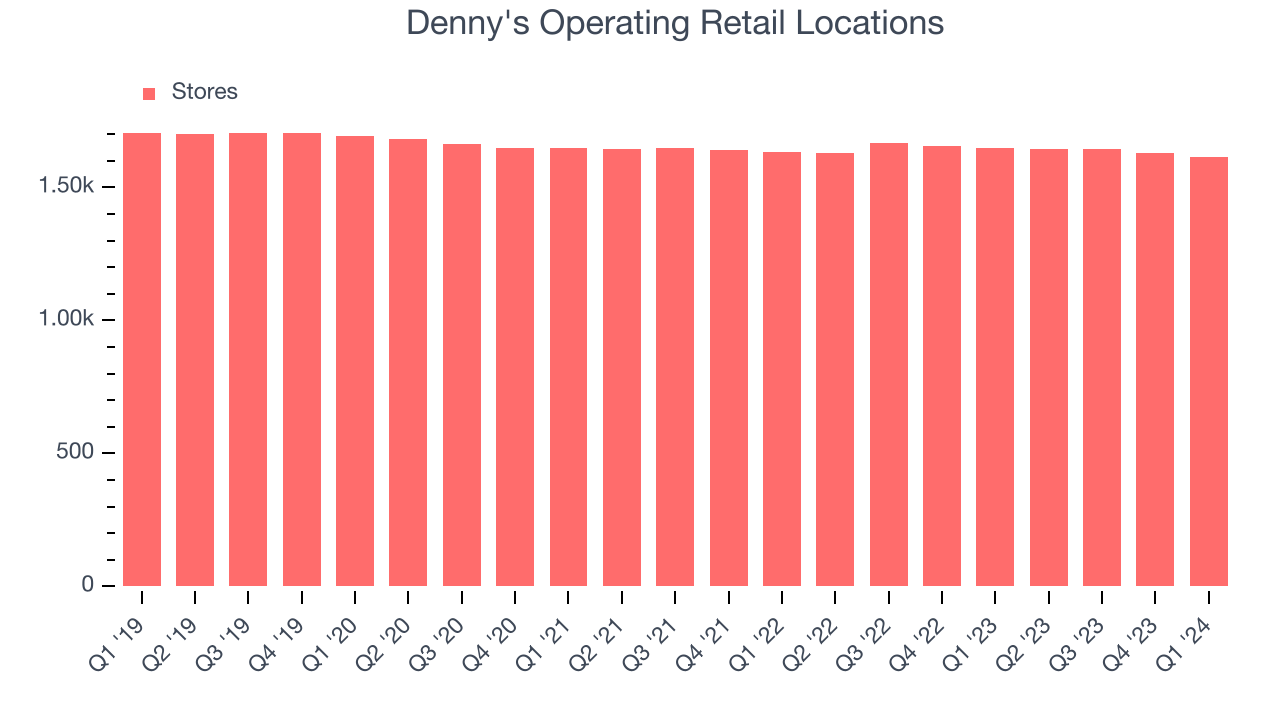
Taking a step back, Denny's has kept its locations more or less flat over the last two years compared to other restaurant businesses. A flat restaurant base means Denny's needs to boost foot traffic and turn tables faster at existing restaurants or raise prices to generate revenue growth.
Gross Margin & Pricing Power
We prefer higher gross margins because they make it easier to generate more operating profits.
Denny's gross profit margin came in at 31.4% this quarter. down 7.7 percentage points year on year. This means the company makes $0.38 for every $1 in revenue before accounting for its operating expenses.
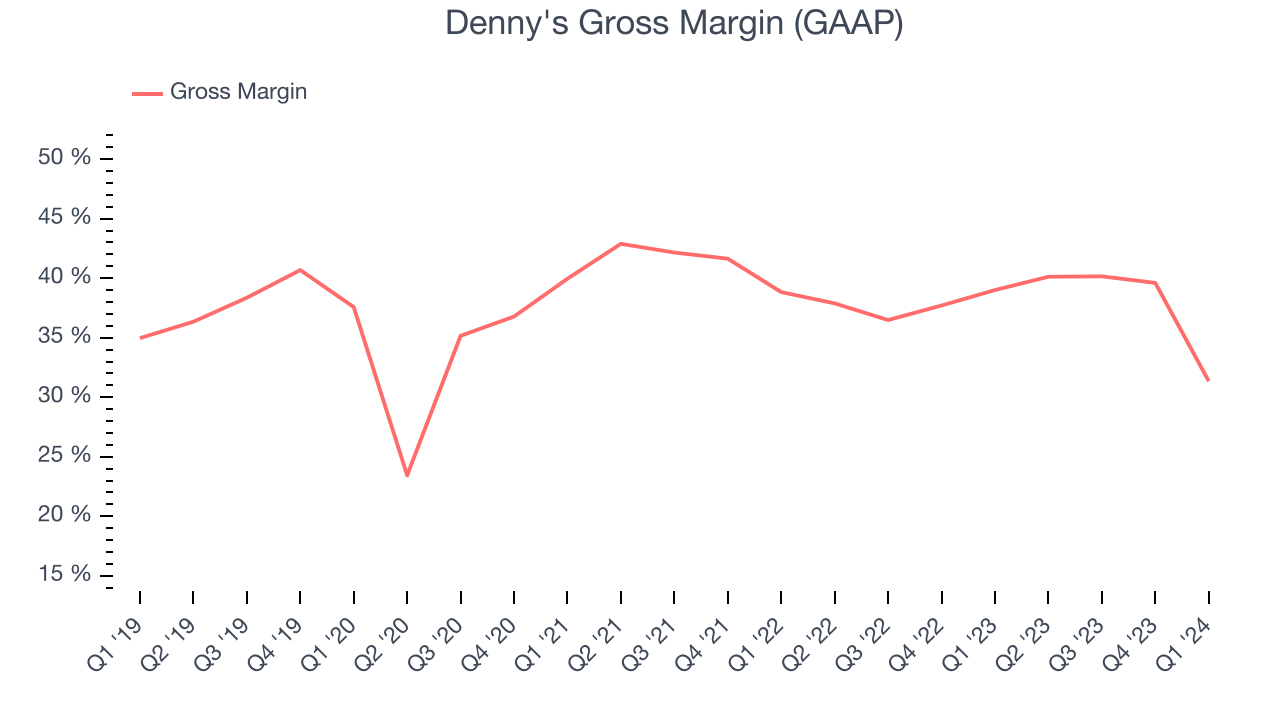
Denny's has great unit economics for a restaurant company, giving it ample room to invest in areas such as marketing and talent to grow its brand. As you can see above, it's averaged an impressive 37.8% gross margin over the last eight quarters. Its margin has also been consistent over the last year, suggesting it has stable input costs (such as ingredients and transportation expenses).
Operating Margin
Operating margin is an important measure of profitability for restaurants as it accounts for all expenses keeping the lights on, including wages, rent, advertising, and other administrative costs.
This quarter, Denny's generated an operating profit margin of 9.1%, down 4.6 percentage points year on year. This reduction was driven by weaker pricing power or higher ingredient/transportation costs, as indicated by the company's larger drop in gross margin.
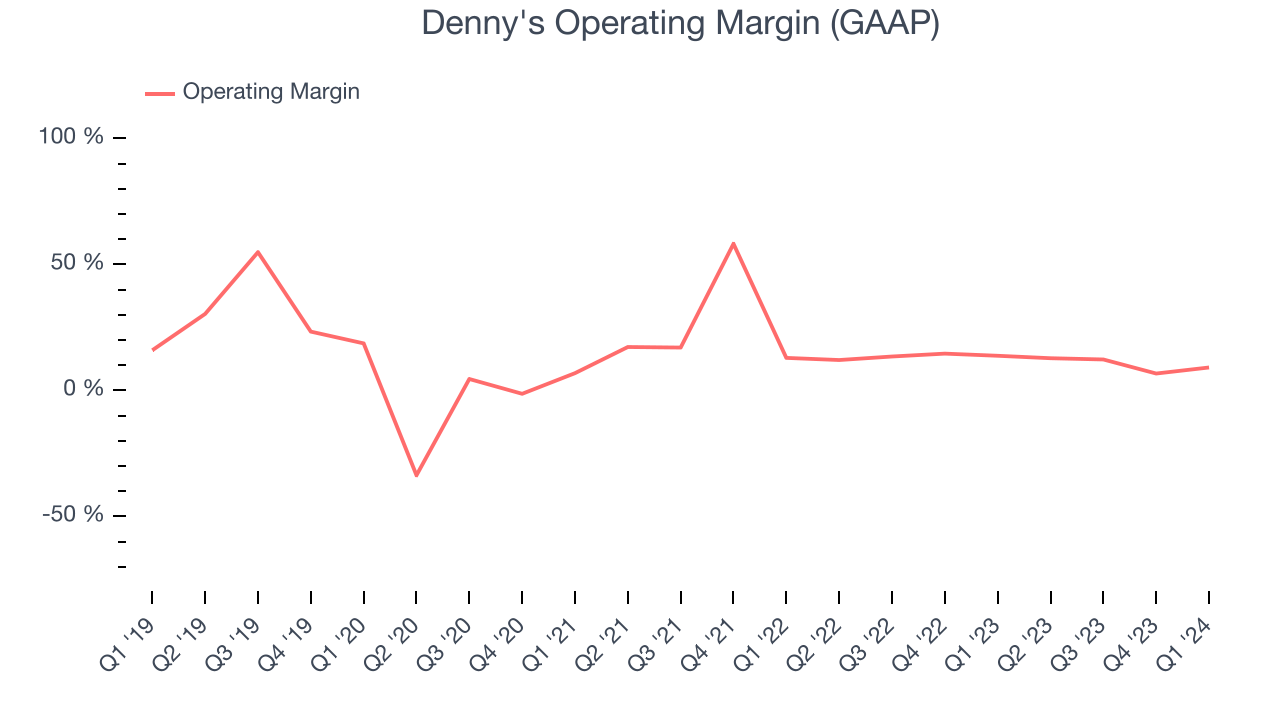 Zooming out, Denny's has done a decent job managing its expenses over the last eight quarters. The company has produced an average operating margin of 11.9%, higher than the broader restaurant sector. However, Denny's margin has declined, on average, by 3.3 percentage points each year. Although this isn't the end of the world, investors are likely hoping for better results in the future.
 EPS
Earnings growth is a critical metric to track, but for long-term shareholders, earnings per share (EPS) is more telling because it accounts for dilution and share repurchases.
In Q1, Denny's reported EPS at $0.11, down from $0.13 in the same quarter a year ago. This print unfortunately missed Wall Street's estimates, but we care more about long-term EPS growth rather than short-term movements.
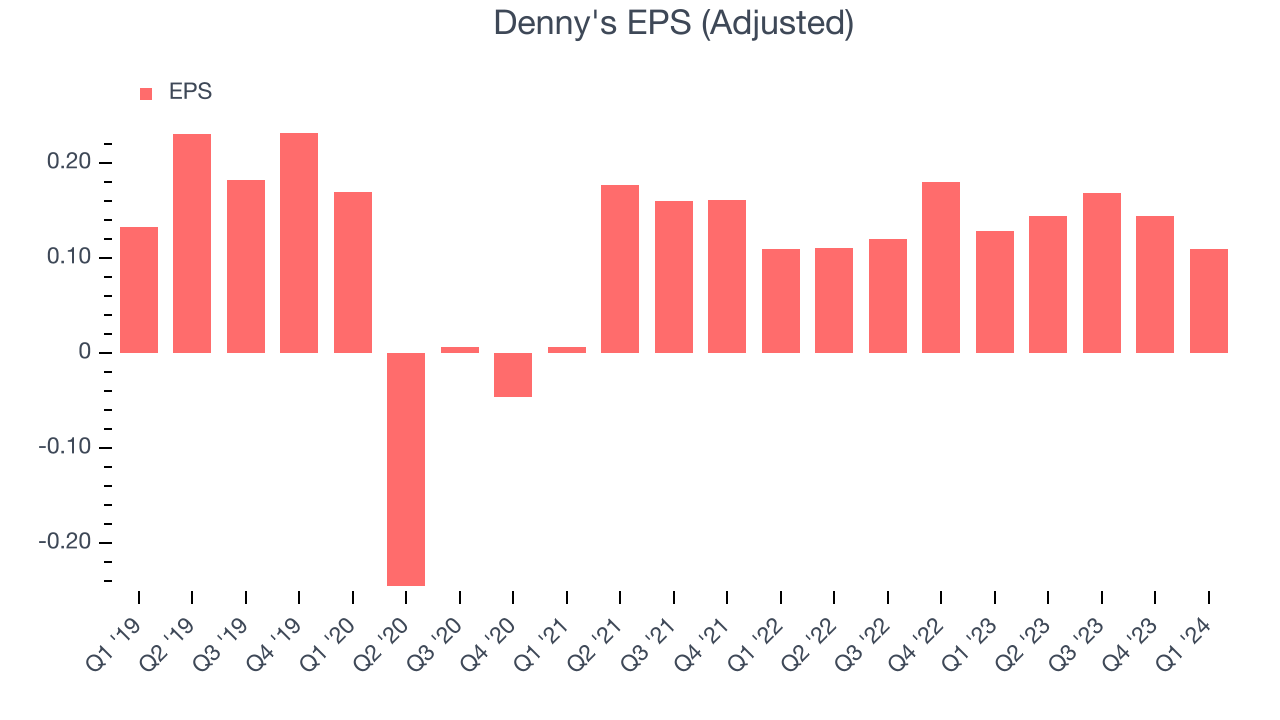
On the bright side, Wall Street expects the company's earnings to grow over the next 12 months, with analysts projecting an average 14.1% year-on-year increase in EPS.
Return on Invested Capital (ROIC)
EPS and free cash flow tell us whether a company was profitable while growing revenue. But was it capital-efficient? Enter ROIC, a metric showing how much operating profit a company generates relative to how much money the business raised (debt and equity).
Although Denny's hasn't been the highest-quality company lately because of its poor top-line performance, it historically did a wonderful job investing in profitable business initiatives. Its five-year average ROIC was 35.6%, splendid for a restaurant business.
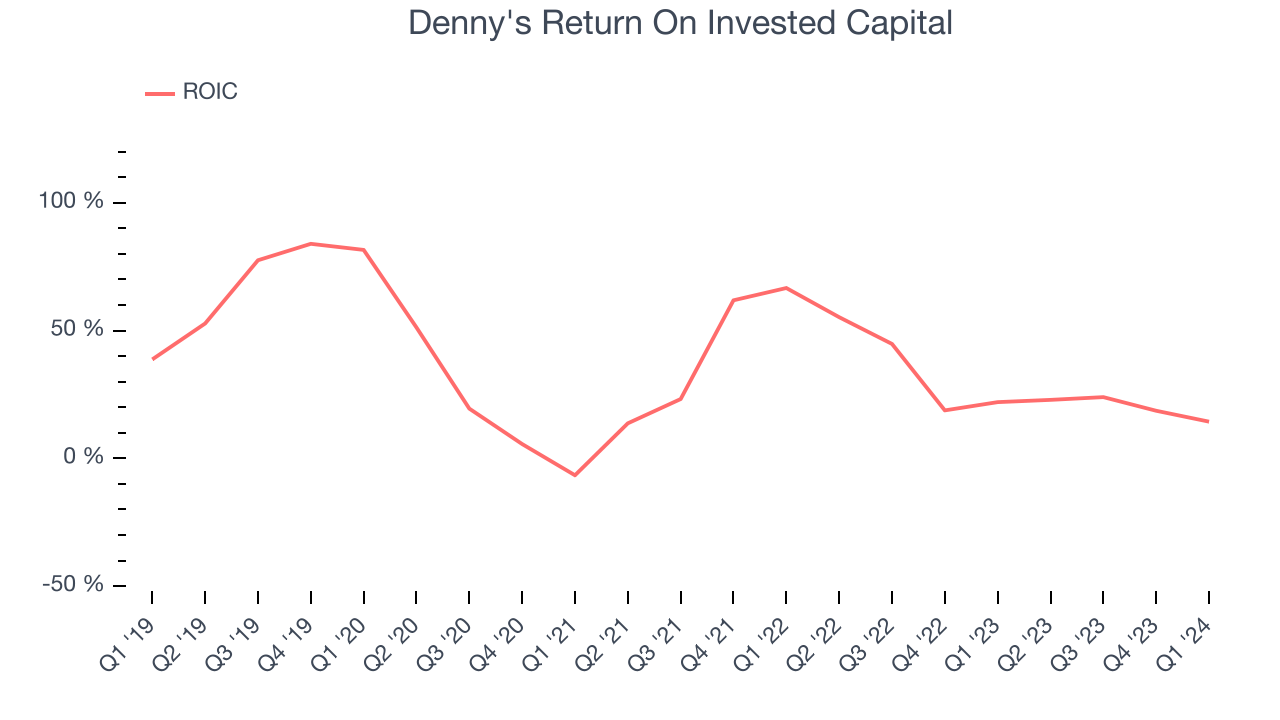
The trend in its ROIC, however, is often what surprises the market and drives the stock price. Unfortunately, Denny's ROIC significantly decreased over the last few years. We like what management has done historically but are concerned its ROIC is declining, perhaps a symptom of waning business opportunities to invest profitably.
Balance Sheet Risk
Debt is a tool that can boost company returns but presents risks if used irresponsibly.
Denny's reported $3.95 million of cash and $388.3 million of debt on its balance sheet in the most recent quarter. As investors in high-quality companies, we primarily focus on two things: 1) that a company's debt level isn't too high and 2) that its interest payments are not excessively burdening the business.
With $81.43 million of EBITDA over the last 12 months, we view Denny's 4.7x net-debt-to-EBITDA ratio as safe. We also see its $29.87 million of annual interest expenses as appropriate. The company's profits give it plenty of breathing room, allowing it to continue investing in new initiatives.
Key Takeaways from Denny's Q1 Results
The company's revenue and EPS unfortunately both missed analysts' expectations. On a brighter note, full year same store sales was maintained and full year adjusted EBITDA was raised slightly. Overall, this was a mixed quarter for Denny's. The company is down 4.9% on the results and currently trades at $7.62 per share.
Is Now The Time?
Denny's may have had a tough quarter, but investors should also consider its valuation and business qualities when assessing the investment opportunity.
We cheer for all companies serving consumers, but in the case of Denny's, we'll be cheering from the sidelines. Its revenue has declined over the last five years, but at least growth is expected to increase in the short term. And while its stellar ROIC suggests it has been a well-run company historically, the downside is its brand caters to a niche market. On top of that, its declining EPS over the last five years makes it hard to trust.
Denny's price-to-earnings ratio based on the next 12 months is 12.4x. While there are some things to like about Denny's and its valuation is reasonable, we think there are better opportunities elsewhere in the market right now.
Wall Street analysts covering the company had a one-year price target of $11.36 per share right before these results (compared to the current share price of $7.62).
To get the best start with StockStory, check out our most recent stock picks, and then sign up to our earnings alerts by adding companies to your watchlist here. We typically have the quarterly earnings results analyzed within seconds of the data being released, and especially for companies reporting pre-market, this often gives investors the chance to react to the results before the market has fully absorbed the information.