Doughnut chain Krispy Kreme (NASDAQ:DNUT) reported Q1 CY2024 results exceeding Wall Street analysts' expectations, with revenue up 5.7% year on year to $442.7 million. It made a non-GAAP profit of $0.07 per share, down from its profit of $0.09 per share in the same quarter last year.
Krispy Kreme (DNUT) Q1 CY2024 Highlights:
- Revenue: $442.7 million vs analyst estimates of $434.1 million (2% beat)
- EPS (non-GAAP): $0.07 vs analyst expectations of $0.06 (in line)
- Gross Margin (GAAP): 29.5%, up from 26.2% in the same quarter last year
- Free Cash Flow was -$46.77 million compared to -$31.31 million in the previous quarter
- Store Locations: 14,814 at quarter end, increasing by 2,404 over the last 12 months
- Market Capitalization: $2.14 billion
Famous for its Original Glazed doughnuts and parent company of Insomnia Cookies, Krispy Kreme (NASDAQ:DNUT) is one of the most beloved and well-known fast-food chains in the world.
The company was founded in 1937 by Vernon Rudolph when he rented a small building in North Carolina to sell doughnuts to local grocery stores.
Since then, Krispy Kreme has evolved into an omni-channel business and acquired Insomnia Cookies, another revered brand, in 2018. Together, these two banners work harmonically to provide fresh sweets to its customers.
Krispy Kreme and Insomnia Cookies have an unwavering commitment to freshness and quality. At Krispy Kreme, each doughnut is made with the finest ingredients, ensuring a “hot-off-the-line, melt-in-your-mouth” experience, and at Insomnia Cookies, bakers work hard to create “CookieMagic”. In addition to its core menu items, Krispy Kreme serves a range of premium beverages, while Insomnia Cookies also offers ice cream, brownies, and cakes.
When entering Krispy Kreme’s stores, customers are greeted by the unmistakable aroma of warm doughnuts wafting through the air. The warm and inviting atmosphere, often adorned with the mesmerizing sight of doughnuts being freshly glazed through a see-through glass window, creates an immersive and joyful environment for customers.
On the other hand, Insomnia Cookies leverages a digital-first concept, using its popular app to facilitate in-store pickup and delivery orders. This channel accounts for over 40% of Insomnia Cookies’ sales.
Traditional Fast Food
Traditional fast-food restaurants are renowned for their speed and convenience, boasting menus filled with familiar and budget-friendly items. Their reputations for on-the-go consumption make them favored destinations for individuals and families needing a quick meal. This class of restaurants, however, is fighting the perception that their meals are unhealthy and made with inferior ingredients, a battle that's especially relevant today given the consumers increasing focus on health and wellness.
Some competitors that sell sweet treats include private company Dunkin’ as well as public companies Dutch Bros (NYSE:BROS), McDonald’s (NYSE:MCD), Starbucks (NYSE:SBUX), and Tim Hortons (owned by Restaurant Brands, NYSE:QSR).Sales Growth
Krispy Kreme is larger than most restaurant chains and benefits from economies of scale, giving it an edge over its smaller competitors.
As you can see below, the company's annualized revenue growth rate of 14.5% over the last four years (we compare to 2019 to normalize for COVID-19 impacts) was impressive as it added more dining locations and expanded its reach.
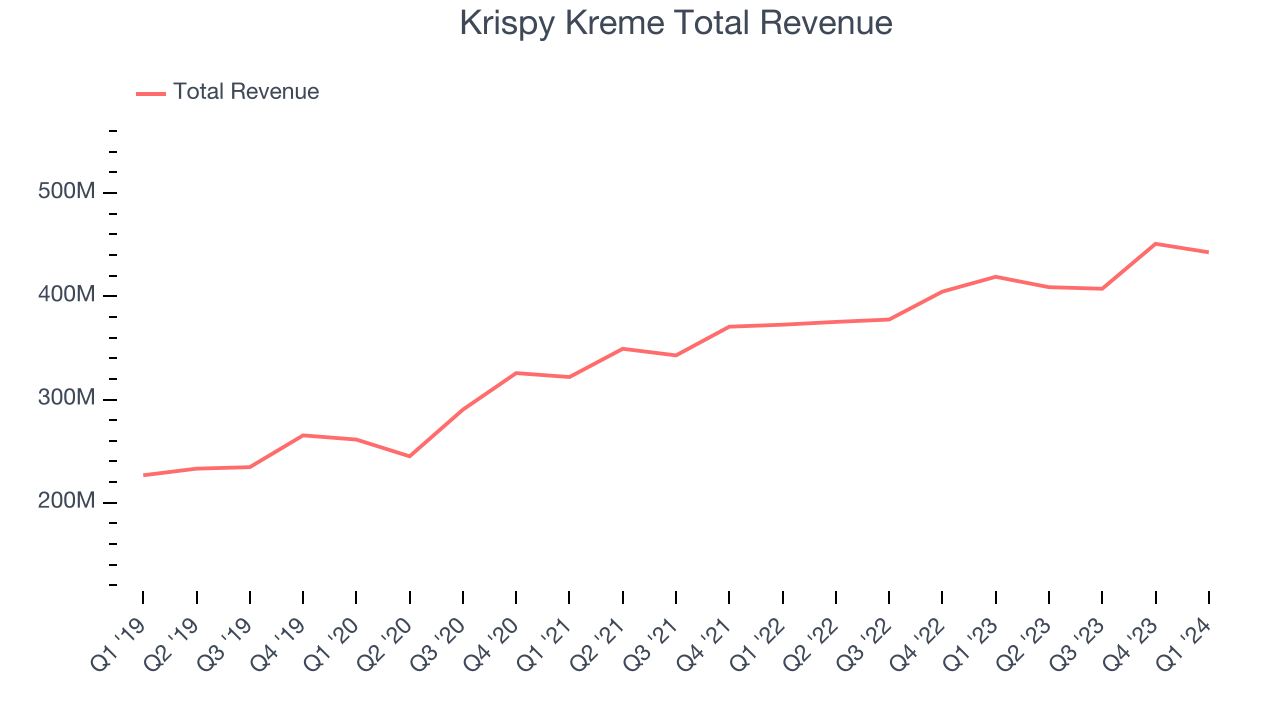
This quarter, Krispy Kreme reported solid year-on-year revenue growth of 5.7%, and its $442.7 million in revenue outperformed Wall Street's estimates by 2%. Looking ahead, Wall Street expects sales to grow 6.7% over the next 12 months, an acceleration from this quarter.
Number of Stores
The number of dining locations a restaurant chain operates is a major determinant of how much it can sell and how quickly company-level sales can grow.
When a chain like Krispy Kreme is opening new restaurants, it usually means it's investing for growth because there's healthy demand for its meals and there are markets where the concept has few or no locations. Krispy Kreme's restaurant count increased by 2,404, or 19.4%, over the last 12 months to 14,814 locations in the most recently reported quarter.
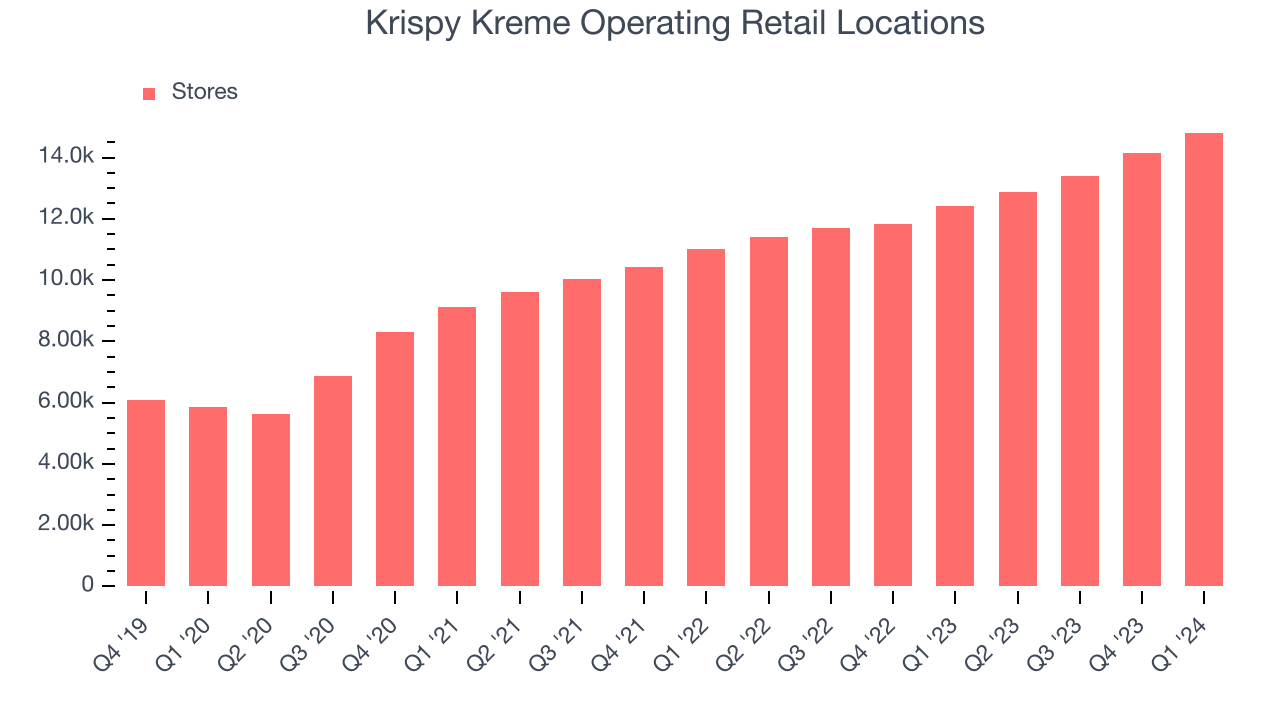
Over the last two years, Krispy Kreme has rapidly opened new restaurants, averaging 15.9% annual increases in new locations. This growth is among the fastest in the restaurant sector. Analyzing a restaurant's location growth is important because expansion means Krispy Kreme has more opportunities to feed customers and generate sales.
Gross Margin & Pricing Power
We prefer higher gross margins because they not only make it easier to generate more operating profits but also indicate pricing power and differentiation, whether it be the dining experience or quality and taste of food.
Krispy Kreme's gross profit margin came in at 29.5% this quarter. up 3.3 percentage points year on year. This means the company makes $0.28 for every $1 in revenue before accounting for its operating expenses.
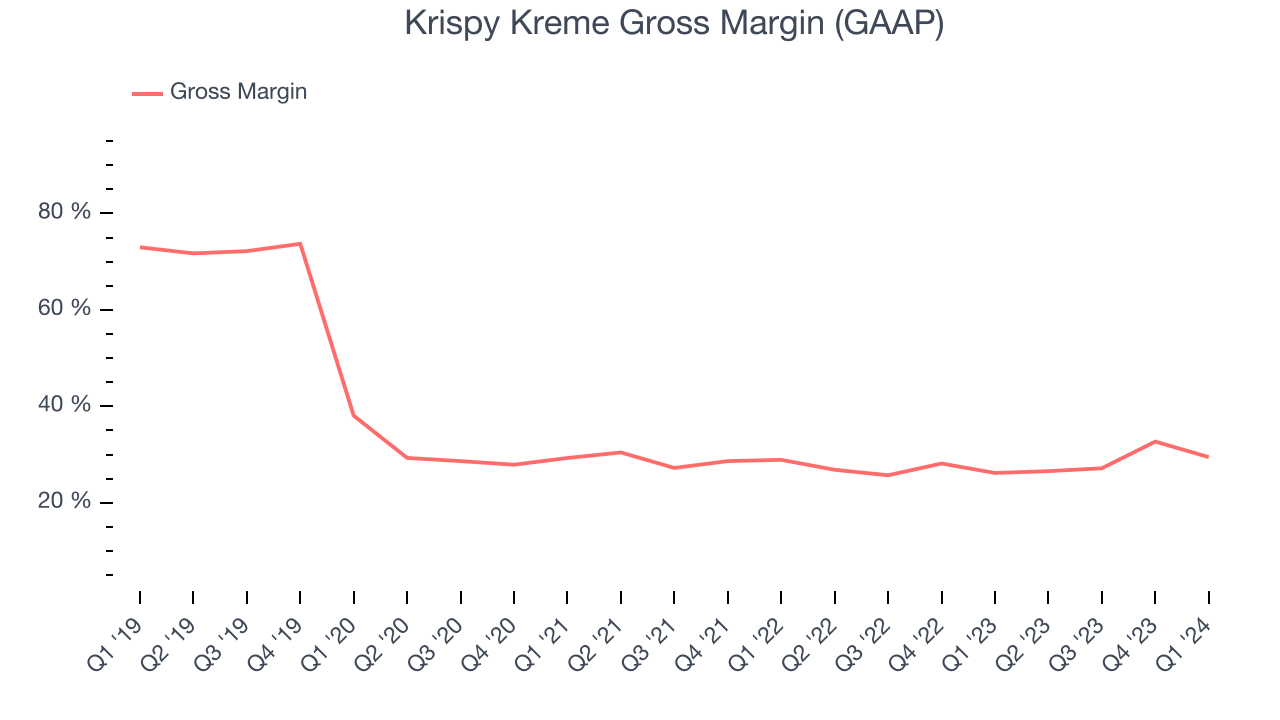
Krispy Kreme's unit economics are higher than the typical restaurant company, giving it the flexibility to invest in areas such as marketing and talent to reach more consumers. As you can see above, it's averaged a decent 28% gross margin over the last eight quarters. Its margin has also been trending up over the last 12 months, averaging 8.3% year-on-year increases each quarter. If this trend continues, it could suggest a less competitive environment where the company has better pricing power and more stable input costs (such as ingredients and transportation expenses).
Operating Margin
Operating margin is an important measure of profitability for restaurants as it accounts for all expenses keeping the lights on, including wages, rent, advertising, and other administrative costs.
This quarter, Krispy Kreme generated an operating profit margin of 2.7%, in line with the same quarter last year. This indicates the company's costs have been relatively stable.
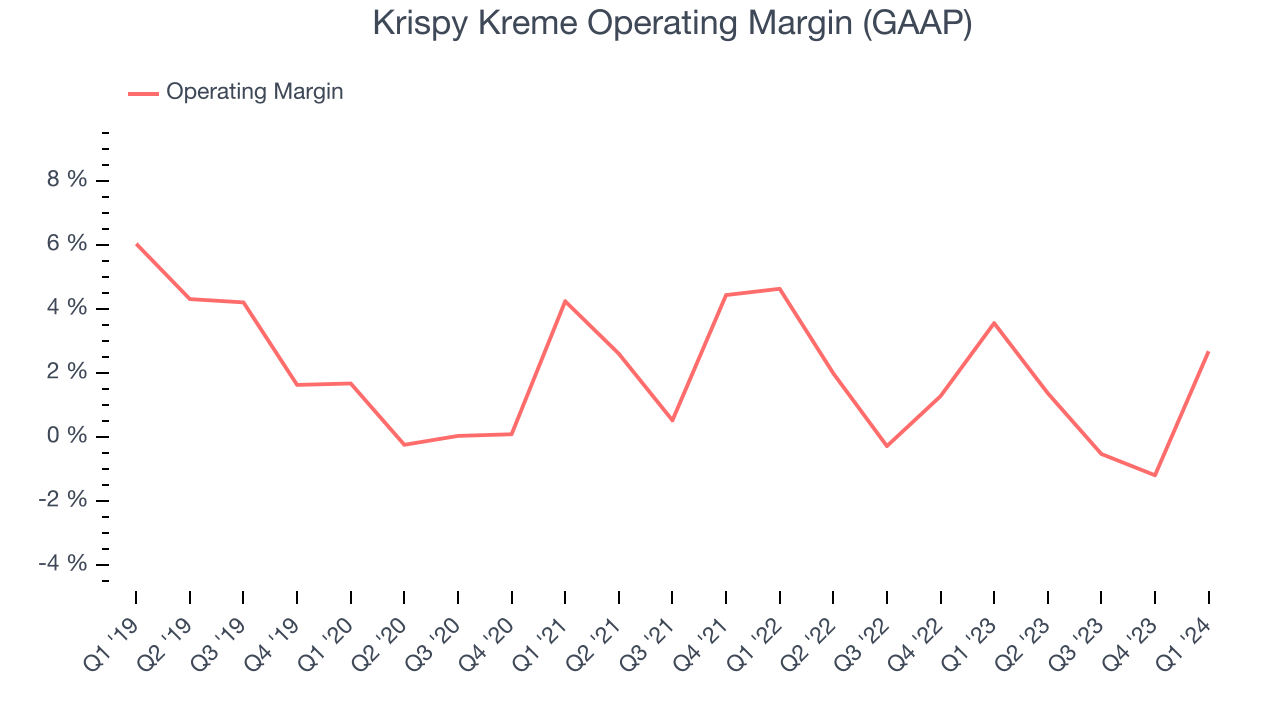 Zooming out, Krispy Kreme was profitable over the last eight quarters but held back by its large expense base. Its average operating margin of 1.1% has been among the worst in the restaurant sector. On top of that, Krispy Kreme's margin has declined, on average, by 1.1 percentage points each year. This shows the company is heading in the wrong direction, and investors are likely hoping for better results in the future.
EPS
These days, some companies issue new shares like there's no tomorrow. That's why we like to track earnings per share (EPS) because it accounts for shareholder dilution and share buybacks.
In Q1, Krispy Kreme reported EPS at $0.07, down from $0.09 in the same quarter a year ago. This print beat Wall Street's estimates by 10%.
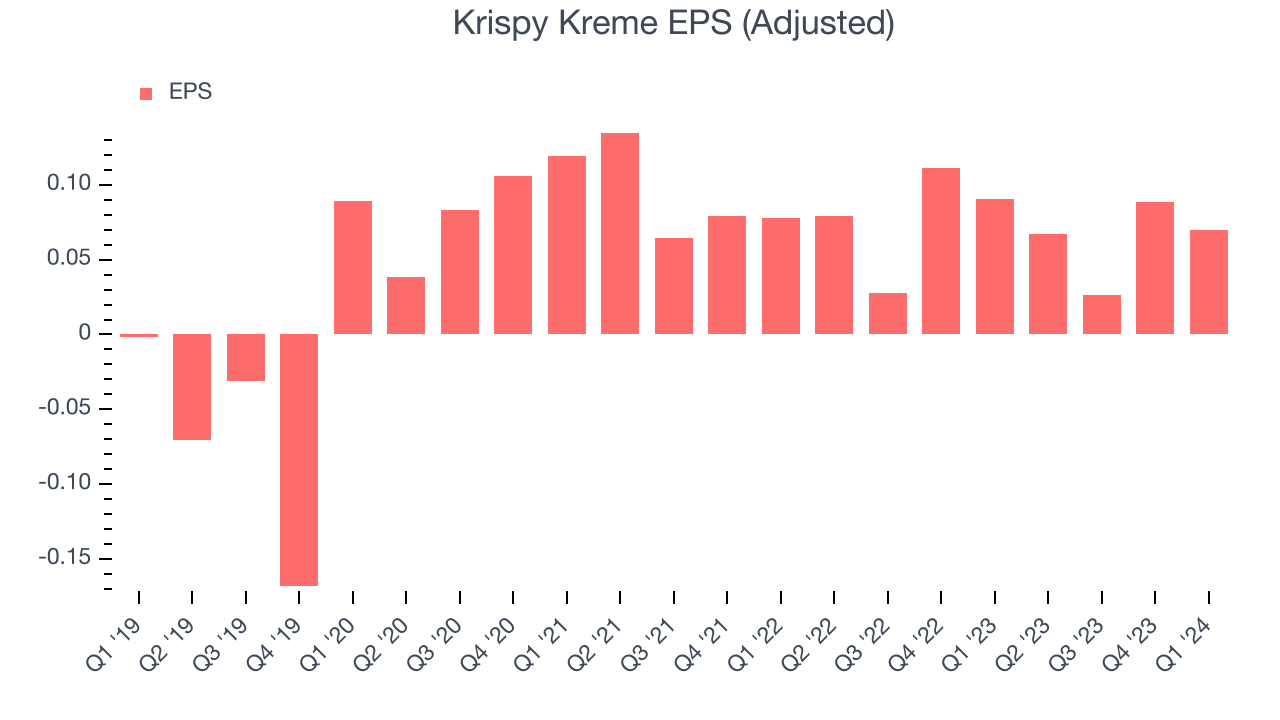
Between FY2020 and FY2024, Krispy Kreme's adjusted diluted EPS grew 239%, translating into a remarkable 35.7% compounded annual growth rate. This growth is materially higher than its revenue growth over the same period, showing that Krispy Kreme has excelled in managing its expenses.
Wall Street expects the company to continue growing earnings over the next 12 months, with analysts projecting an average 16.9% year-on-year increase in EPS.
Cash Is King
Although earnings are undoubtedly valuable for assessing company performance, we believe cash is king because you can't use accounting profits to pay the bills.
Krispy Kreme burned through $46.77 million of cash in Q1, representing a negative 10.6% free cash flow margin. The company reduced its cash burn by 189% year on year.
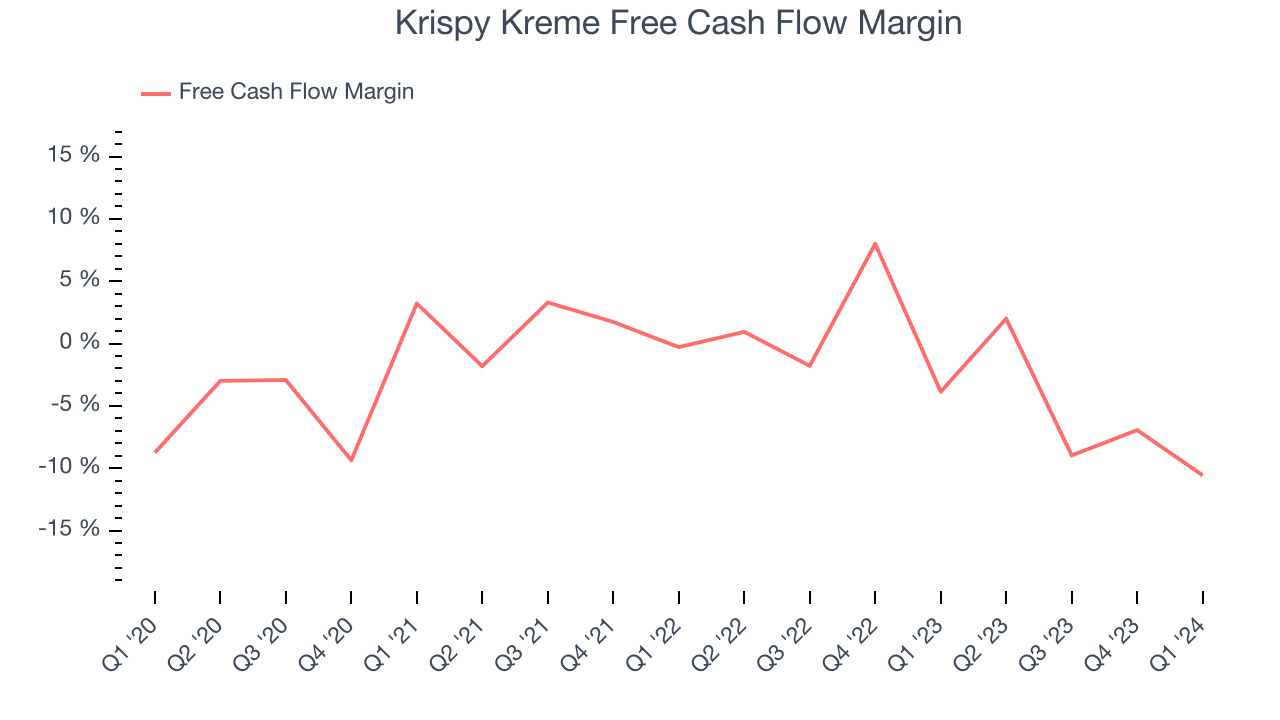
Over the last two years, Krispy Kreme's capital-intensive business model and large investments in new restaurant locations have drained company resources. Its free cash flow margin has been among the worst in the restaurant sector, averaging negative 2.8%. Furthermore, its margin has averaged year-on-year declines of 7.1 percentage points. We'll keep an eye on this as almost any movement in the wrong direction is undesirable given it's already burning cash. The company will need to improve its free cash flow conversion if it wants to survive (and ultimately thrive).
Return on Invested Capital (ROIC)
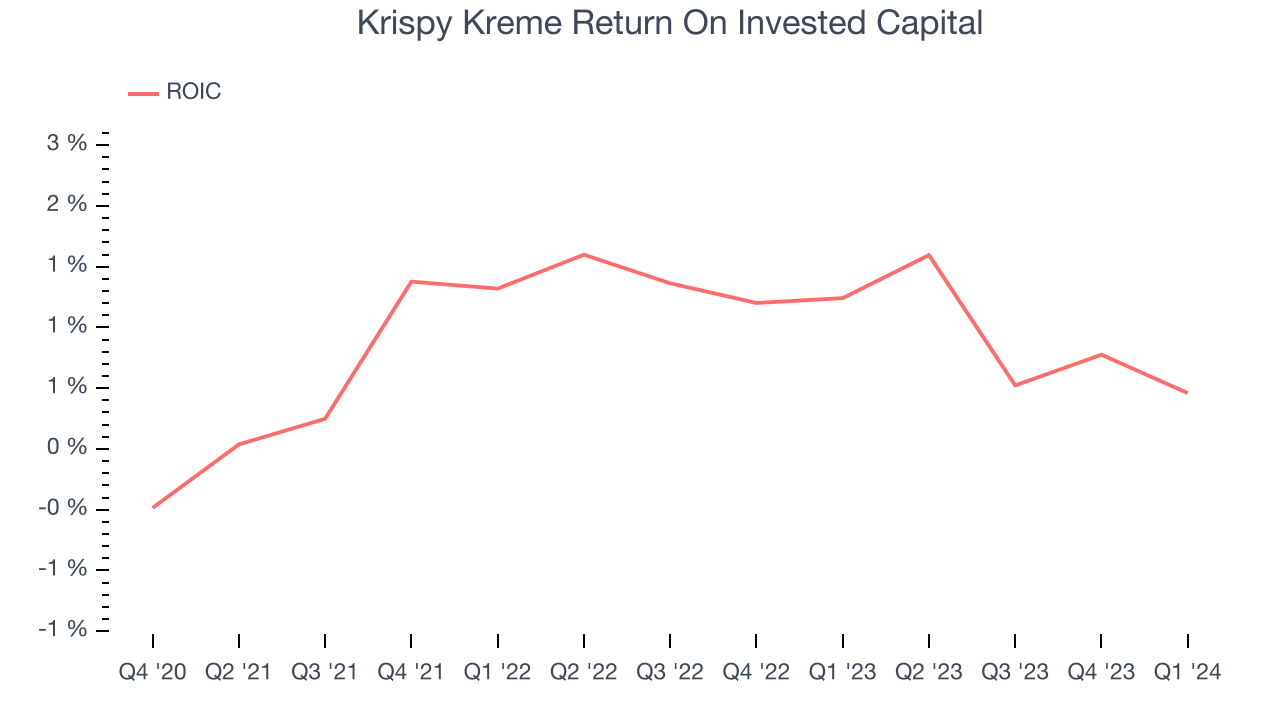
EPS and free cash flow tell us whether a company was profitable while growing revenue. But was it capital-efficient? Enter ROIC, a metric showing how much operating profit a company generates relative to how much money the business raised (debt and equity).
Krispy Kreme's five-year average ROIC was 1%, somewhat low compared to the best restaurant companies that consistently pump out 15%+. Its returns suggest it historically did a subpar job investing in profitable business initiatives.
Balance Sheet Risk
Debt is a tool that can boost company returns but presents risks if used irresponsibly.
Krispy Kreme's $1.45 billion of debt exceeds the $33.13 million of cash on its balance sheet. Furthermore, its 7x net-debt-to-EBITDA ratio (based on its EBITDA of $214.9 million over the last 12 months) shows the company is overleveraged.
At this level of debt, incremental borrowing becomes increasingly expensive and credit agencies could downgrade the company’s rating if profitability falls. Krispy Kreme could also be backed into a corner if the market turns unexpectedly – a situation we seek to avoid as investors in high-quality companies.
We hope Krispy Kreme can improve its balance sheet and remain cautious until it increases its profitability or reduces its debt.
Key Takeaways from Krispy Kreme's Q1 Results
We enjoyed seeing Krispy Kreme exceed analysts' revenue expectations this quarter. We were also glad its full-year earnings guidance exceeded Wall Street's estimates. On the other hand, its gross margin missed analysts' expectations. Zooming out, we think this was still a decent, albeit mixed, quarter, showing that the company is staying on track. The stock is up 4.4% after reporting and currently trades at $13.25 per share.
Is Now The Time?
Krispy Kreme may have had a favorable quarter, but investors should also consider its valuation and business qualities when assessing the investment opportunity.
We cheer for all companies serving consumers, but in the case of Krispy Kreme, we'll be cheering from the sidelines. Although its revenue growth has been impressive over the last four years, its relatively low ROIC suggests it has struggled to grow profits historically. And while its new restaurant openings have increased its brand equity, the downside is its cash burn raises the question of whether it can sustainably maintain growth.
Krispy Kreme's price-to-earnings ratio based on the next 12 months is 43.1x. While we've no doubt one can find things to like about Krispy Kreme, we think there are better opportunities elsewhere in the market. We don't see many reasons to get involved at the moment.
Wall Street analysts covering the company had a one-year price target of $16.95 per share right before these results (compared to the current share price of $13.25).
To get the best start with StockStory, check out our most recent stock picks, and then sign up to our earnings alerts by adding companies to your watchlist here. We typically have the quarterly earnings results analyzed within seconds of the data being released, and especially for companies reporting pre-market, this often gives investors the chance to react to the results before the market has fully absorbed the information.