
Optical retailer National Vision (NYSE:EYE) fell short of analysts' expectations in Q1 CY2024, with revenue down 3.5% year on year to $542.5 million. On the other hand, the company's outlook for the full year was close to analysts' estimates with revenue guided to $1.99 billion at the midpoint. It made a non-GAAP profit of $0.30 per share, down from its profit of $0.31 per share in the same quarter last year.
National Vision (EYE) Q1 CY2024 Highlights:
- Revenue: $542.5 million vs analyst estimates of $552.7 million (1.8% miss)
- EPS (non-GAAP): $0.30 vs analyst estimates of $0.26 (13.3% beat)
- The company reconfirmed its revenue guidance for the full year of $1.99 billion at the midpoint (in line)
- The company reconfirmed its EPS (non-GAAP) guidance for the full year of $0.58 billion at the midpoint (slightly below)
- Gross Margin (GAAP): 54.2%, down from 54.8% in the same quarter last year
- Free Cash Flow of $3.97 million, down 91.4% from the same quarter last year
- Same-Store Sales were up 1.4% year on year
- Store Locations: 1,201 at quarter end, decreasing by 156 over the last 12 months
- Market Capitalization: $1.40 billion
Operating under multiple brands, National Vision (NYSE:EYE) sells optical products such as eyeglasses and provides optical services such as eye exams.
These brands are America's Best Contacts & Eyeglasses, Eyeglass World, and Vista Optical. There are minor differences between these brands but in general, all three sell eyeglasses, contact lenses, and sunglasses as well as offering eye exams. All three brands also focus on offering affordable options for a product category that can be costly, especially for customers without vision insurance.
National Vision’s core customer base includes value-conscious consumers who want solid-quality vision products and services without breaking the bank. These customers tend to care less about luxury brands and the latest trends, instead prioritizing affordability and convenience.
The average National Vision store is around 3,000 square feet and is typically located in strip malls and shopping centers. Many are located within Walmart supercenters or large supermarket chains. National Vision benefits from the foot traffic drawn by Walmart or Fred Meyer, and those large retailers receive some economic benefits from these arrangements and can offer their own customers a true one-stop shop with services like vision and photo as well as products like gas and petrol.
Specialty Retail
Some retailers try to sell everything under the sun, while others—appropriately called Specialty Retailers—focus on selling a narrow category and aiming to be exceptional at it. Whether it’s eyeglasses, sporting goods, or beauty and cosmetics, these stores win with depth of product in their category as well as in-store expertise and guidance for shoppers who need it. E-commerce competition exists and waning retail foot traffic impacts these retailers, but the magnitude of the headwinds depends on what they sell and what extra value they provide in their stores.
Competitors offering vision products and services include EssilorLuxottica (ENXTPA:EL) and Warby Parker (NYSE:WRBY). Private companies include Zenni Optical and MyEyeDr.Sales Growth
National Vision is a small retailer, which sometimes brings disadvantages compared to larger competitors that benefit from economies of scale.
As you can see below, the company's annualized revenue growth rate of 5.8% over the last five years was weak , but to its credit, it opened new stores and expanded its reach.
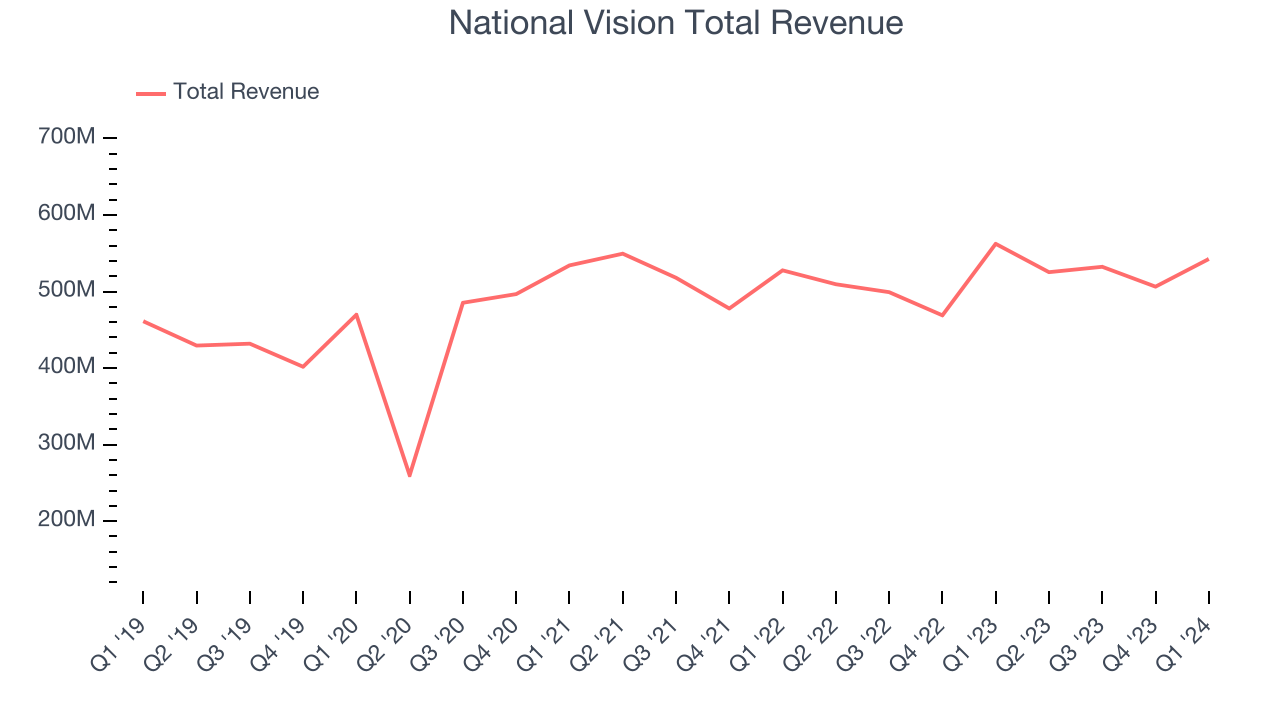
This quarter, National Vision missed Wall Street's estimates and reported a rather uninspiring 3.5% year-on-year revenue decline, generating $542.5 million in revenue. Looking ahead, Wall Street expects revenue to decline 6% over the next 12 months, a deceleration from this quarter.
Same-Store Sales
A company's same-store sales growth shows the year-on-year change in sales for its brick-and-mortar stores that have been open for at least a year, give or take, and e-commerce platform. This is a key performance indicator for retailers because it measures organic growth and demand.
National Vision's demand has been shrinking over the last eight quarters, and on average, its same-store sales have declined by 1.2% year on year. This performance is quite concerning and the company should reconsider its strategy before investing its precious capital into new store buildouts.
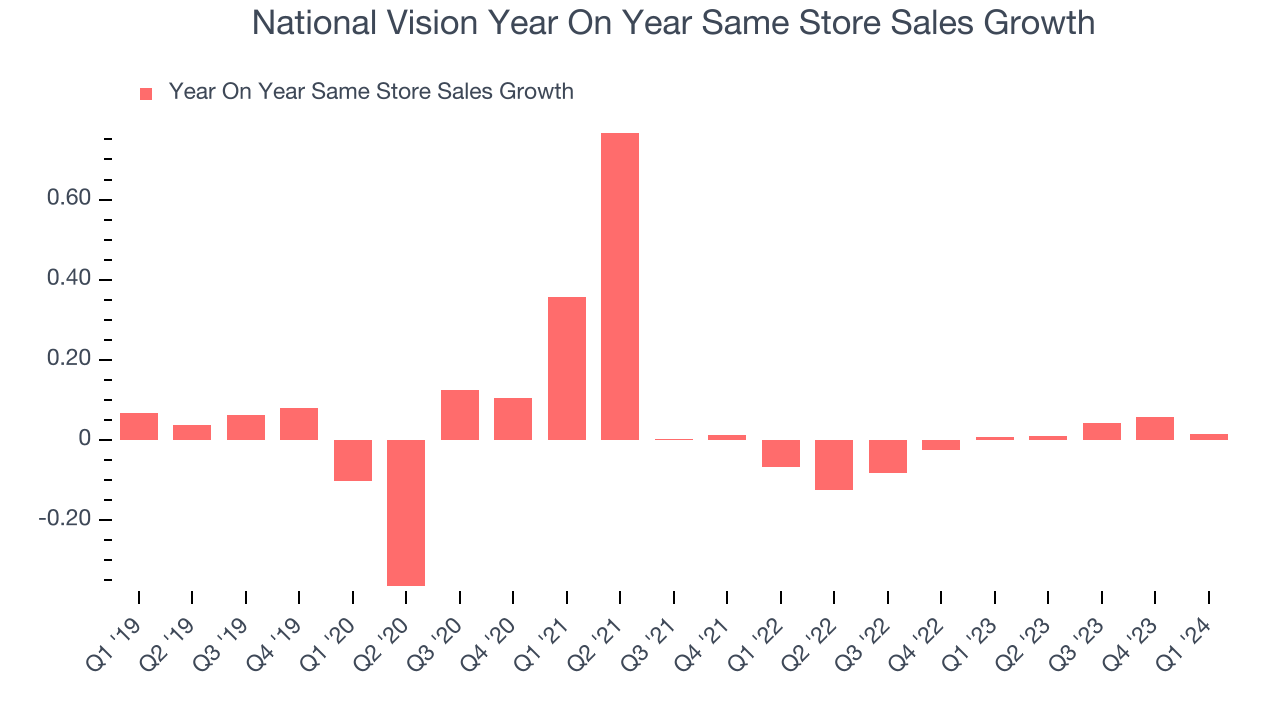
In the latest quarter, National Vision's same-store sales rose 1.4% year on year. This performance was more or less in line with the same quarter last year.
Number of Stores
A retailer's store count often determines on how much revenue it can generate.
When a retailer like National Vision is opening new stores, it usually means it's investing for growth because demand is greater than supply. National Vision's store count shrank by 156 locations, or 11.5%, over the last 12 months to 1,201 total retail locations in the most recently reported quarter.
Taking a step back, the company has generally opened new stores over the last eight quarters, averaging 3.1% annual growth in its physical footprint. This is decent store growth and in line with other retailers. With an expanding store base and demand, revenue growth can come from multiple vectors: sales from new stores, sales from e-commerce, or increased foot traffic and higher sales per customer at existing stores.
Gross Margin & Pricing Power
We prefer higher gross margins because they make it easier to generate more operating profits.
National Vision has best-in-class unit economics for a retailer, enabling it to invest in areas such as marketing and talent to stay one step ahead of the competition. As you can see below, it's averaged an exceptional 53.2% gross margin over the last two years. This means the company makes $0.53 for every $1 in revenue before accounting for its operating expenses.
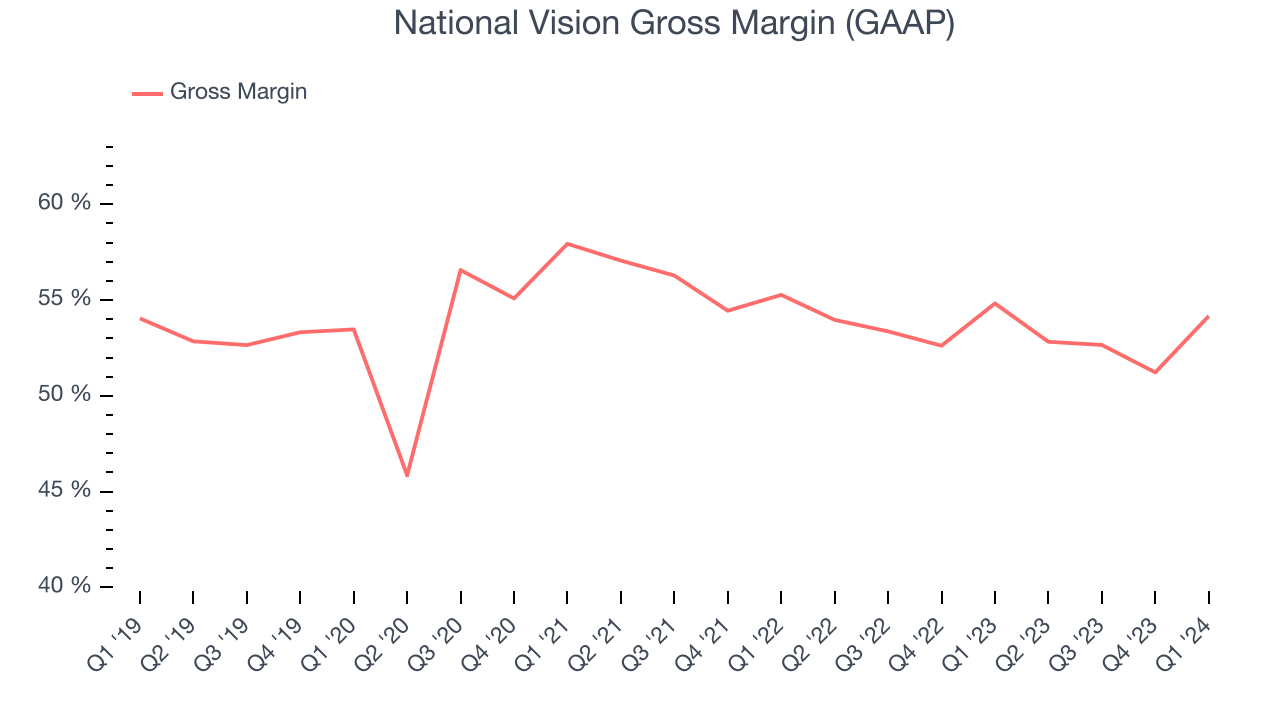
National Vision's gross profit margin came in at 54.2% this quarter, flat with the same quarter last year. This steady margin stems from its efforts to keep prices low for consumers and signals that it has stable input costs (such as freight expenses to transport goods).
Operating Margin
Operating margin is an important measure of profitability for retailers as it accounts for all expenses keeping the lights on, including wages, rent, advertising, and other administrative costs.
This quarter, National Vision generated an operating profit margin of 4.5%, down 1.4 percentage points year on year. We can infer National Vision was less efficient with its expenses or had lower leverage on its fixed costs because its operating margin decreased more than its gross margin.
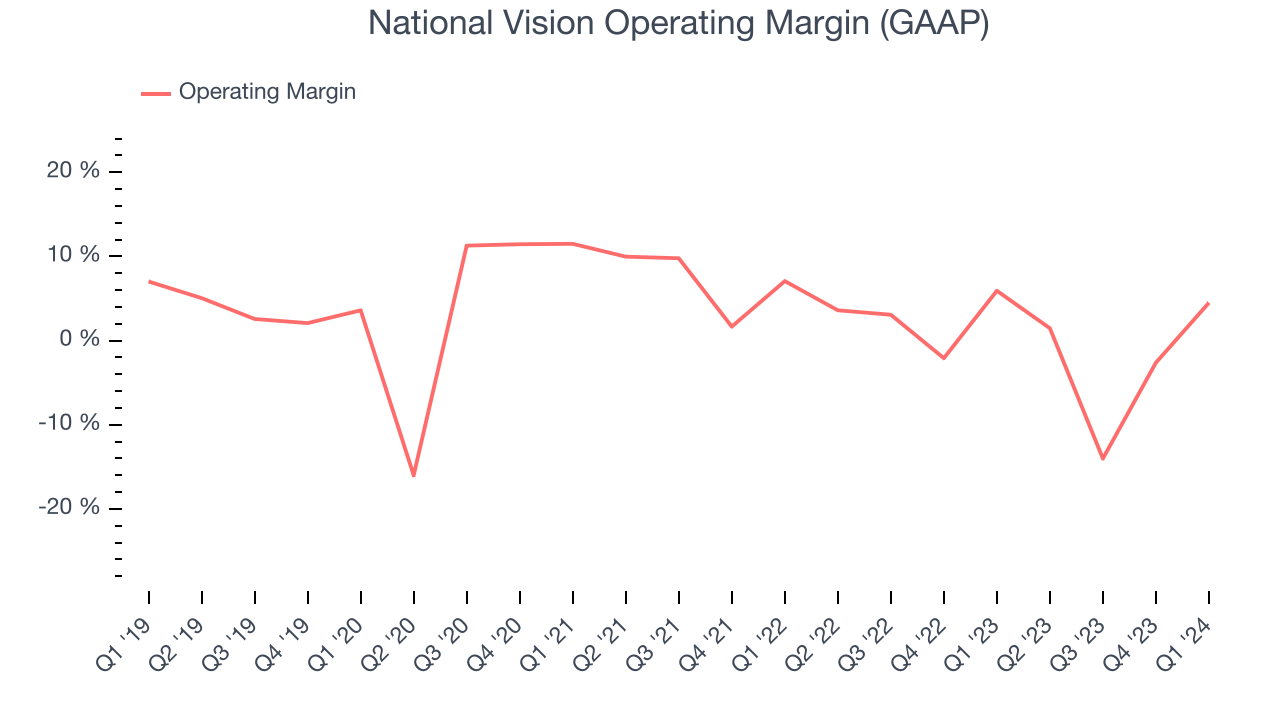 Zooming out, National Vision over the last eight quarters but held back by its large expense base. Its average operating margin of 0% has been among the worst in consumer retail. On top of that, National Vision's margin has declined, on average, by 5.5 percentage points year on year. This shows the company is heading in the wrong direction, and investors were likely hoping for better results.
EPS
These days, some companies issue new shares like there's no tomorrow. That's why we like to track earnings per share (EPS) because it accounts for shareholder dilution and share buybacks.
In Q1, National Vision reported EPS at $0.30, down from $0.31 in the same quarter a year ago. This print beat Wall Street's estimates by 13.3%.
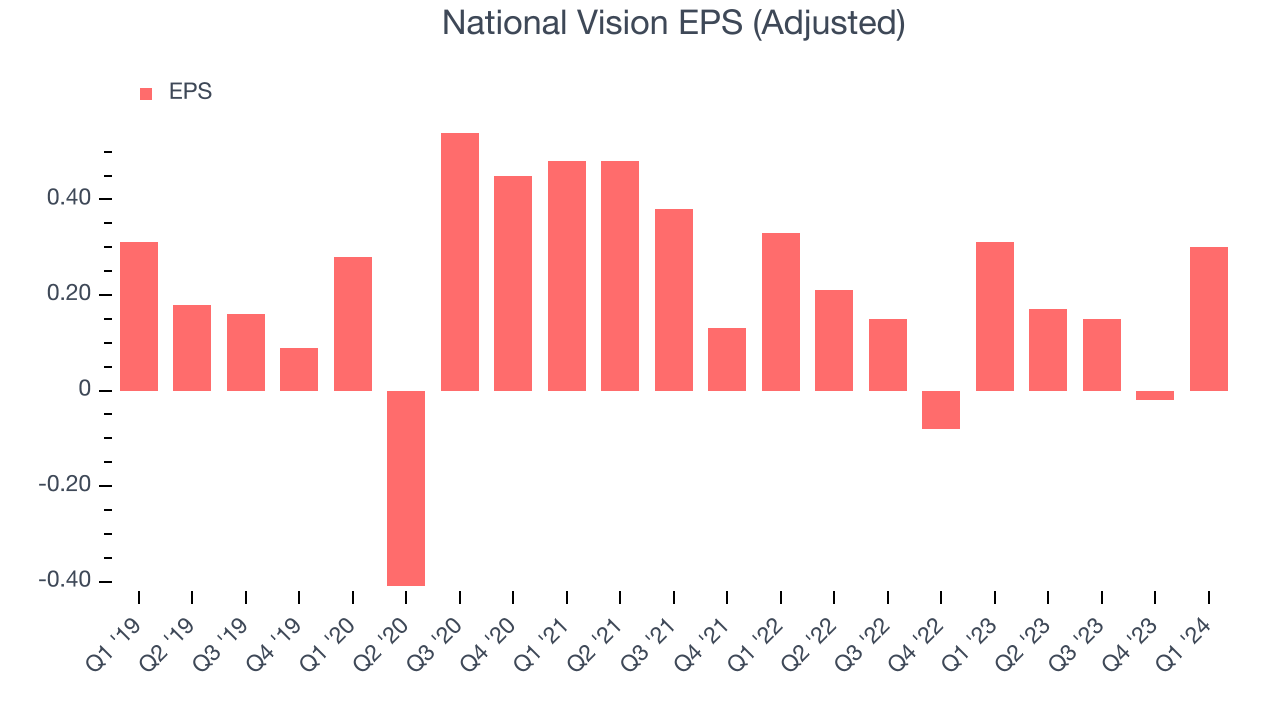
On the bright side, Wall Street expects the company's earnings to grow over the next 12 months, with analysts projecting an average 8.2% year-on-year increase in EPS.
Cash Is King
Although earnings are undoubtedly valuable for assessing company performance, we believe cash is king because you can't use accounting profits to pay the bills.
National Vision broke even from a free cash flow perspective in Q1. The company's margin regressed this quarter as it was 7.5 percentage points lower than in the same period last year.
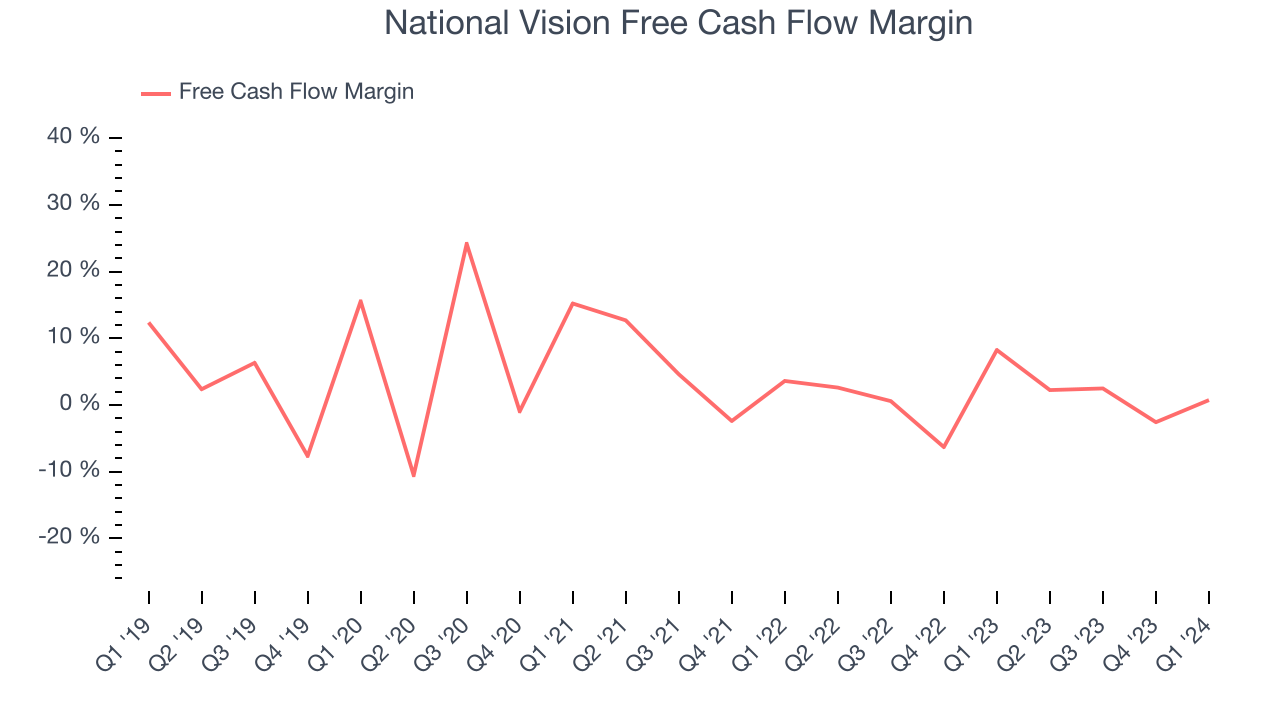
Over the last eight quarters, National Vision has shown mediocre cash profitability, putting it in a pinch as it gives the company limited opportunities to reinvest, pay down debt, or return capital to shareholders. Its free cash flow margin has averaged 1.2%, subpar for a consumer retail business. National Vision's margin has also been flat during that time, showing the company needs to take action and improve its cash profitability.
Return on Invested Capital (ROIC)
EPS and free cash flow tell us whether a company was profitable while growing revenue. But was it capital-efficient? Enter ROIC, a metric showing how much operating profit a company generates relative to how much money the business raised (debt and equity).
National Vision's five-year average ROIC was 3.8%, somewhat low compared to the best retail companies that consistently pump out 25%+. Its returns suggest it historically did a subpar job investing in profitable business initiatives.
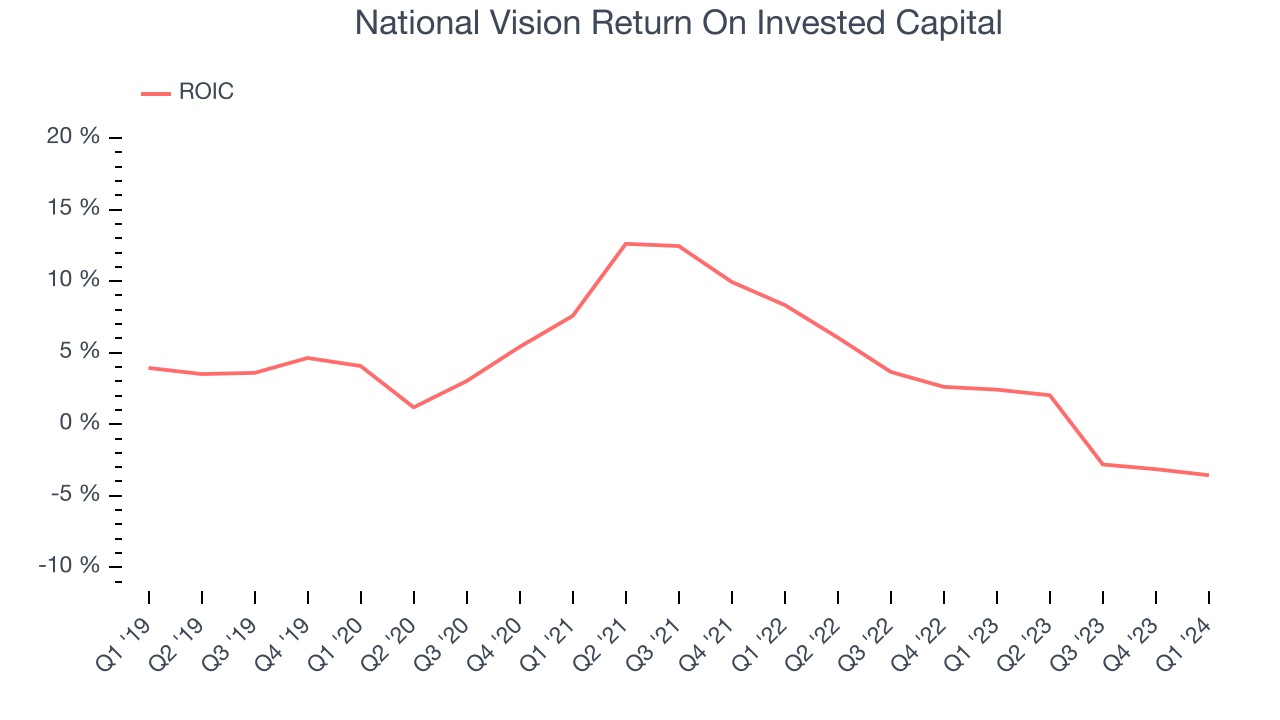
The trend in its ROIC, however, is often what surprises the market and drives the stock price. Unfortunately, National Vision's ROIC averaged 6.4 percentage point decreases over the last few years. Paired with its already low returns, these declines suggest the company's profitable business opportunities are few and far between.
Balance Sheet Risk
Debt is a tool that can boost company returns but presents risks if used irresponsibly.
National Vision reported $150.1 million of cash and $925.3 million of debt on its balance sheet in the most recent quarter. As investors in high-quality companies, we primarily focus on two things: 1) that a company's debt level isn't too high and 2) that its interest payments are not excessively burdening the business.
With $161.5 million of EBITDA over the last 12 months, we view National Vision's 4.8x net-debt-to-EBITDA ratio as safe. We also see its $2.92 million of annual interest expenses as appropriate. The company's profits give it plenty of breathing room, allowing it to continue investing in new initiatives.
Key Takeaways from National Vision's Q1 Results
It was good to see National Vision beat analysts' EPS expectations this quarter despite a revenue miss. On the other hand, its full-year earnings forecast missed analysts' expectations. Overall, the results could have been better. The company is down 1% on the results and currently trades at $17.69 per share.
Is Now The Time?
National Vision may have had a tough quarter, but investors should also consider its valuation and business qualities when assessing the investment opportunity.
We cheer for all companies serving consumers, but in the case of National Vision, we'll be cheering from the sidelines. Its revenue growth has been a little slower over the last five years, and analysts expect growth to deteriorate from here. And while its impressive gross margins are a wonderful starting point for the overall profitability of the business, the downside is its relatively low ROIC suggests it has struggled to grow profits historically. On top of that, its shrinking same-store sales suggests it'll need to change its strategy to succeed.
National Vision's price-to-earnings ratio based on the next 12 months is 27.5x. While we've no doubt one can find things to like about National Vision, we think there are better opportunities elsewhere in the market. We don't see many reasons to get involved at the moment.
Wall Street analysts covering the company had a one-year price target of $23.80 per share right before these results (compared to the current share price of $17.69).
To get the best start with StockStory, check out our most recent stock picks, and then sign up to our earnings alerts by adding companies to your watchlist here. We typically have the quarterly earnings results analyzed within seconds of the data being released, and especially for companies reporting pre-market, this often gives investors the chance to react to the results before the market has fully absorbed the information.