Athletic apparel and footwear retailer Hibbett (NASDAQ:HIBB) fell short of analysts' expectations in Q4 FY2024, with revenue up 1.8% year on year to $466.6 million. It made a GAAP profit of $2.55 per share, down from its profit of $2.92 per share in the same quarter last year.
Hibbett (HIBB) Q4 FY2024 Highlights:
- Revenue: $466.6 million vs analyst estimates of $477.5 million (2.3% miss)
- EPS: $2.55 vs analyst expectations of $2.56 (small miss)
- EPS guidance for 2025: $8.38 at the midpoint vs analyst expectations of $8.82 (5.0% miss)
- Gross Margin (GAAP): 34.5%, down from 35.2% in the same quarter last year
- Same-Store Sales were down 6.4% year on year (miss)
- Store Locations: 1,169 at quarter end, increasing by 36 over the last 12 months
- Market Capitalization: $859.7 million
With a focus on small and mid-sized markets, Hibbett (NASDAQ:HIBB) is a specialty retailer that sells athletic apparel and footwear as well as select sports equipment.
The core customer is anyone who prefers wearing athletic-inspired clothing and footwear. It could be a fitness enthusiast who needs workout clothes, a basketball team fan searching for a team sweatshirt, or a high school softball player who needs a new uniform. At a typical Hibbett store, these customers will find clothing and sneakers from brands such as Nike, Adidas, and Under Amour as well as fan gear.
What sets Hibbett apart from peers is its focus on smaller markets that may be underserved by larger retailers. The company is also known for curating its store to fit local tastes. For example, a store in a football-oriented market might carry more football-specific apparel and accessories than a store in a market that is dominated by basketball. Team apparel also reflects local pro teams.
A Hibbett store is fairly small, averaging 5,000 square feet, located in strip malls or shopping centers in small and mid-sized markets. Hibbett also sells online, having launched its e-commerce platform in 2008. Customers can either shop for Hibbett products and have them delivered to their home or shop online and pick up in store on the same-day.
Athletic Apparel and Footwear Retailer
Apparel and footwear was once a category thought to be relatively safe from major e-commerce penetration because of the need to try on, touch, and feel products, but the category is now meaningfully transacted online. Everyone still needs clothes and shoes to go outside unless they want some curious (or horrified) looks. But this ongoing digitization is forcing apparel and footwear retailers–that once only had brick-and-mortar stores–to respond with omnichannel offerings. The online shopping experience continues to improve and retail foot traffic in places like shopping malls continues to stagnate, so the evolution of clothing and shoes sellers marches on.
Retailers offering athletic apparel and footwear include Dick’s Sporting Goods (NYSE:DKS), Big 5 Sporting Goods (NASDAQ:BGFV), and private company Modell’s Sporting Goods.Sales Growth
Hibbett is a small retailer, which sometimes brings disadvantages compared to larger competitors that benefit from economies of scale.
As you can see below, the company's annualized revenue growth rate of 9.9% over the last four years (we compare to 2019 to normalize for COVID-19 impacts) was mediocre as it opened new stores and expanded its reach.
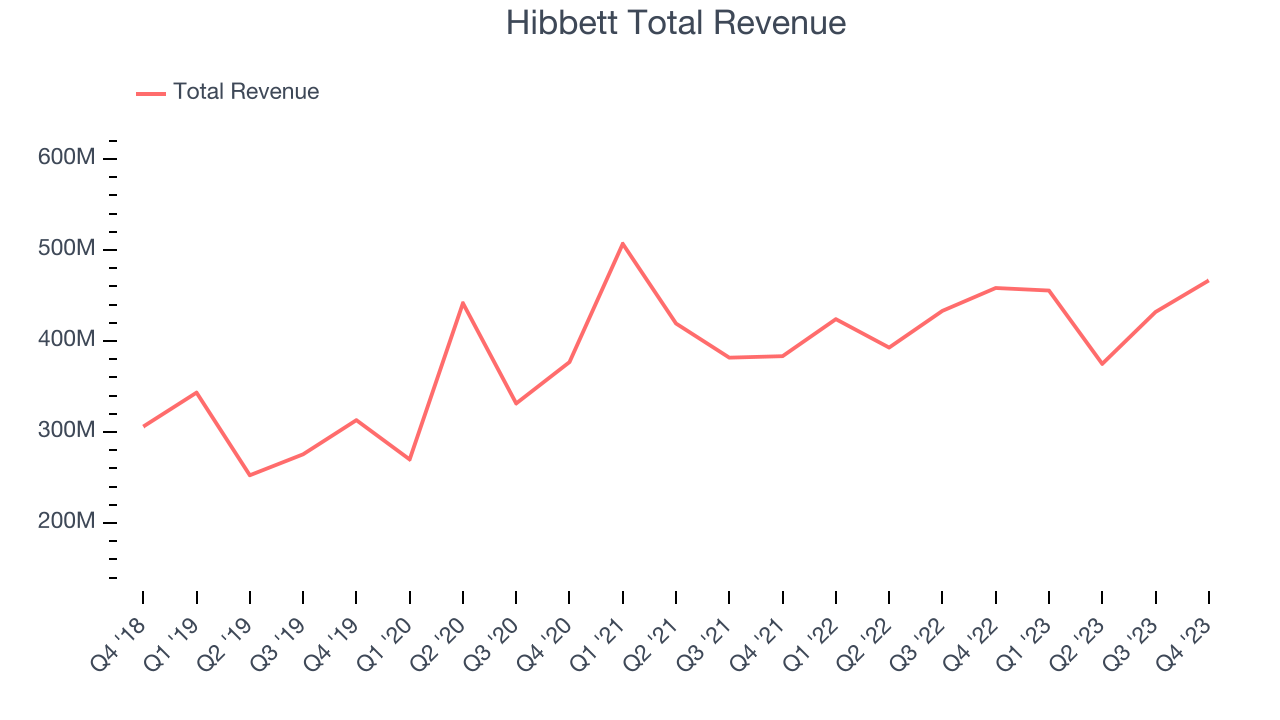
This quarter, Hibbett's revenue grew 1.8% year on year to $466.6 million, falling short of Wall Street's estimates. Looking ahead, Wall Street expects sales to grow 4.4% over the next 12 months, an acceleration from this quarter.
Number of Stores
When a retailer like Hibbett is opening new stores, it usually means it's investing for growth because demand is greater than supply. Since last year, Hibbett's store count increased by 36 locations, or 3.2%, to 1,169 total retail locations in the most recently reported quarter.
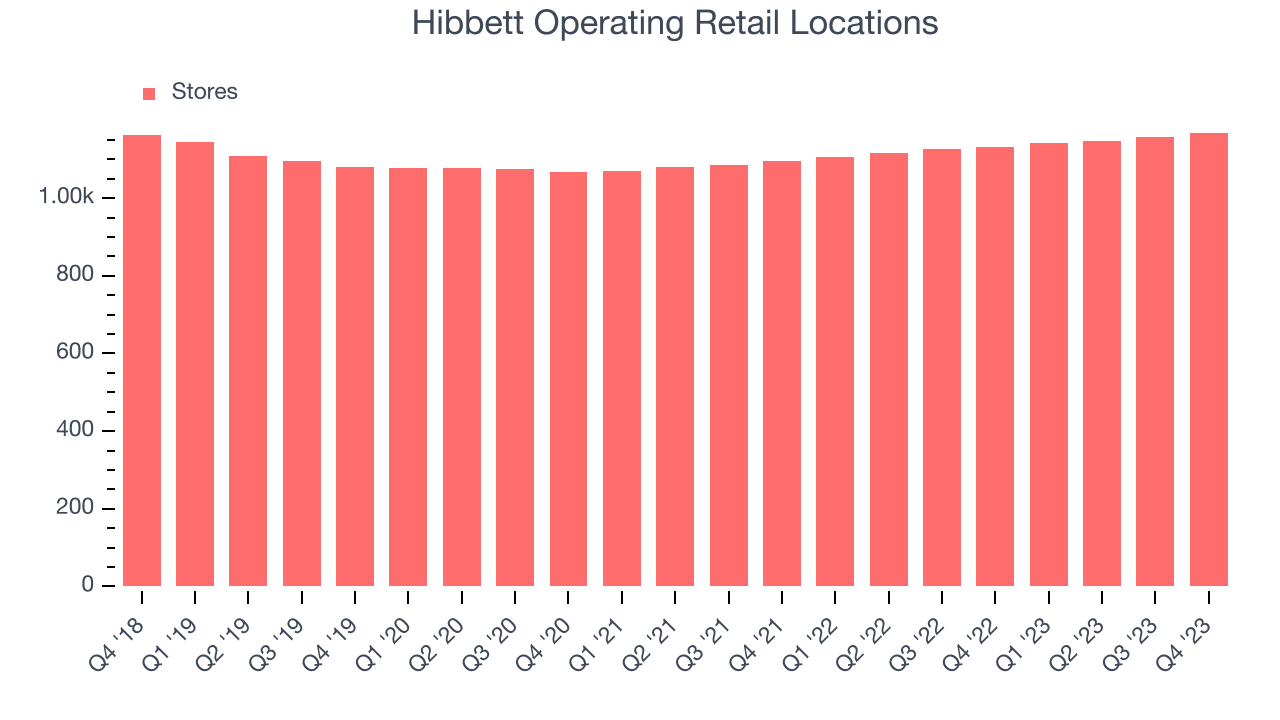
Taking a step back, the company has generally opened new stores over the last eight quarters, averaging 3.2% annual growth in its physical footprint. This is decent store growth and in line with other retailers. With an expanding store base and demand, revenue growth can come from multiple vectors: sales from new stores, sales from e-commerce, or increased foot traffic and higher sales per customer at existing stores.
Same-Store Sales
Hibbett's demand has been shrinking over the last eight quarters, and on average, its same-store sales have declined by 1.9% year on year. This performance is quite concerning and the company should reconsider its strategy before investing its precious capital into new store buildouts.
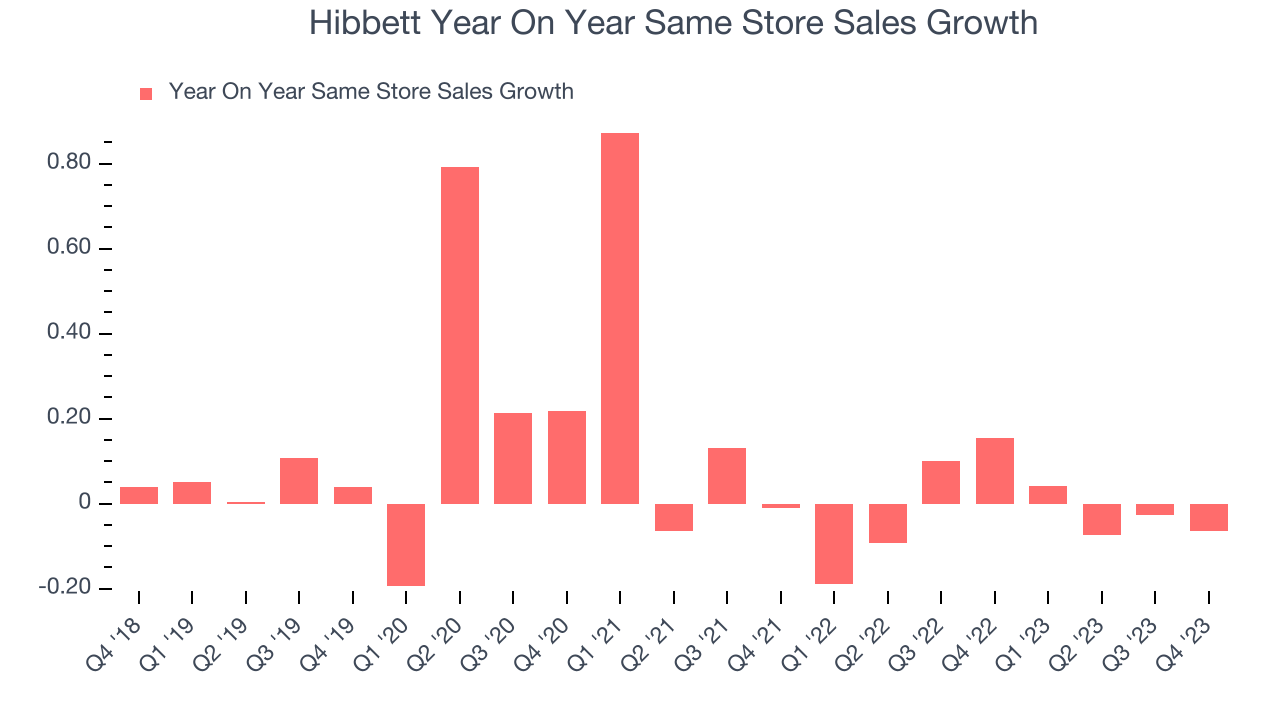
In the latest quarter, Hibbett's same-store sales fell 6.4% year on year. This decline was a reversal from the 15.5% year-on-year increase it posted 12 months ago. We'll be keeping a close eye on the company to see if this turns into a longer-term trend.
Gross Margin & Pricing Power
We prefer higher gross margins because they make it easier to generate more operating profits.
Hibbett has subpar unit economics for a retailer, making it difficult to invest in areas such as marketing and talent to grow its brand. As you can see below, it's averaged a paltry 34.5% gross margin over the last two years. This means the company makes $0.34 for every $1 in revenue before accounting for its operating expenses.
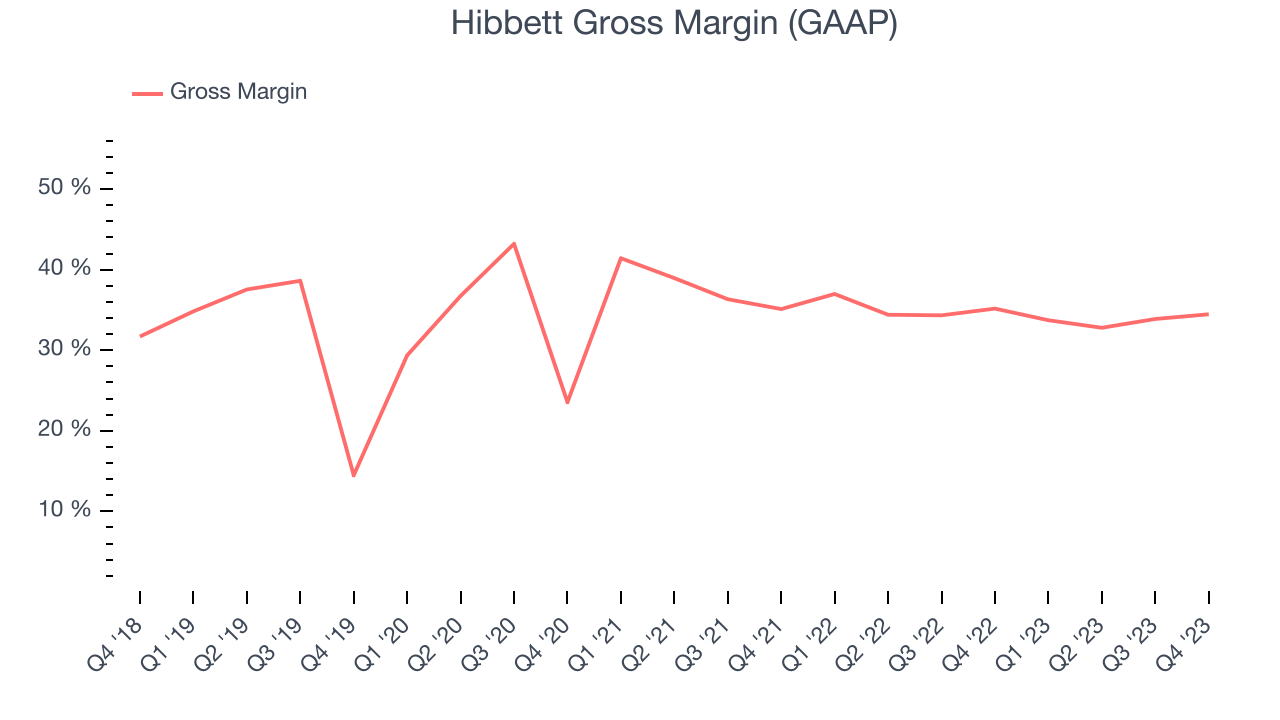
Hibbett's gross profit margin came in at 34.5% this quarter, flat with the same quarter last year. This steady margin stems from its efforts to keep prices low for consumers and signals that it has stable input costs (such as freight expenses to transport goods).
Operating Margin
Operating margin is an important measure of profitability for retailers as it accounts for all expenses keeping the lights on, including wages, rent, advertising, and other administrative costs.
In Q4, Hibbett generated an operating profit margin of 8.7%, down 2.4 percentage points year on year. We can infer Hibbett was less efficient with its expenses or had lower leverage on its fixed costs because its operating margin decreased more than its gross margin.
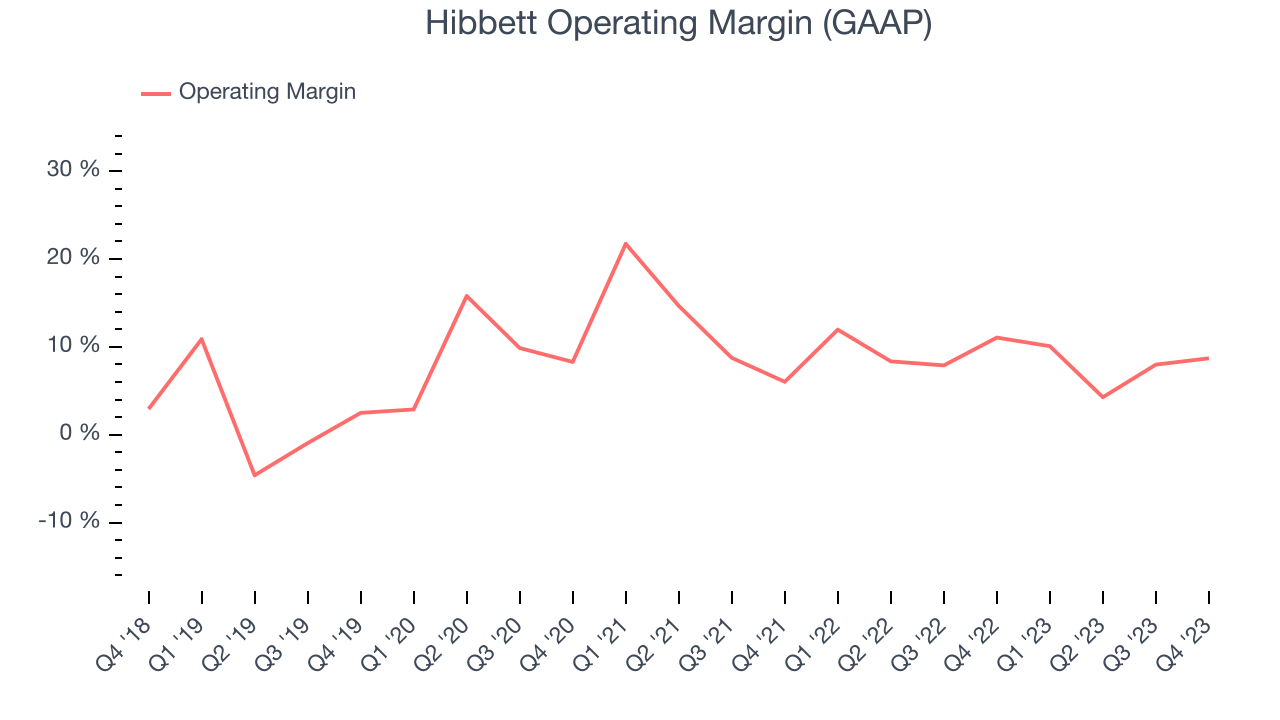 Zooming out, Hibbett has done a decent job managing its expenses over the last eight quarters. It's produced an average operating margin of 8.9%, higher than the broader consumer retail sector. However, Hibbett's margin has slightly declined by 1.9 percentage points year on year (on average). This shows the company has faced some small speed bumps along the way. The company's operating profitability was particularly impressive because of its low gross margin. This margin is mostly a factor of what Hibbett sells and takes fundamental shifts to move meaningfully. Companies have more control over their operating margins, and it signals strength if they're high when gross margins are low (like for Hibbett).
EPS
These days, some companies issue new shares like there's no tomorrow. That's why we like to track earnings per share (EPS) because it accounts for shareholder dilution and share buybacks.
In Q4, Hibbett reported EPS at $2.55, down from $2.92 in the same quarter a year ago. This print unfortunately missed Wall Street's estimates, but we care more about long-term EPS growth rather than short-term movements.
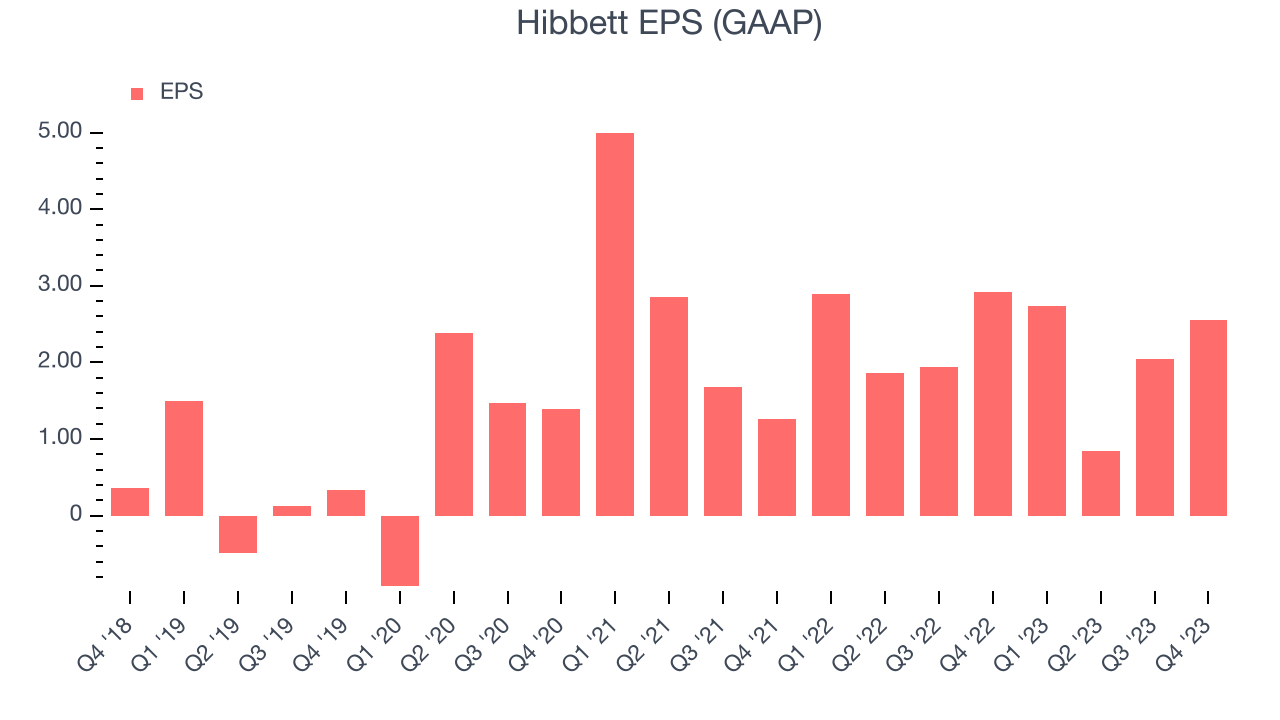
Between FY2020 and FY2024, Hibbett's adjusted diluted EPS grew 454%, translating into an astounding 53.4% compounded annual growth rate. This growth is materially higher than its revenue growth over the same period and was driven by excellent expense management (leading to higher profitability) and share repurchases (leading to higher PER share earnings).
Wall Street expects the company to continue growing earnings over the next 12 months, with analysts projecting an average 7.7% year-on-year increase in EPS.
Return on Invested Capital (ROIC)
EPS and free cash flow tell us whether a company was profitable while growing revenue. But was it capital-efficient? Enter ROIC, a metric showing how much operating profit a company generates relative to how much money the business raised (debt and equity).
Although Hibbett hasn't been the highest-quality company lately, it historically did a wonderful job investing in profitable business initiatives. Its five-year average ROIC was 32.6%, splendid for a retail business.
The trend in its ROIC, however, is often what surprises the market and drives the stock price. Unfortunately, Hibbett's ROIC over the last two years averaged 1.4 percentage point decreases each year. We like what management has done historically but are concerned its ROIC is declining, perhaps a symptom of waning business opportunities to invest profitably.
Key Takeaways from Hibbett's Q4 Results
We struggled to find many strong positives in these results. Its same store sales, revenue, and EPS all missed Wall Street's estimates. To add insult to injury, the full year EPS guidance was well below expectations. Overall, the results could have been better. The company is down 12.7% on the results and currently trades at $64 per share.
Is Now The Time?
Hibbett may have had a tough quarter, but investors should also consider its valuation and business qualities when assessing the investment opportunity.
Hibbett isn't a bad business, but it probably wouldn't be one of our picks. Its revenue growth has been mediocre over the last four years, and analysts expect growth to deteriorate from here. And while its stellar ROIC suggests it has been a well-run company historically, the downside is its shrinking same-store sales suggests it'll need to change its strategy to succeed. On top of that, its brand caters to a niche market.
Hibbett's price-to-earnings ratio based on the next 12 months is 8.4x. In the end, beauty is in the eye of the beholder. While Hibbett wouldn't be our first pick, if you like the business, the shares are trading at a pretty interesting price right now.
Wall Street analysts covering the company had a one-year price target of $73.13 per share right before these results (compared to the current share price of $64).
To get the best start with StockStory, check out our most recent stock picks, and then sign up to our earnings alerts by adding companies to your watchlist here. We typically have the quarterly earnings results analyzed within seconds of the data being released, and especially for companies reporting pre-market, this often gives investors the chance to react to the results before the market has fully absorbed the information.