Inspired (NASDAQ:INSE) Misses Q1 Sales Targets
Jabin Bastian 2024/05/10 7:05 am EDT
Gaming company Inspired (NASDAQ:INSE) fell short of analysts' expectations in Q1 CY2024, with revenue down 2.8% year on year to $63.1 million. It made a non-GAAP loss of $0.40 per share, down from its loss of $0.05 per share in the same quarter last year.
Inspired (INSE) Q1 CY2024 Highlights:
- Revenue: $63.1 million vs analyst estimates of $64.9 million (2.8% miss)
- EPS (non-GAAP): -$0.40 vs analyst estimates of -$0.06 (-$0.34 miss)
- Gross Margin (GAAP): 67.7%, down from 74.3% in the same quarter last year
- Free Cash Flow was -$800,000 compared to -$6.5 million in the previous quarter
- Market Capitalization: $250.8 million
Specializing in digital casino gaming, Inspired (NASDAQ:INSE) is a provider of gaming hardware, virtual sports platforms, and server-based gaming systems.
The company was founded to create advanced digital games with engaging user experiences and realistic graphics. Its products include physical machines like interactive gaming terminals that are placed on casino floors as well as online games.
Inspired generates revenue through the sale and leasing of gaming systems to operators along with service fees. Its customers include casino operators and online casinos.
Gaming Solutions
Gaming solution companies operate in a dynamic and evolving market, and the digital transformation of the gaming industry presents significant opportunities for innovation and growth, whether it be immersive slot machine terminals or mobile sports betting. However, the gaming solution industry is not without its challenges. Regulatory compliance is a crucial consideration as companies must navigate a complex and often fragmented regulatory landscape across different jurisdictions. Changes in regulations can impact product offerings, operational practices, and market access, requiring companies to maintain flexibility and adaptability in their business strategies. Additionally, the competitive nature of the industry necessitates continuous investment in research and development to stay ahead of competitors and meet evolving consumer demands.
Competitors in the gaming technology and entertainment sector include Everi (NYSE:EVRI), PlayAGS (NYSE:AGS), and Light & Wonder (NASDAQ:LNW).Sales Growth
Reviewing a company's long-term performance can reveal insights into its business quality. Any business can have short-term success, but a top-tier one sustains growth for years. Inspired's annualized revenue growth rate of 19.3% over the last five years was solid for a consumer discretionary business.
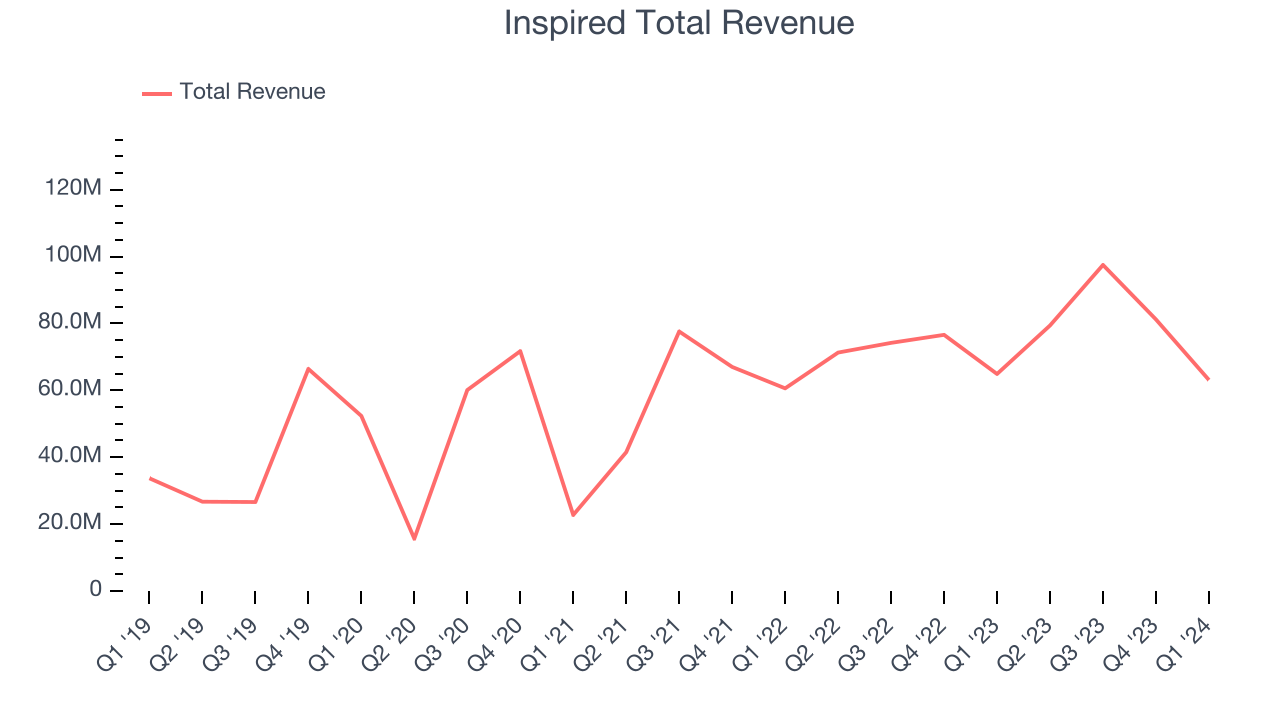
Within consumer discretionary, a long-term historical view may miss a company riding a successful new product or emerging trend. That's why we also follow short-term performance. Inspired's recent history shows its momentum has slowed as its annualized revenue growth of 14.1% over the last two years is below its five-year trend.
We can better understand the company's revenue dynamics by analyzing its three most important segments: Gaming, Leisure, and Virtual Sports, which are 38%, 29.5%, and 19.7% of revenue. Over the last two years, Inspired's revenues in all three segments increased. Gaming revenue (land-based casino games) averaged year-on-year growth of 25.5% while Leisure (digital gaming and sports betting) and Virtual Sports (gaming terminals and amusement machines) averaged 14.3% and 17.7%.
This quarter, Inspired missed Wall Street's estimates and reported a rather uninspiring 2.8% year-on-year revenue decline, generating $63.1 million of revenue. Looking ahead, Wall Street expects revenue to decline 6.6% over the next 12 months, a deceleration from this quarter.
Operating Margin
Operating margin is a key measure of profitability. Think of it as net income–the bottom line–excluding the impact of taxes and interest on debt, which are less connected to business fundamentals.
Inspired has done a decent job managing its expenses over the last eight quarters. The company has produced an average operating margin of 12.9%, higher than the broader consumer discretionary sector.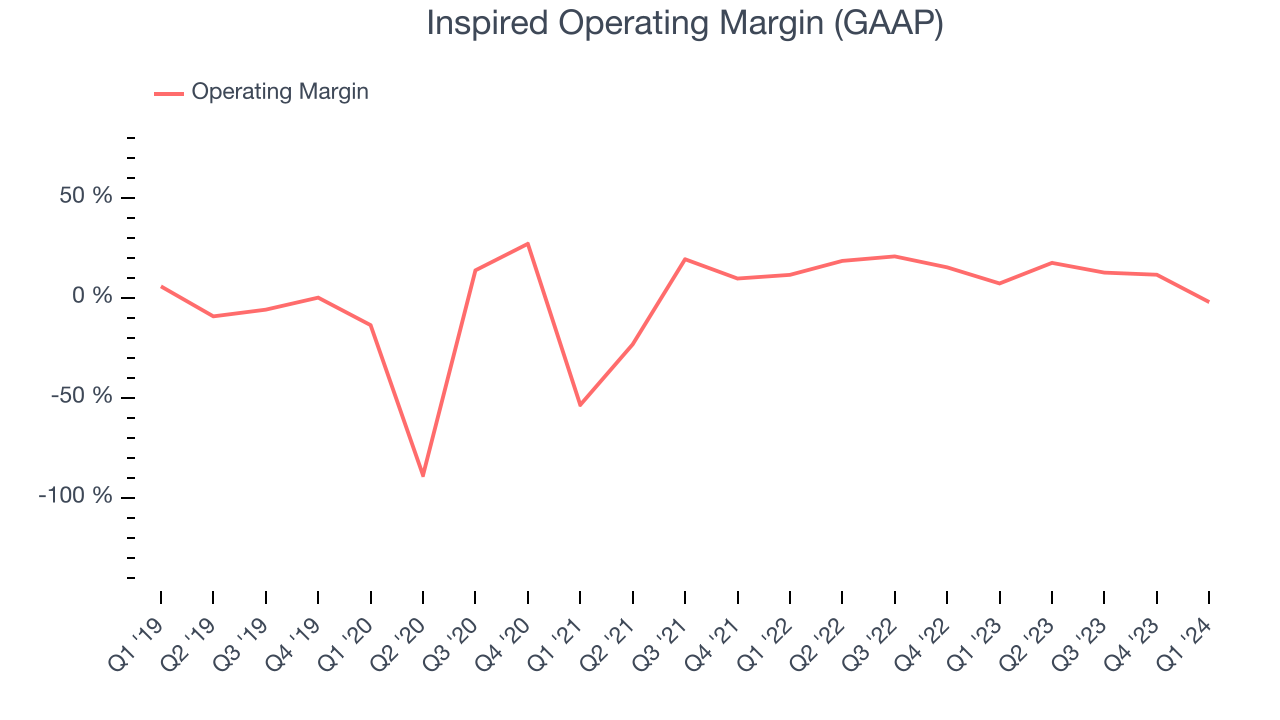
In Q1, Inspired generated an operating profit margin of negative 2.2%, down 9.3 percentage points year on year.
Over the next 12 months, Wall Street expects Inspired to become more profitable. Analysts are expecting the company’s LTM operating margin of 10.6% to rise to 18.4%.EPS
Analyzing long-term revenue trends tells us about a company's historical growth, but the long-term change in its earnings per share (EPS) points to the profitability and efficiency of that growth–for example, a company could inflate its sales through excessive spending on advertising and promotions. 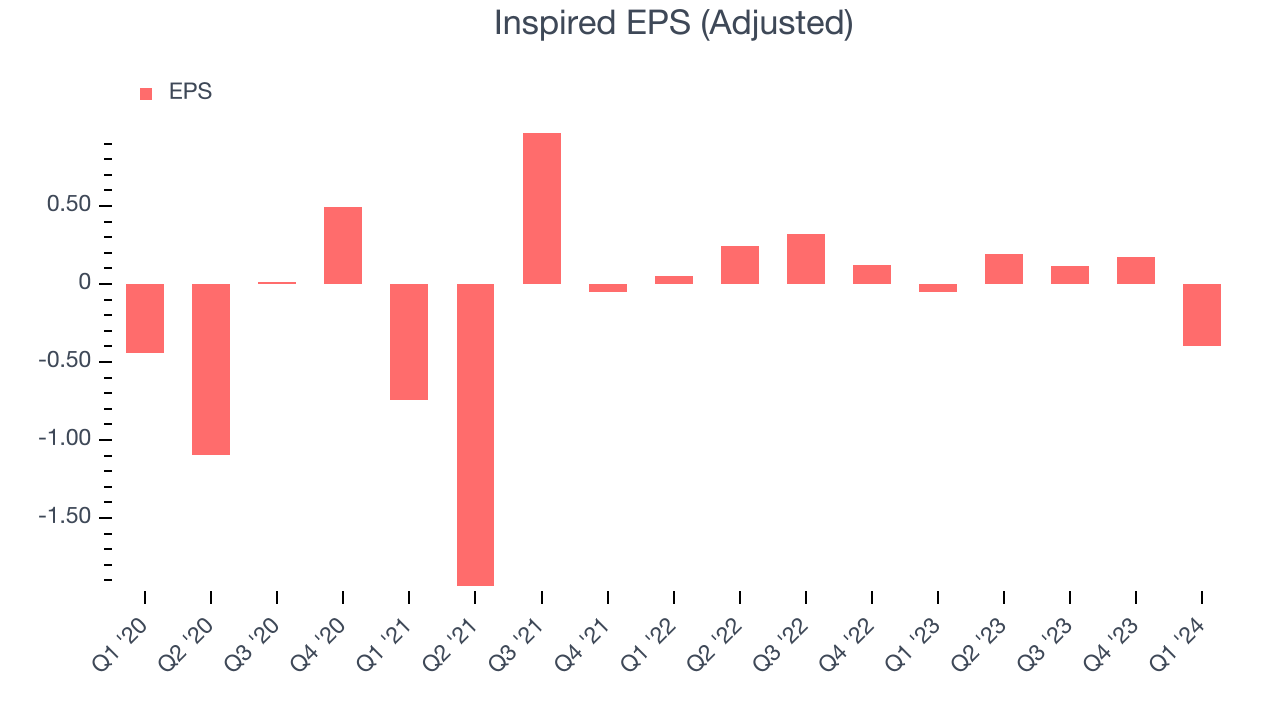
Over the last three years, Inspired cut its earnings losses and improved its EPS by 27.2% each year.
In Q1, Inspired reported EPS at negative $0.40, down from negative $0.05 in the same quarter last year. This print unfortunately missed analysts' estimates, but we care more about long-term EPS growth rather than short-term movements. We also like to analyze expected EPS growth based on Wall Street analysts' consensus projections, but unfortunately, there is insufficient data.
Cash Is King
Although earnings are undoubtedly valuable for assessing company performance, we believe cash is king because you can't use accounting profits to pay the bills.
Over the last two years, Inspired's demanding reinvestments to stay relevant with consumers have drained company resources. Its free cash flow margin has been among the worst in the consumer discretionary sector, averaging negative 1.1%.
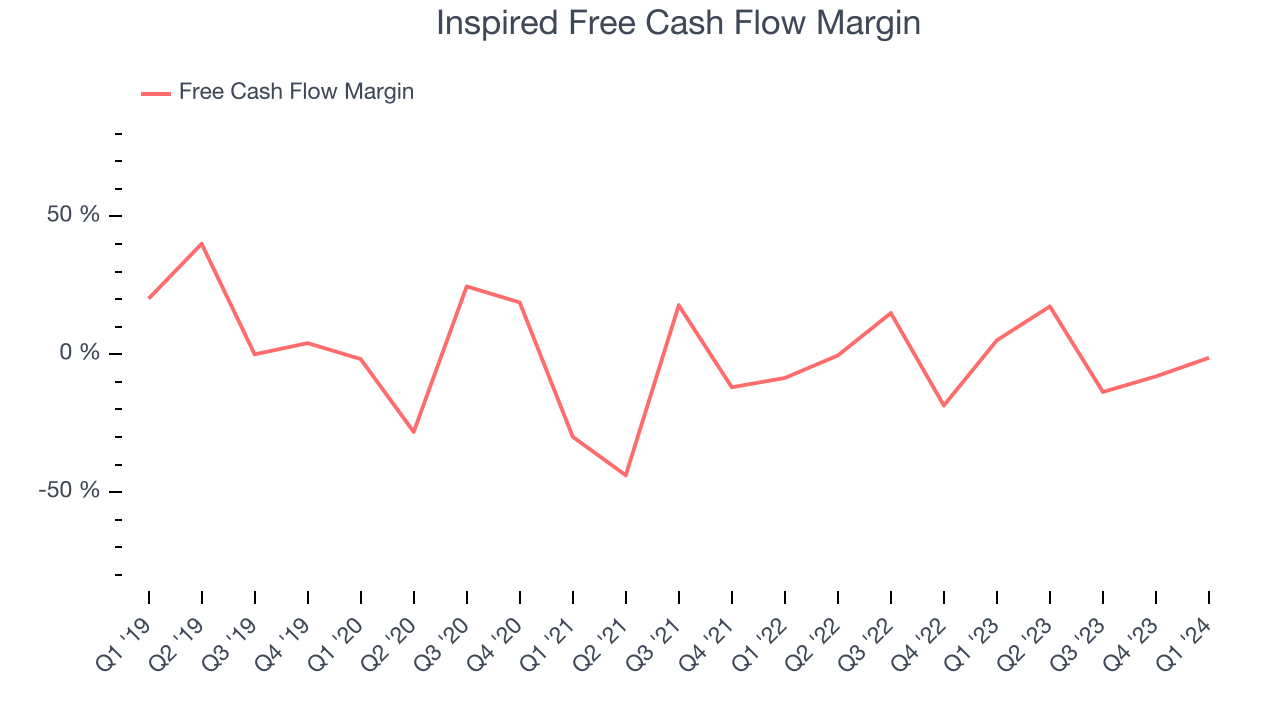
Inspired burned through $800,000 of cash in Q1, equivalent to a negative 1.3% margin. This caught our eye as the company shifted from cash flow positive in the same quarter last year to cash flow negative this quarter. Over the next year, analysts predict Inspired will reach cash profitability. Their consensus estimates imply its LTM free cash flow margin of negative 2.1% will increase to positive 16.2%.
Return on Invested Capital (ROIC)
EPS and free cash flow tell us whether a company was profitable while growing revenue. But was it capital-efficient? Enter ROIC, a metric showing how much operating profit a company generates relative to how much money the business raised (debt and equity).
Inspired's five-year average return on invested capital was 9.9%, somewhat low compared to the best consumer discretionary companies that pump out 25%+. Its returns suggest it historically did a subpar job investing in profitable business initiatives.
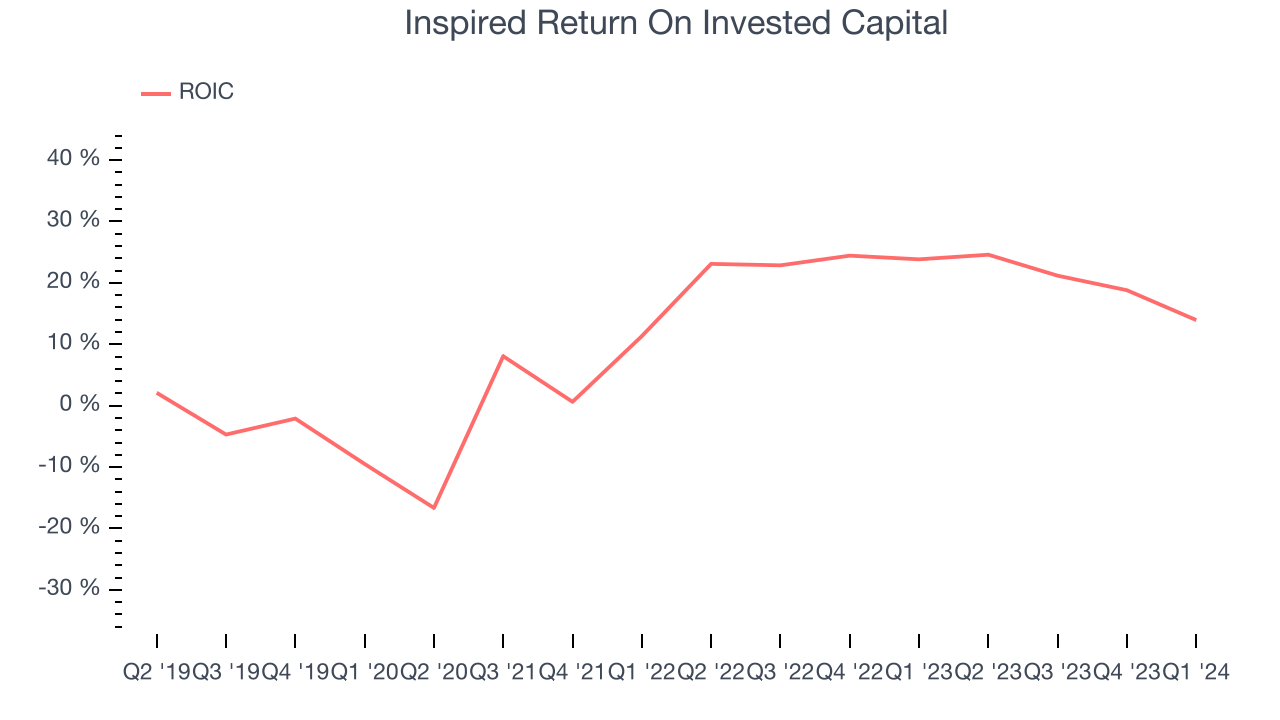
The trend in its ROIC, however, is often what surprises the market and drives the stock price. Over the last few years, Inspired's ROIC has significantly increased. This is a good sign, and if the company's returns keep rising, there's a chance it could evolve into an investable business.
Balance Sheet Risk
Debt is a tool that can boost company returns but presents risks if used irresponsibly.
Inspired reported $35.3 million of cash and $317.3 million of debt on its balance sheet in the most recent quarter. As investors in high-quality companies, we primarily focus on two things: 1) that a company's debt level isn't too high and 2) that its interest payments are not excessively burdening the business.
With $96.7 million of EBITDA over the last 12 months, we view Inspired's 2.9x net-debt-to-EBITDA ratio as safe. We also see its $28 million of annual interest expenses as appropriate. The company's profits give it plenty of breathing room, allowing it to continue investing in new initiatives.
Key Takeaways from Inspired's Q1 Results
We struggled to find many strong positives in these results. Its revenue, operating margin, and EPS fell short of Wall Street's estimates. Overall, this was a bad quarter for Inspired. The stock is up flat after reporting and currently trades at $9.44 per share.
Is Now The Time?
Inspired may have had a tough quarter, but investors should also consider its valuation and business qualities when assessing the investment opportunity.
Inspired isn't a bad business, but it probably wouldn't be one of our picks. Although its revenue growth has been good over the last five years, its cash burn raises the question of whether it can sustainably maintain growth. And while its projected EPS for the next year implies the company's fundamentals will improve, the downside is its relatively low ROIC suggests it has historically struggled to find compelling business opportunities.
In the end, beauty is in the eye of the beholder. While Inspired wouldn't be our first pick, if you like the business, the shares are trading at a pretty interesting price right now.
Wall Street analysts covering the company had a one-year price target of $14.75 per share right before these results (compared to the current share price of $9.44).
To get the best start with StockStory, check out our most recent stock picks, and then sign up for our earnings alerts by adding companies to your watchlist here. We typically have the quarterly earnings results analyzed within seconds of the data being released, and especially for companies reporting pre-market, this often gives investors the chance to react to the results before the market has fully absorbed the information.