
Fast-food chain Jack in the Box (NASDAQ:JACK) fell short of analysts' expectations in Q1 CY2024, with revenue down 7.7% year on year to $365.3 million. It made a non-GAAP profit of $1.46 per share, improving from its profit of $1.27 per share in the same quarter last year.
Jack in the Box (JACK) Q1 CY2024 Highlights:
- Revenue: $365.3 million vs analyst estimates of $369.7 million (1.2% miss)
- Adjusted EBITDA: $75.7 million vs analyst estimates of $74.4 million (1.7% beat)
- EPS (non-GAAP): $1.46 vs analyst estimates of $1.43 (2.3% beat)
- Full year guidance lowered across the board for adjusted same-store sales, EBITDA, EPS
- Gross Margin (GAAP): 30.8%, up from 29.4% in the same quarter last year
- Free Cash Flow was -$67.09 million compared to -$61.5 million in the previous quarter
- Same-Store Sales were down 2.5% year on year Miss)
- Store Locations: 2,195 at quarter end, decreasing by 587 over the last 12 months
- Market Capitalization: $1.04 billion
Delighting customers since its inception in 1951, Jack in the Box (NASDAQ:JACK) is a distinctive fast-food chain known for its bold flavors, innovative menu items, and quirky marketing.
The company was founded by Robert Peterson, who previously ran a chain of drive-in diners called “Topsy’s”. Seeking to improve its operations, Robert experimented by installing two-way intercom devices into its parking lots so that cars could communicate more efficiently with staff. These test locations were named “Jack in the Box”, and the modern-day “drive-thru” concept was born.
Jack in the Box offers a diverse selection of burgers, sandwiches, tacos, and much more, providing an exciting dining experience for guests of all ages. The company's commitment to culinary creativity is evident in its ever-evolving menu, which showcases a mix of classic favorites such as the Jumbo Jack and inventive new offerings like the Munchie Meal, which at one point was only available between the hours of 9pm and 5am.
Beyond its eclectic menu, Jack in the Box is known for its playful and humorous marketing campaigns featuring the iconic Jack Box character. This witty and often irreverent mascot adds a unique touch to the brand.
Like most fast-food chains, customers can enjoy their meals via a convenient drive-thru (which Jack in the Box pioneered) or comfy indoor seating.
Traditional Fast Food
Traditional fast-food restaurants are renowned for their speed and convenience, boasting menus filled with familiar and budget-friendly items. Their reputations for on-the-go consumption make them favored destinations for individuals and families needing a quick meal. This class of restaurants, however, is fighting the perception that their meals are unhealthy and made with inferior ingredients, a battle that's especially relevant today given the consumers increasing focus on health and wellness.
Fast-food competitors include Burger King and Popeyes (owned by Restaurant Brands, NYSE:QSR), McDonald’s (NYSE:MCD), Wendy’s (NASDAQ:WEN), and Taco Bell and KFC (owned by Yum! Brands, NYSE:YUM).Sales Growth
Jack in the Box is larger than most restaurant chains and benefits from economies of scale, giving it an edge over its smaller competitors.
As you can see below, the company's annualized revenue growth rate of 13.2% over the last five years was impressive despite closing restaurants, suggesting that growth was driven by increased sales at existing, established dining locations.
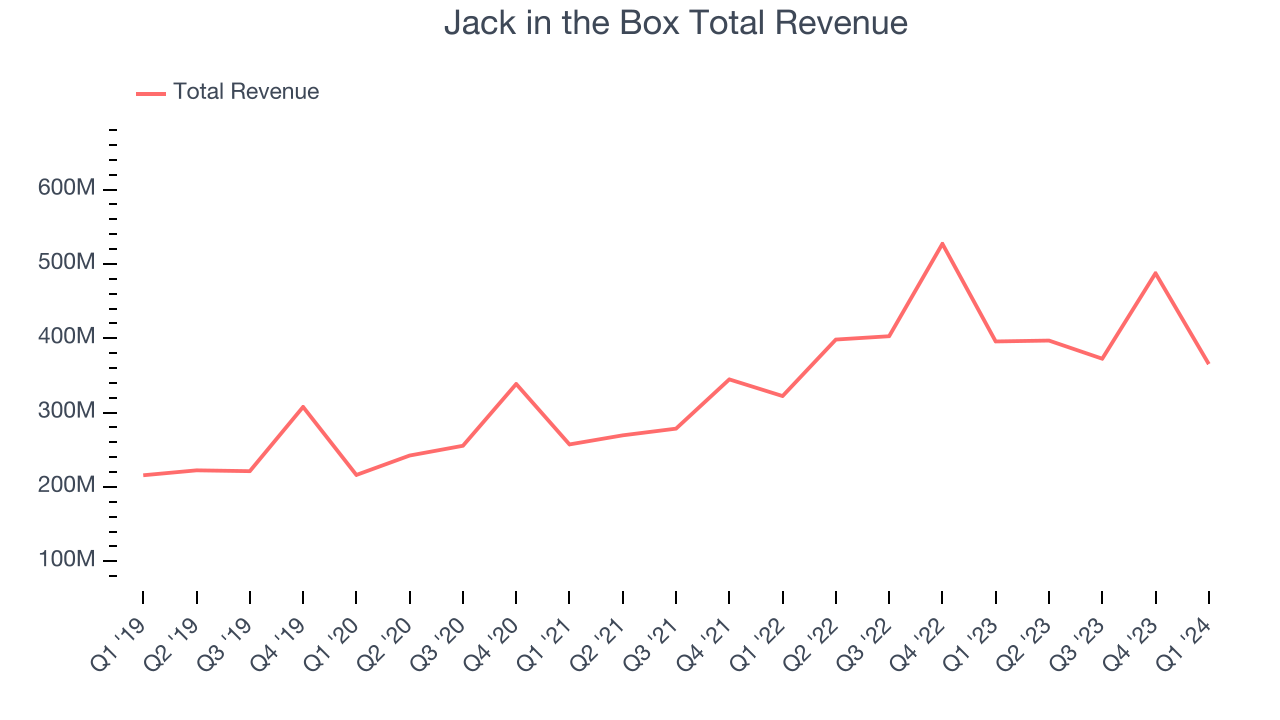
This quarter, Jack in the Box missed Wall Street's estimates and reported a rather uninspiring 7.7% year-on-year revenue decline, generating $365.3 million in revenue. Looking ahead, Wall Street expects revenue to decline 1.8% over the next 12 months.
Same-Store Sales
Same-store sales growth is an important metric that tracks organic growth and demand for a restaurant's established locations.
Jack in the Box's demand within its existing restaurants has generally risen over the last two years but lagged behind the broader sector. On average, the company's same-store sales have grown by 3.5% year on year. Given its declining physical footprint over the same period, this performance stems from increased foot traffic at existing restaurants, which is sometimes a side effect of reducing the total number of locations.
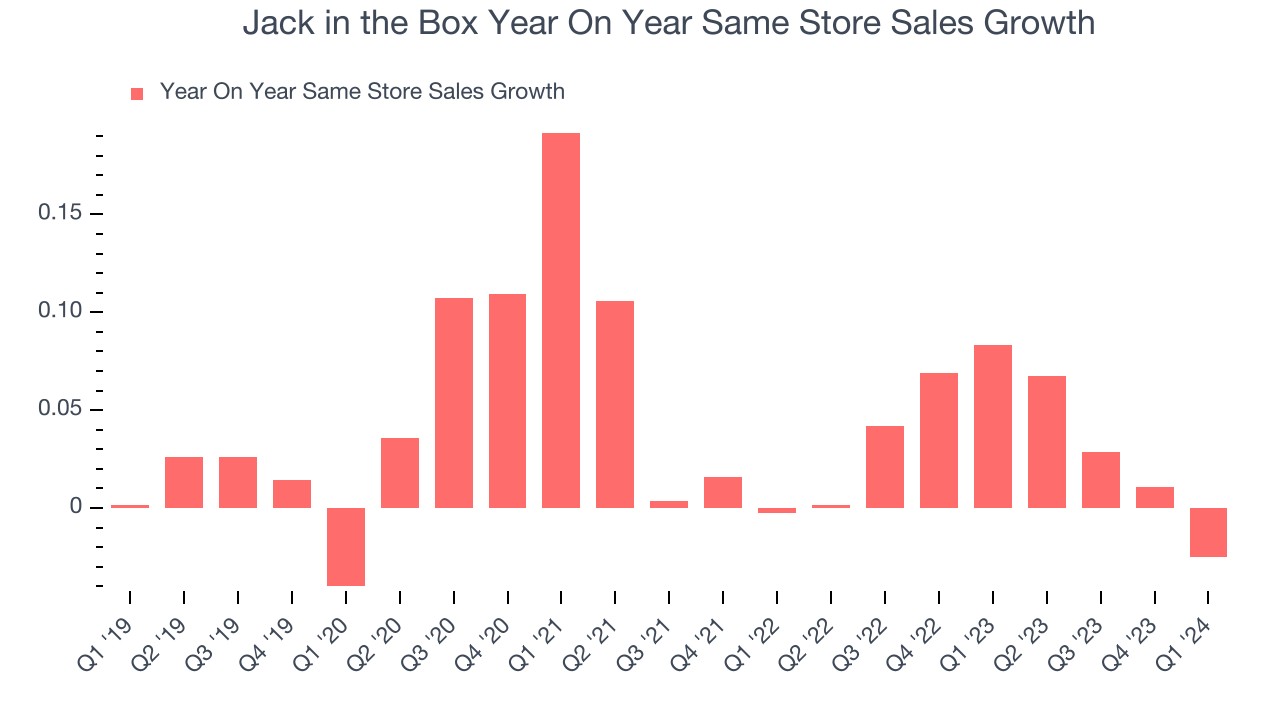
In the latest quarter, Jack in the Box's same-store sales fell 2.5% year on year. This decline was a reversal from the 8.3% year-on-year increase it posted 12 months ago. We'll be keeping a close eye on the company to see if this turns into a longer-term trend.
Number of Stores
When a chain like Jack in the Box is shuttering restaurants, it usually means that demand for its meals is waning, and the company is responding by closing underperforming locations to improve profitability. Since last year, Jack in the Box's restaurant count shrank by 587, or 21.1%, to 2,195 total locations in the most recently reported quarter.
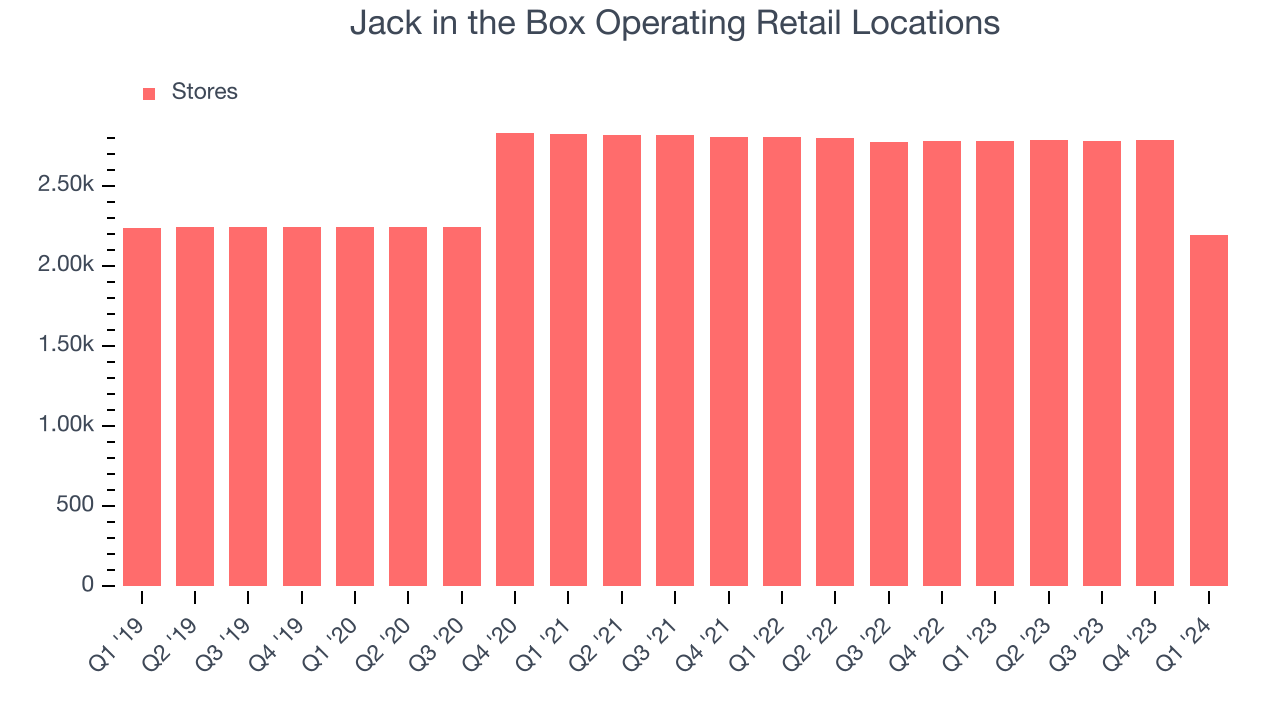
Taking a step back, Jack in the Box has generally closed its restaurants over the last two years, averaging 3.2% annual declines in locations. A smaller restaurant base means Jack in the Box must rely on higher foot traffic, larger order sizes, or price increases at existing restaurants to fuel revenue growth.
Gross Margin & Pricing Power
We prefer higher gross margins because they not only make it easier to generate more operating profits but also indicate pricing power and differentiation, whether it be the dining experience or quality and taste of food.
Jack in the Box's gross profit margin came in at 30.8% this quarter. up 1.4 percentage points year on year. This means the company makes $0.30 for every $1 in revenue before accounting for its operating expenses.
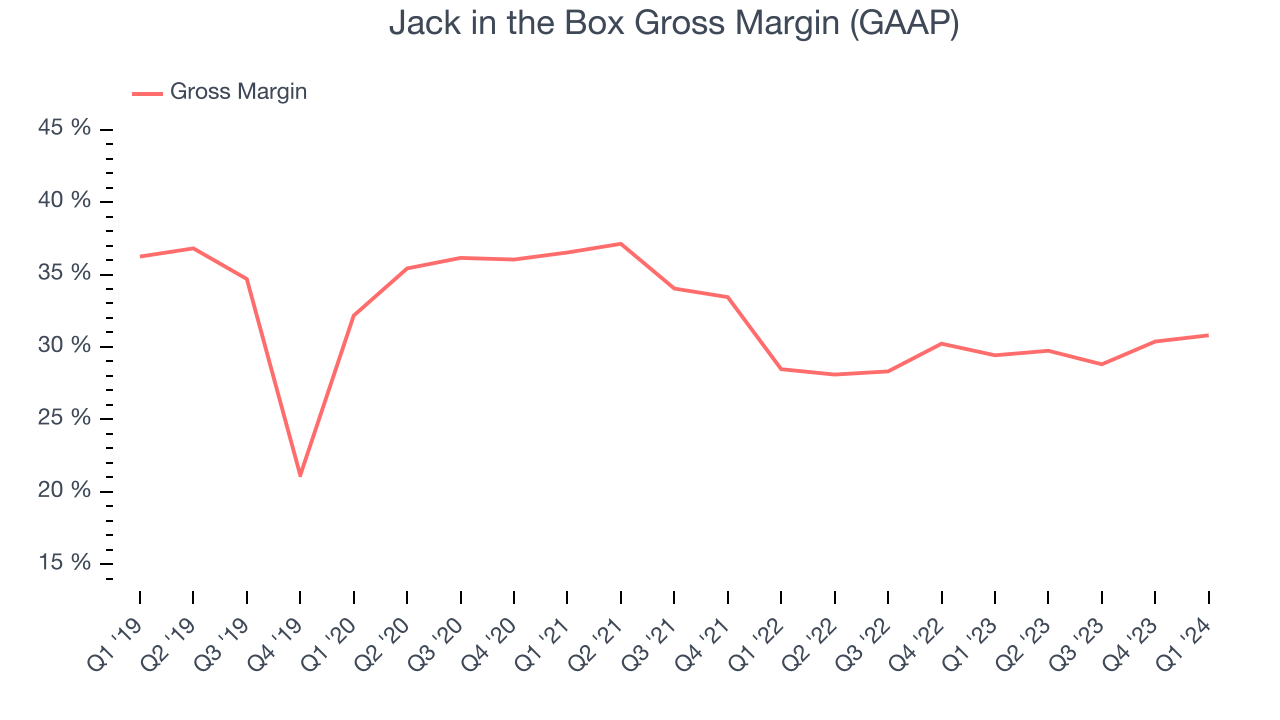
Jack in the Box's unit economics are higher than the typical restaurant company, giving it the flexibility to invest in areas such as marketing and talent to reach more consumers. As you can see above, it's averaged a decent 29.5% gross margin over the last eight quarters. Its margin has also been trending up over the last 12 months, averaging 3.2% year-on-year increases each quarter. If this trend continues, it could suggest a less competitive environment where the company has better pricing power and more stable input costs (such as ingredients and transportation expenses).
Operating Margin
Operating margin is a key profitability metric for restaurants because it accounts for all expenses keeping the lights on, including wages, rent, advertising, and other administrative costs.
This quarter, Jack in the Box generated an operating profit margin of 14.8%, in line with the same quarter last year. This indicates the company's costs have been relatively stable.
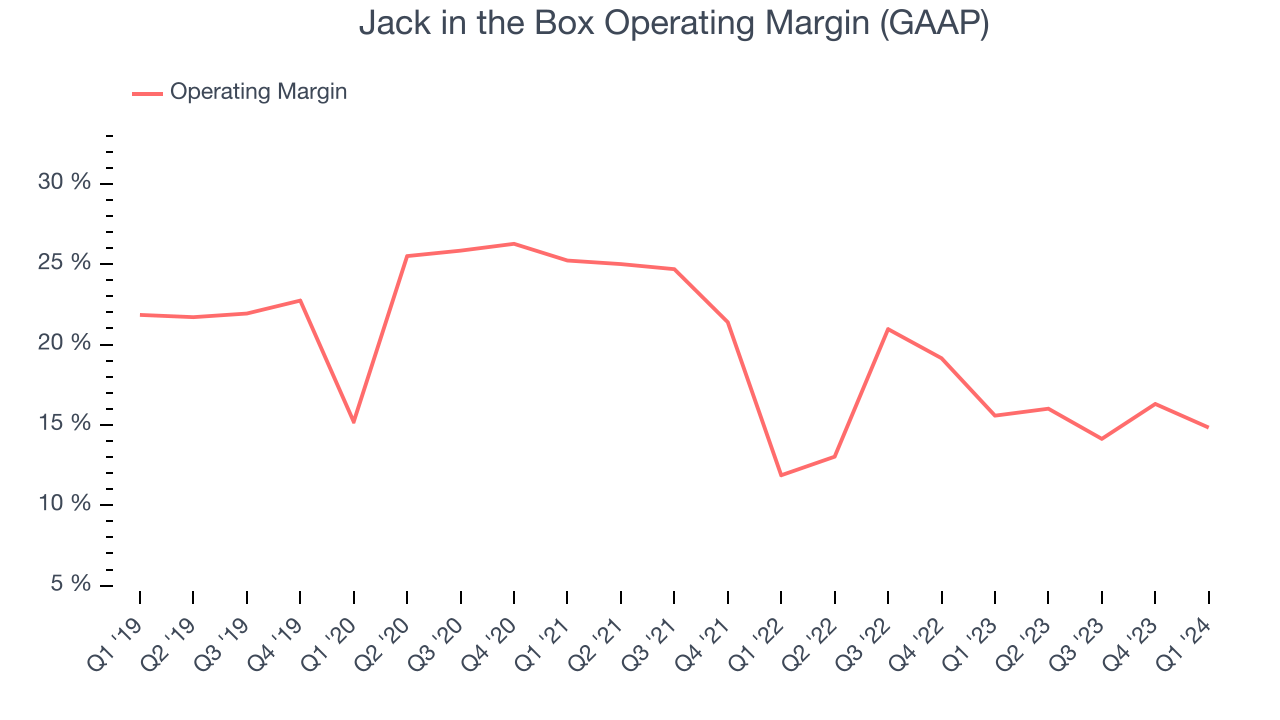 Zooming out, Jack in the Box has managed its expenses well over the last two years. It's demonstrated solid profitability for a restaurant business, producing an average operating margin of 16.4%. However, Jack in the Box's margin has declined, on average, by 1.9 percentage points each year. Although this isn't the end of the world, investors are likely hoping for better results in the future.
 EPS
These days, some companies issue new shares like there's no tomorrow. That's why we like to track earnings per share (EPS) because it accounts for shareholder dilution and share buybacks.
In Q1, Jack in the Box reported EPS at $1.46, up from $1.27 in the same quarter a year ago. This print beat Wall Street's estimates by 2.3%.
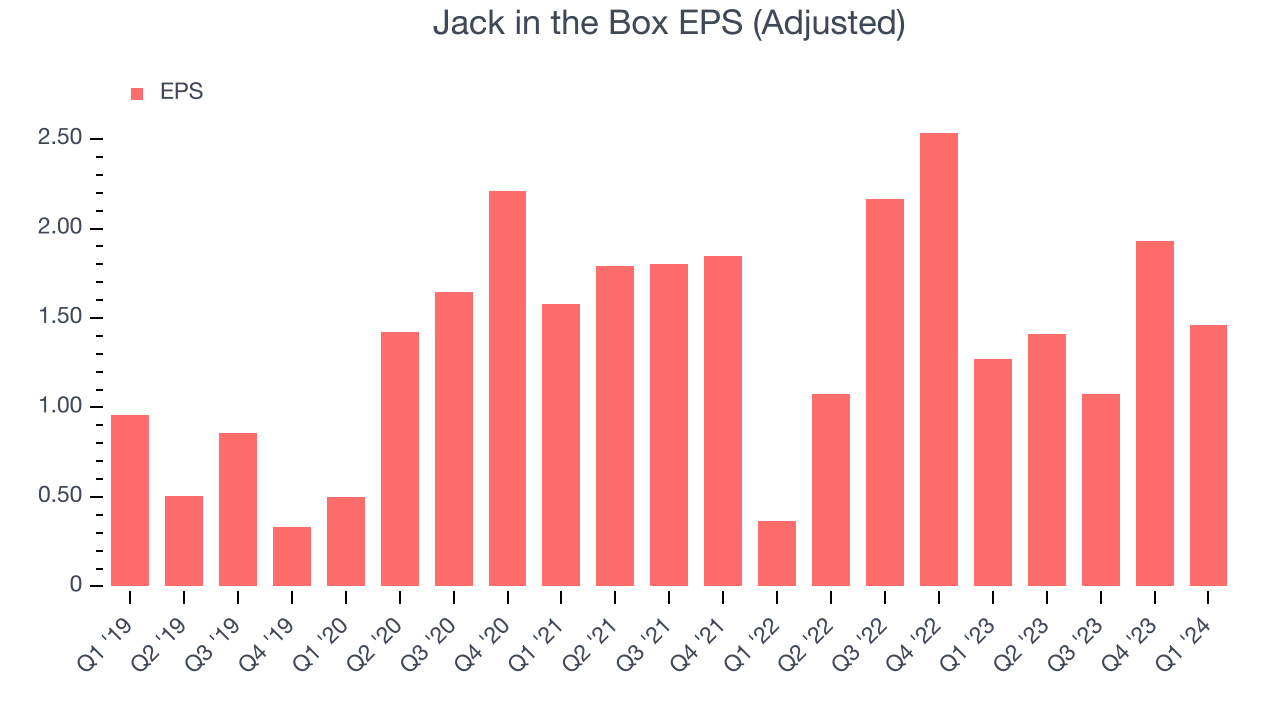
On the bright side, Wall Street expects the company to continue growing earnings over the next 12 months, with analysts projecting an average 14.7% year-on-year increase in EPS.
Cash Is King
Although earnings are undoubtedly valuable for assessing company performance, we believe cash is king because you can't use accounting profits to pay the bills.
Jack in the Box burned through $67.09 million of cash in Q1, representing a negative 18.4% free cash flow margin. The company shifted to cash flow negative from cash flow positive in the same quarter last year, which happened for several reasons including (but not limited to) seasonality or unforeseen, one-time events.
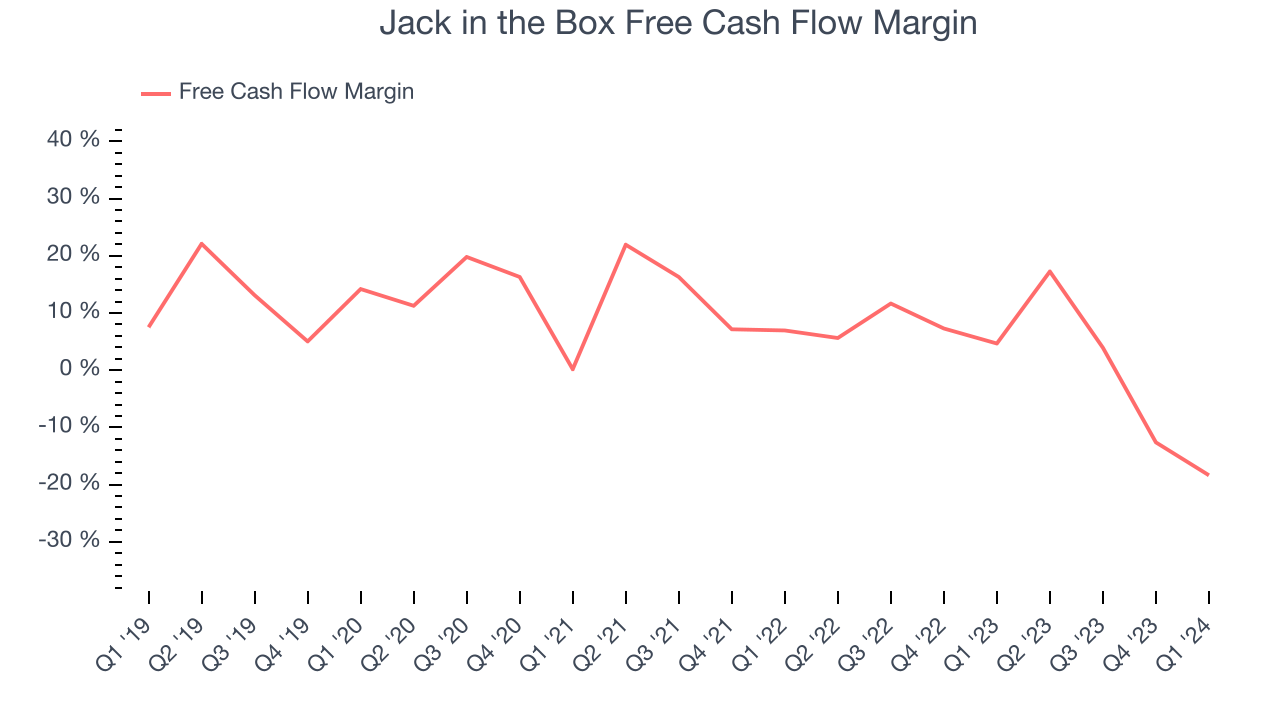
Over the last eight quarters, Jack in the Box has shown mediocre cash profitability, putting it in a pinch as it gives the company limited opportunities to reinvest, pay down debt, or return capital to shareholders. Its free cash flow margin has averaged 2.4%, subpar for a restaurant business. Furthermore, its margin has averaged year-on-year declines of 10.1 percentage points. We'll keep an eye on this as almost any movement in the wrong direction is undesirable given its already low free cash flow margin.
Return on Invested Capital (ROIC)
EPS and free cash flow tell us whether a company was profitable while growing revenue. But was it capital-efficient? A company’s ROIC explains this by showing how much operating profit a company makes compared to how much money the business raised (debt and equity).
Although Jack in the Box hasn't been the highest-quality company lately, it historically did a solid job investing in profitable business initiatives. Its five-year average ROIC was 13.9%, higher than most restaurant companies.
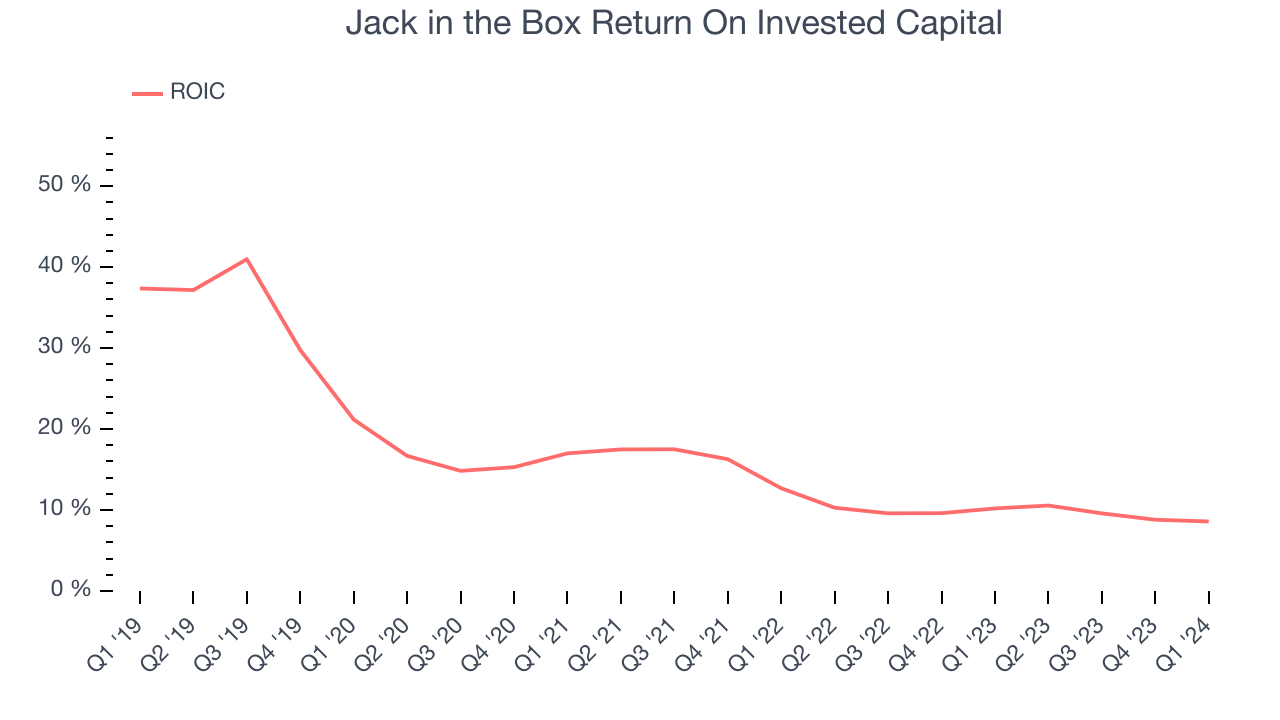
The trend in its ROIC, however, is often what surprises the market and drives the stock price. Unfortunately, Jack in the Box's ROIC averaged 9.7 percentage point decreases over the last few years. We like what management has done historically but are concerned its ROIC is declining, perhaps a symptom of waning business opportunities to invest profitably.
Balance Sheet Risk
Debt is a tool that can boost company returns but presents risks if used irresponsibly.
Jack in the Box's $3.18 billion of debt exceeds the $20.2 million of cash on its balance sheet. Furthermore, its 10x net-debt-to-EBITDA ratio (based on its EBITDA of $327.5 million over the last 12 months) shows the company is overleveraged.
At this level of debt, incremental borrowing becomes increasingly expensive and credit agencies could downgrade the company’s rating if profitability falls. Jack in the Box could also be backed into a corner if the market turns unexpectedly – a situation we seek to avoid as investors in high-quality companies.
We hope Jack in the Box can improve its balance sheet and remain cautious until it increases its profitability or reduces its debt.
Key Takeaways from Jack in the Box's Q1 Results
We liked how Jack in the Box beat analysts' gross margin, adjusted EBITDA, and EPS expectations this quarter. On the other hand, its same-store sales unfortunately missed analysts' expectations, leading to a revenue miss as well. While full year guidance was broadly lowered, the company did mention that "sales have improved since its [Smashed Jack product] introduction in mid-March". Overall, this quarter's results were mixed. The stock is flat after reporting and currently trades at $53.25 per share.
Is Now The Time?
Jack in the Box may have had a favorable quarter, but investors should also consider its valuation and business qualities when assessing the investment opportunity.
We cheer for all companies serving consumers, but in the case of Jack in the Box, we'll be cheering from the sidelines. Although its revenue growth has been good over the last five years, its falling restaurant base has made it challenging to grow revenue. And while its solid ROIC suggests it has grown profitably in the past, the downside is its poor same-store sales performance has been a headwind.
Jack in the Box's price-to-earnings ratio based on the next 12 months is 7.9x. While there are some things to like about Jack in the Box and its valuation is reasonable, we think there are better opportunities elsewhere in the market right now.
Wall Street analysts covering the company had a one-year price target of $80.72 per share right before these results (compared to the current share price of $53.25).
To get the best start with StockStory, check out our most recent stock picks, and then sign up to our earnings alerts by adding companies to your watchlist here. We typically have the quarterly earnings results analyzed within seconds of the data being released, and especially for companies reporting pre-market, this often gives investors the chance to react to the results before the market has fully absorbed the information.