
Cruise and exploration company Lindblad Expeditions (NASDAQ:LIND) reported Q1 CY2024 results exceeding Wall Street analysts' expectations, with revenue up 7.1% year on year to $153.6 million. The company expects the full year's revenue to be around $620 million, in line with analysts' estimates. It made a GAAP loss of $0.10 per share, down from its profit of $0.01 per share in the same quarter last year.
Lindblad Expeditions (LIND) Q1 CY2024 Highlights:
- Revenue: $153.6 million vs analyst estimates of $149.7 million (2.6% beat)
- EPS: -$0.10 vs analyst estimates of -$0.05 (-$0.05 miss)
- The company reconfirmed its revenue guidance for the full year of $620 million at the midpoint
- Gross Margin (GAAP): 48.4%, down from 49.8% in the same quarter last year
- Free Cash Flow of $37.45 million is up from -$17.11 million in the previous quarter
- Market Capitalization: $390 million
Founded by explorer Sven-Olof Lindblad in 1979, Lindblad Expeditions (NASDAQ:LIND) offers cruising experiences to remote destinations in partnership with National Geographic.
The company operates a fleet of small, nimble ships, uniquely equipped to navigate in remote and environmentally sensitive locations such as Antarctica. These vessels, often developed in partnership with the National Geographic Society, are designed to bring guests closer to the world's most pristine and hard-to-reach places, like the polar regions, the Galapagos Islands, and other unique global destinations.
The company's collaboration with National Geographic brings an educational dimension to the expeditions, featuring expert naturalists, scientists, and photographers who provide guests with in-depth, hands-on exploration and knowledge-sharing opportunities.
Hotels, Resorts and Cruise Lines
Hotels, resorts, and cruise line companies often sell experiences rather than tangible products, and in the last decade-plus, consumers have slowly shifted from buying "things" (wasteful) to buying "experiences" (memorable). In addition, the internet has introduced new ways of approaching leisure and lodging such as booking homes and longer-term accommodations. Traditional hotel, resorts, and cruise line companies must innovate to stay relevant in a market rife with innovation.
The company's primary competitors include Hurtigruten Group (OTCMKTS:HRGUF), Hapag-Lloyd Cruises (owned by TUI Group XETRA:TUI1), Silversea Cruises (owned by Royal Caribbean Group NYSE:RCL), and private companies Ponant and Quark Expeditions (owned by Travelopia).Sales Growth
Examining a company's long-term performance can provide clues about its business quality. Any business can put up a good quarter or two, but the best consistently grow over the long haul. Lindblad Expeditions's annualized revenue growth rate of 12.8% over the last five years was mediocre for a consumer discretionary business. 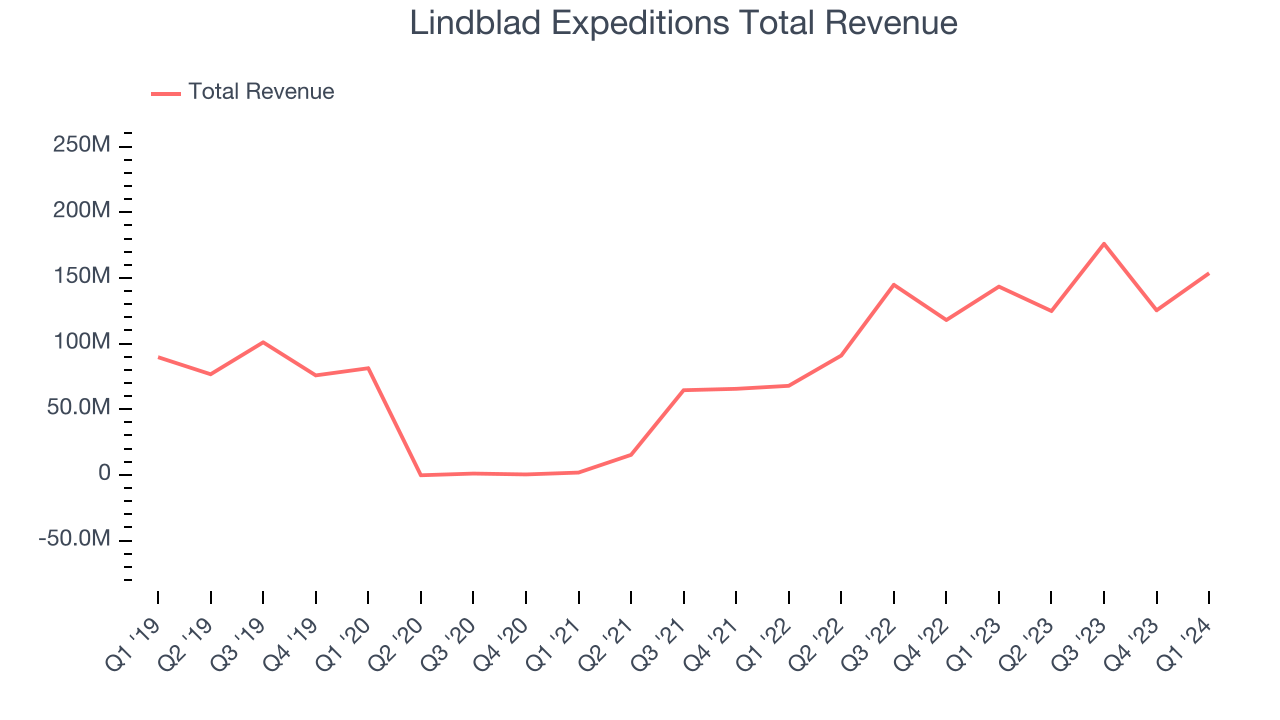 Within consumer discretionary, a long-term historical view may miss a company riding a successful new property or emerging trend. That's why we also follow short-term performance. Lindblad Expeditions's annualized revenue growth of 64.9% over the last two years is above its five-year trend, suggesting some bright spots.
This quarter, Lindblad Expeditions reported solid year-on-year revenue growth of 7.1%, and its $153.6 million of revenue outperformed Wall Street's estimates by 2.6%. Looking ahead, Wall Street expects sales to grow 9% over the next 12 months, an acceleration from this quarter.
Operating Margin
Operating margin is an important measure of profitability. It’s the portion of revenue left after accounting for all core expenses–everything from the cost of goods sold to advertising and wages. Operating margin is also useful for comparing profitability across companies with different levels of debt and tax rates because it excludes interest and taxes.
Lindblad Expeditions was roughly breakeven when averaging the last two years of quarterly operating profits, weak for a consumer discretionary business.This quarter, Lindblad Expeditions generated an operating profit margin of 5.1%, down 3.6 percentage points year on year.
Over the next 12 months, Wall Street expects Lindblad Expeditions to become more profitable. Analysts are expecting the company’s LTM operating margin of 1% to rise to 5.4%.EPS
We track long-term historical earnings per share (EPS) growth for the same reason as long-term revenue growth. Compared to revenue, however, EPS highlights whether a company's growth was profitable.
Over the last five years, Lindblad Expeditions's EPS dropped 416%, translating into 38.8% annualized declines. Thankfully, Lindblad Expeditions has bucked its trend as of late, growing its EPS over the last three years. We'll see if the company's growth is sustainable.
In Q1, Lindblad Expeditions reported EPS at negative $0.10, down from $0.01 in the same quarter last year. This print unfortunately missed analysts' estimates. Over the next 12 months, Wall Street is optimistic. Analysts are projecting Lindblad Expeditions's LTM EPS of negative $1.02 to reach break even.
Cash Is King
If you've followed StockStory for a while, you know we emphasize free cash flow. Why, you ask? We believe that in the end, cash is king, and you can't use accounting profits to pay the bills.
Over the last two years, Lindblad Expeditions broke even from a free cash flow perspective, subpar for a consumer discretionary business.
Lindblad Expeditions's free cash flow came in at $37.45 million in Q1, equivalent to a 24.4% margin. This result was great for the business as it flipped from cash flow negative in the same quarter last year to cash flow positive this quarter.
Return on Invested Capital (ROIC)
EPS and free cash flow tell us whether a company was profitable while growing revenue. But was it capital-efficient? Enter ROIC, a metric showing how much operating profit a company generates relative to how much money the business raised (debt and equity).
Lindblad Expeditions's five-year average return on invested capital was negative 14.4%, meaning management lost money while trying to expand the business. Its returns were among the worst in the consumer discretionary sector.
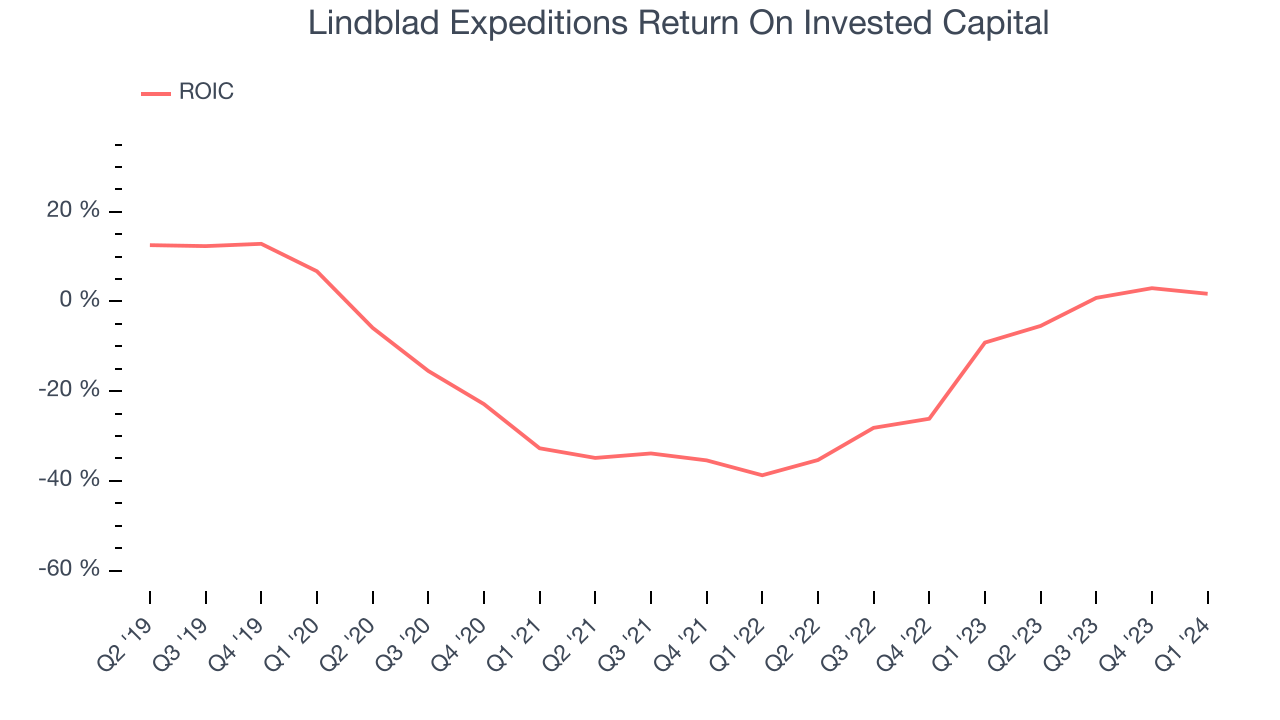
The trend in its ROIC, however, is often what surprises the market and drives the stock price. Over the last few years, Lindblad Expeditions's ROIC averaged 9.3 percentage point increases. This is a good sign, and we hope the company can continue improving.
Balance Sheet Risk
As long-term investors, the risk we care most about is the permanent loss of capital. This can happen when a company goes bankrupt or raises money from a disadvantaged position and is separate from short-term stock price volatility, which we are much less bothered by.
Lindblad Expeditions's $624.5 million of debt exceeds the $177.7 million of cash on its balance sheet. Furthermore, its 7x net-debt-to-EBITDA ratio (based on its EBITDA of $65.63 million over the last 12 months) shows the company is overleveraged.
At this level of debt, incremental borrowing becomes increasingly expensive and credit agencies could downgrade the company’s rating if profitability falls. Lindblad Expeditions could also be backed into a corner if the market turns unexpectedly – a situation we seek to avoid as investors in high-quality companies.
We hope Lindblad Expeditions can improve its balance sheet and remain cautious until it increases its profitability or reduces its debt.
Key Takeaways from Lindblad Expeditions's Q1 Results
It was good to see Lindblad Expeditions beat analysts' revenue expectations this quarter. On the other hand, its EPS missed and its operating margin fell short of Wall Street's estimates. Overall, this was a mixed quarter for Lindblad Expeditions. The stock is up 1.9% after reporting and currently trades at $7.45 per share.
Is Now The Time?
Lindblad Expeditions may have had a tough quarter, but investors should also consider its valuation and business qualities when assessing the investment opportunity.
We cheer for all companies serving consumers, but in the case of Lindblad Expeditions, we'll be cheering from the sidelines. Its revenue growth has been mediocre over the last five years. And while its projected EPS for the next year implies the company's fundamentals will improve, the downside is its declining EPS over the last five years makes it hard to trust. On top of that, its relatively low ROIC suggests it has historically struggled to find compelling business opportunities.
While we've no doubt one can find things to like about Lindblad Expeditions, we think there are better opportunities elsewhere in the market. We don't see many reasons to get involved at the moment.
Wall Street analysts covering the company had a one-year price target of $13.75 per share right before these results (compared to the current share price of $7.45).
To get the best start with StockStory, check out our most recent stock picks, and then sign up for our earnings alerts by adding companies to your watchlist here. We typically have the quarterly earnings results analyzed within seconds of the data being released, and especially for companies reporting pre-market, this often gives investors the chance to react to the results before the market has fully absorbed the information.