
Automotive parts company LKQ (NASDAQ:LKQ) missed analysts' expectations in Q1 CY2024, with revenue up 10.6% year on year to $3.70 billion. It made a non-GAAP profit of $0.82 per share, down from its profit of $1.04 per share in the same quarter last year.
LKQ (LKQ) Q1 CY2024 Highlights:
- Revenue: $3.70 billion vs analyst estimates of $3.76 billion (1.6% miss)
- EPS (non-GAAP): $0.82 vs analyst expectations of $0.95 (13.8% miss)
- Full year guidance maintained for adjusted EPS and free cash flow (although organic sales guidance lowered)
- Gross Margin (GAAP): 39.2%, down from 41% in the same quarter last year
- Free Cash Flow of $187 million, up 115% from the previous quarter
- Organic Revenue was down 1.1% year on year
- Market Capitalization: $13.05 billion
A global distributor of vehicle parts and accessories, LKQ (NASDAQ:LKQ) offers its customers a comprehensive selection of high-quality, affordably priced automobile products.
LKQ's core business sells a wide array of vehicle replacement products, including recycled automotive parts harvested from salvaged vehicles, remanufactured parts that are restored to original specifications, and new parts sourced from OEMs (Original Equipment Manufacturers) and other suppliers.
This diverse product portfolio enables LKQ to serve a broad customer base, ranging from collision and mechanical repair shops to individual vehicle owners. Its various price points (new and used) also allow it to cater to customers looking for high-quality replacement parts as well as those looking for more affordable options.
With numerous warehouses and distribution centers strategically located across its operating regions, LKQ ensures timely and efficient delivery of parts to its customers. The company leverages modern logistics and inventory management systems to maintain high levels of customer service and satisfaction.
Specialized Consumer Services
Some consumer discretionary companies don’t fall neatly into a category because their products or services are unique. Although their offerings may be niche, these companies have often found more efficient or technology-enabled ways of doing or selling something that has existed for a while. Technology can be a double-edged sword, though, as it may lower the barriers to entry for new competitors and allow them to do serve customers better.
LKQ's primary competitors include Advance Auto Parts (NYSE:AAP), AutoZone (NYSE:AZO), O'Reilly Automotive (NASDAQ:ORLY), and Genuine Parts Company (NYSE:GPC).Sales Growth
Reviewing a company's long-term performance can reveal insights into its business quality. Any business can have short-term success, but a top-tier one sustains growth for years. LKQ's annualized revenue growth rate of 3% over the last five years was weak for a consumer discretionary business. 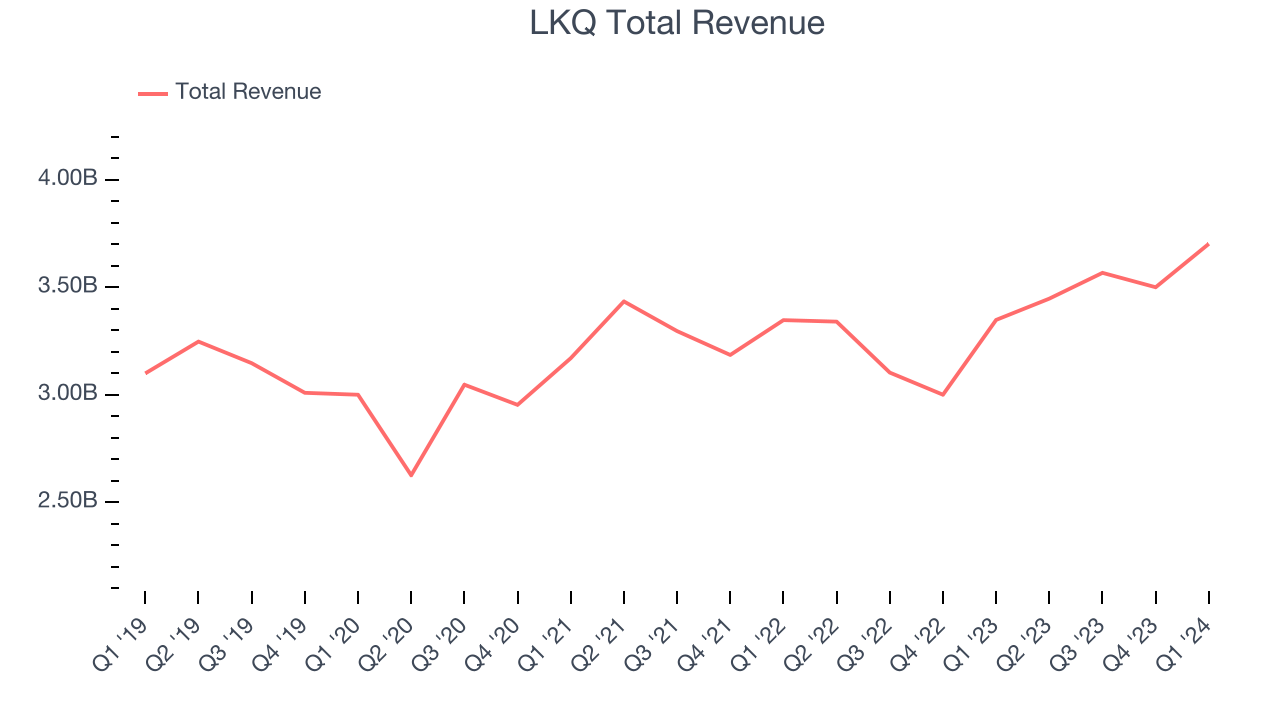 Within consumer discretionary, product cycles are short and revenue can be hit-driven due to rapidly changing trends. That's why we also follow short-term performance. LKQ's annualized revenue growth of 3.5% over the last two years aligns with its five-year revenue growth, suggesting the company's demand has been stable.
We can better understand the company's revenue dynamics by analyzing its organic sales, which strip out currency fluctuations and one-time events like acquisitions. Over the last two years, LKQ's organic sales averaged 2.7% year-on-year growth. Because this number aligns with its revenue growth during the same period, we can see the company's core operations drove most of its performance. 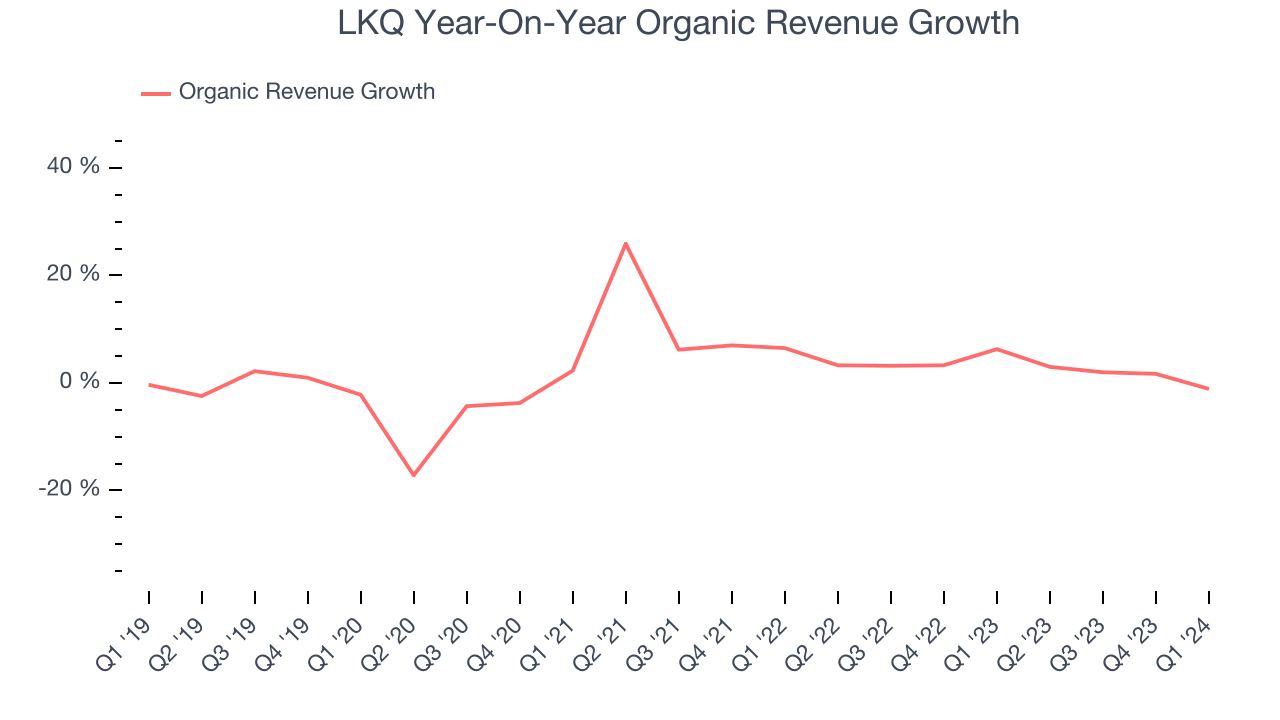
This quarter, LKQ's revenue grew 10.6% year on year to $3.70 billion, falling short of Wall Street's estimates. Looking ahead, Wall Street expects sales to grow 8.6% over the next 12 months, a deceleration from this quarter.
Operating Margin
Operating margin is an important measure of profitability. It’s the portion of revenue left after accounting for all core expenses–everything from the cost of goods sold to advertising and wages. Operating margin is also useful for comparing profitability across companies with different levels of debt and tax rates because it excludes interest and taxes.
LKQ has done a decent job managing its expenses over the last eight quarters. The company has produced an average operating margin of 10.6%, higher than the broader consumer discretionary sector.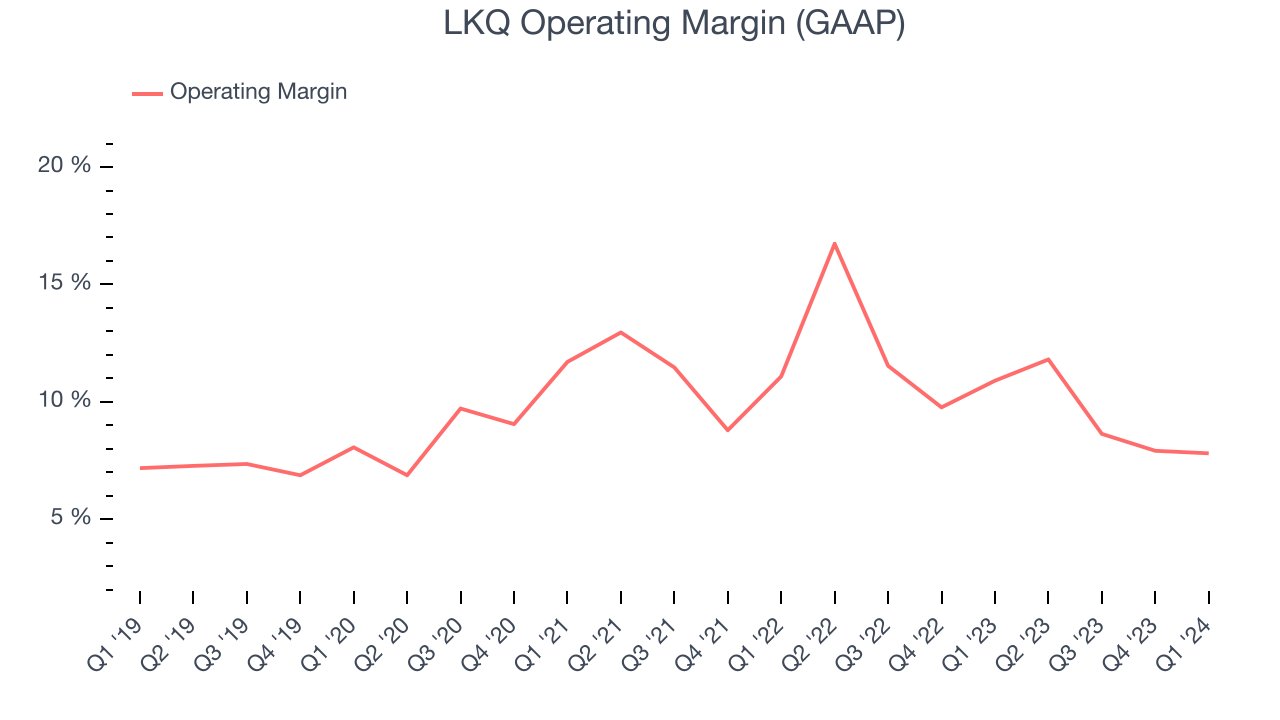
In Q1, LKQ generated an operating profit margin of 7.8%, down 3.1 percentage points year on year.
Over the next 12 months, Wall Street expects LKQ to become more profitable. Analysts are expecting the company’s LTM operating margin of 9% to rise to 10.8%.EPS
We track long-term historical earnings per share (EPS) growth for the same reason as long-term revenue growth. Compared to revenue, however, EPS highlights whether a company's growth was profitable. 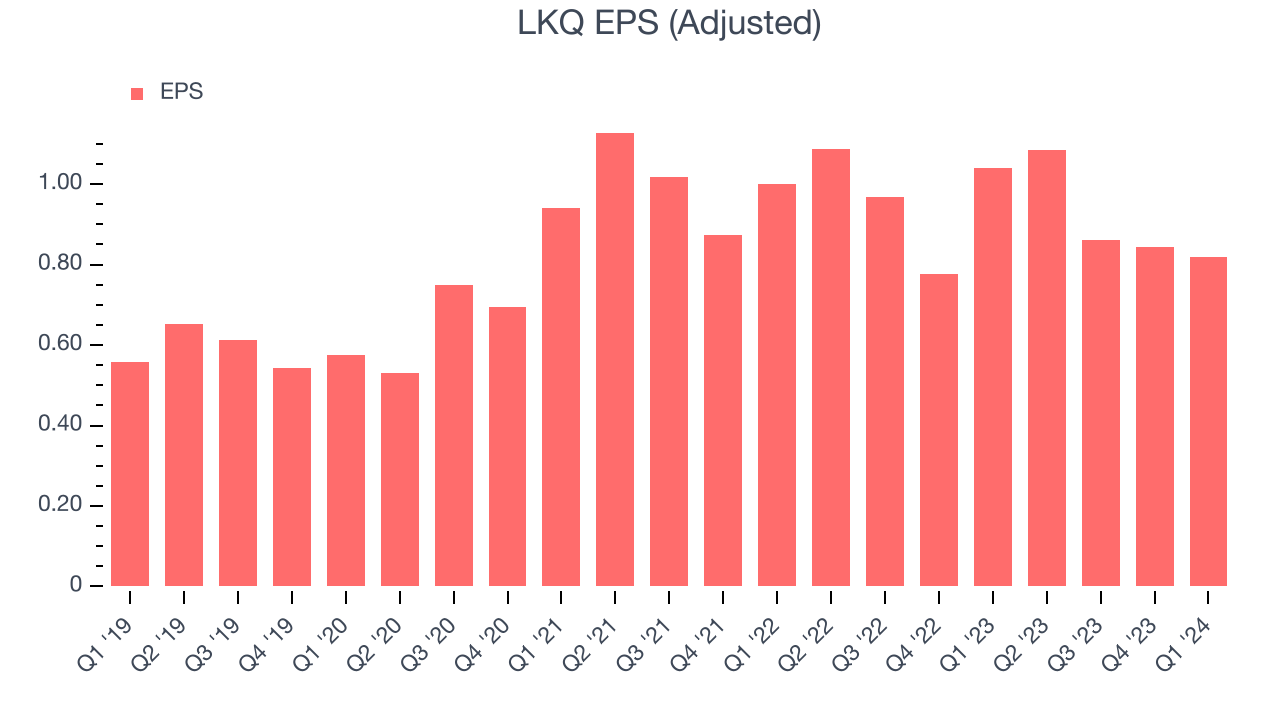
Over the last five years, LKQ's EPS grew 64.1%, translating into a decent 10.4% compounded annual growth rate. This performance is materially higher than its 3% annualized revenue growth over the same period. Let's dig into why.
A five-year view shows that LKQ has repurchased its stock, shrinking its share count by 15.3%. This has led to higher per share earnings. Taxes and interest expenses can also affect EPS growth, but they don't tell us as much about a company's fundamentals.In Q1, LKQ reported EPS at $0.82, down from $1.04 in the same quarter last year. This print unfortunately missed analysts' estimates, but we care more about long-term EPS growth rather than short-term movements. Over the next 12 months, Wall Street expects LKQ to grow its earnings. Analysts are projecting its LTM EPS of $3.61 to climb by 16.9% to $4.22.
Cash Is King
Although earnings are undoubtedly valuable for assessing company performance, we believe cash is king because you can't use accounting profits to pay the bills.
Over the last two years, LKQ has shown mediocre cash profitability, putting it in a pinch as it gives the company limited opportunities to reinvest, pay down debt, or return capital to shareholders. Its free cash flow margin has averaged 6.9%, subpar for a consumer discretionary business.
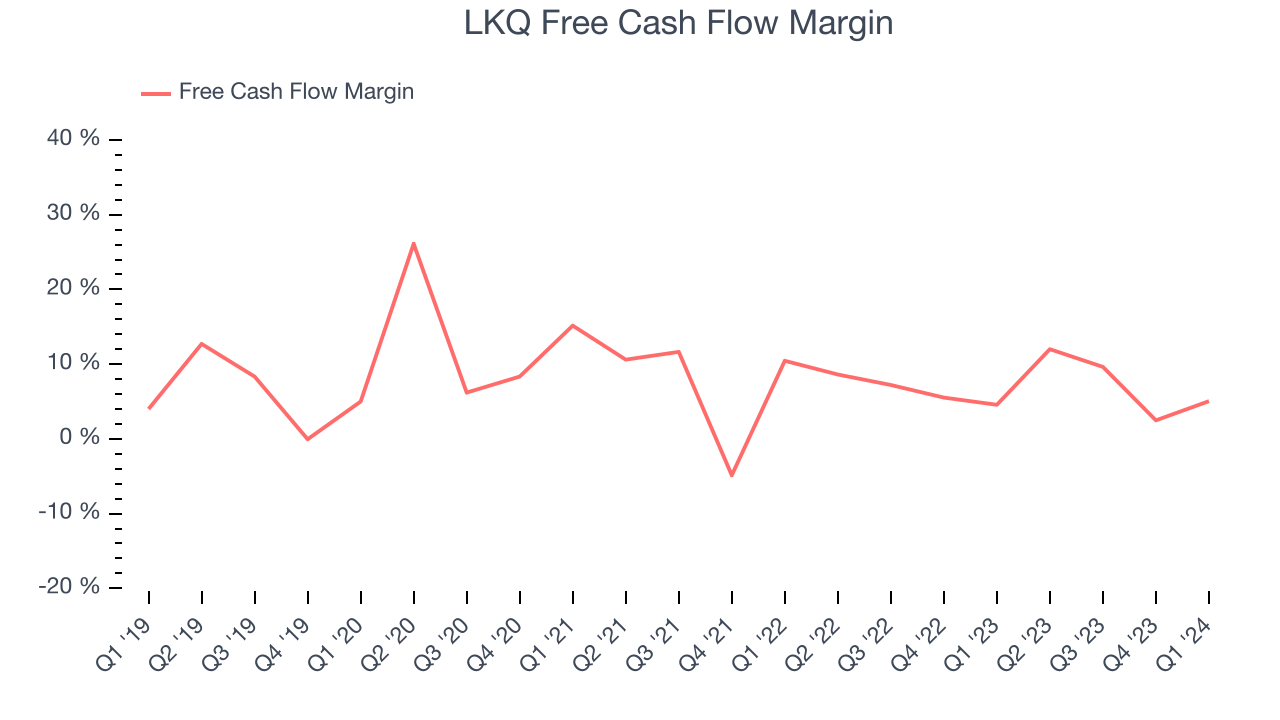
LKQ's free cash flow came in at $187 million in Q1, equivalent to a 5% margin and up 22.2% year on year. Over the next year, analysts predict LKQ's cash profitability will fall. Their consensus estimates imply its LTM free cash flow margin of 7.3% will decrease to 6.2%.
Return on Invested Capital (ROIC)
EPS and free cash flow tell us whether a company was profitable while growing revenue. But was it capital-efficient? Enter ROIC, a metric showing how much operating profit a company generates relative to how much money the business raised (debt and equity).
LKQ's five-year average return on invested capital was 10.4%, somewhat low compared to the best consumer discretionary companies that pump out 25%+. Its returns suggest it historically did a subpar job investing in profitable business initiatives.
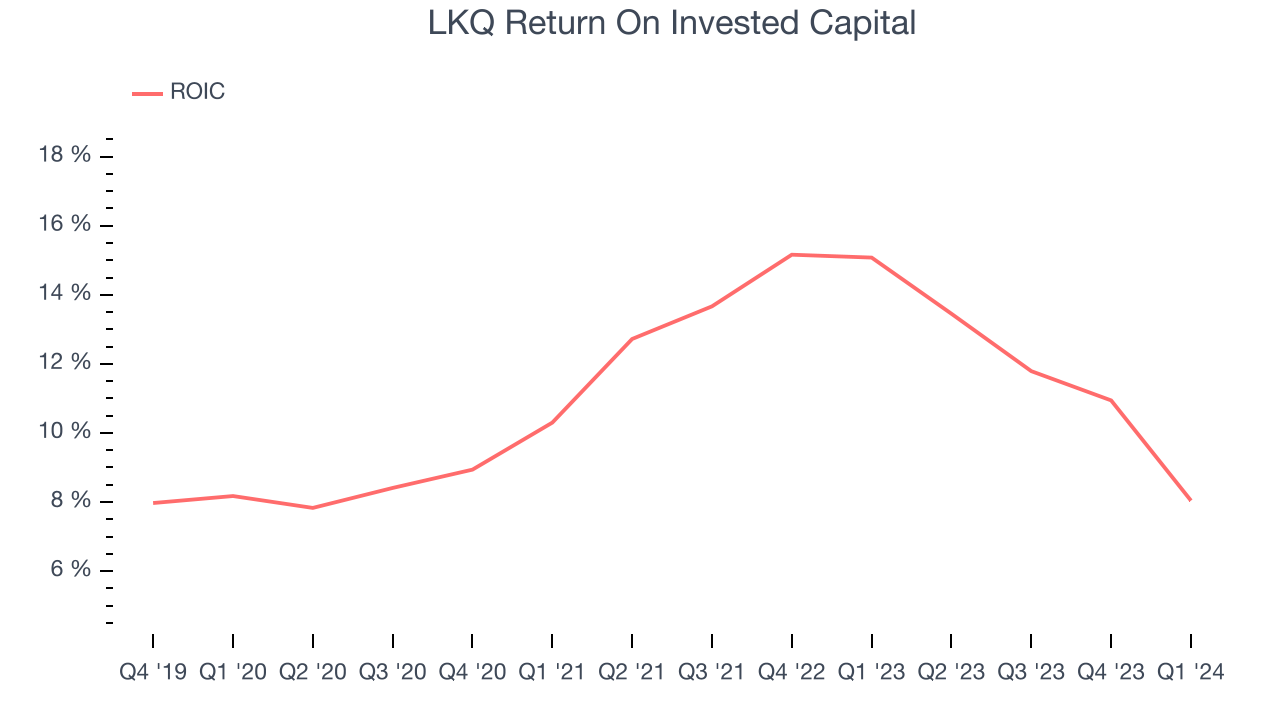
The trend in its ROIC, however, is often what surprises the market and drives the stock price. Over the last few years, LKQ's ROIC averaged 2.3 percentage point increases. This is a good sign, and we hope the company can continue improving.
Balance Sheet Risk
Debt is a tool that can boost company returns but presents risks if used irresponsibly.
LKQ reported $344 million of cash and $5.61 billion of debt on its balance sheet in the most recent quarter. As investors in high-quality companies, we primarily focus on two things: 1) that a company's debt level isn't too high and 2) that its interest payments are not excessively burdening the business.
With $1.69 billion of EBITDA over the last 12 months, we view LKQ's 3.1x net-debt-to-EBITDA ratio as safe. We also see its $129 million of annual interest expenses as appropriate. The company's profits give it plenty of breathing room, allowing it to continue investing in new initiatives.
Key Takeaways from LKQ's Q1 Results
We struggled to find many strong positives in the quarter's results. Its organic revenue, reported revenue, and EPS all missed Wall Street's estimates. However, full year guidance was maintained for adjusted EPS and free cash flow. The company stated that "despite the revenue headwinds we encountered in the first quarter, we are maintaining our adjusted earnings per share and free cash flow guidance. We have confidence in our team’s abilities and their track record of swiftly and effectively implementing action plans to address our cost-structure, and have already made meaningful changes to reflect current levels of demand." Overall, the results could have been better. The stock is flat after reporting and currently trades at $48.91 per share.
Is Now The Time?
LKQ may have had a tough quarter, but investors should also consider its valuation and business qualities when assessing the investment opportunity.
We cheer for all companies serving consumers, but in the case of LKQ, we'll be cheering from the sidelines. Its revenue growth has been weak over the last five years, but at least growth is expected to increase in the short term. And while its projected EPS for the next year implies the company's fundamentals will improve, the downside is its relatively low ROIC suggests it has historically struggled to find compelling business opportunities. On top of that, its organic sales performance has been disappointing.
LKQ's price-to-earnings ratio based on the next 12 months is 11.6x. While there are some things to like about LKQ and its valuation is reasonable, we think there are better opportunities elsewhere in the market right now.
Wall Street analysts covering the company had a one-year price target of $61.32 per share right before these results (compared to the current share price of $48.91).
To get the best start with StockStory, check out our most recent stock picks, and then sign up for our earnings alerts by adding companies to your watchlist here. We typically have the quarterly earnings results analyzed within seconds of the data being released, and especially for companies reporting pre-market, this often gives investors the chance to react to the results before the market has fully absorbed the information.