
Athletic apparel retailer Lululemon (NASDAQ:LULU) reported results in line with analysts' expectations in Q4 CY2023, with revenue up 15.6% year on year to $3.21 billion. On the other hand, next quarter's revenue guidance of $2.19 billion was less impressive, coming in 3.2% below analysts' estimates. It made a GAAP profit of $5.29 per share, improving from its profit of $0.94 per share in the same quarter last year.
Lululemon (LULU) Q4 CY2023 Highlights:
- Revenue: $3.21 billion vs analyst estimates of $3.20 billion (small beat)
- EPS: $5.29 vs analyst estimates of $5.03 (5.1% beat)
- Revenue Guidance for Q1 CY2024 is $2.19 billion at the midpoint, below analyst estimates of $2.26 billion
- Management's revenue guidance for the upcoming financial year 2024 is $10.75 billion at the midpoint, missing analyst estimates by 1.7% and implying 11.8% growth (vs 19.1% in FY2023)
- Gross Margin (GAAP): 59.4%, up from 55.1% in the same quarter last year
- Free Cash Flow of $1.18 billion, up 40.3% from the same quarter last year
- Same-Store Sales were up 12% year on year
- Store Locations: 711 at quarter end, increasing by 56 over the last 12 months
- Market Capitalization: $42.71 billion
Originally serving yogis and hockey players, Lululemon (NASDAQ:LULU) is a designer, distributor, and retailer of athletic apparel for men and women.
Lululemon was founded in 1998 to provide stylish athletic wear that supports an active and healthy lifestyle. The brand emerged from the growing demand for functional yet fashionable fitness apparel, starting with yoga wear and expanding to a wide range of athletic and leisure clothing.
The company's offerings encompass athletic wear, including yoga pants, running gear, workout accessories, and lifestyle apparel. It addresses the gap in the market for premium, well-crafted athletic apparel that can transition seamlessly from the gym to daily life - you might have heard the term 'Athleisure', which Lululemon pioneered. The brand has cultivated a loyal customer base through its products, customer support (such as free alterations), and community events.
Lululemon's revenue stems from product sales in its company-owned stores and direct-to-consumer channels. E-commerce makes up a large chunk of its revenue, and customers are encouraged to download its mobile app to track purchases and create support tickets for alterations. It also generates sales through certain wholesale accounts, licenses and supply arrangements, gently-used products through its "Like New" program, and connected hardware and associated subscriptions through Lululemon Studio.
Apparel Retailer
Apparel sales are not driven so much by personal needs but by seasons, trends, and innovation, and over the last few decades, the category has shifted meaningfully online. Retailers that once only had brick-and-mortar stores are responding with omnichannel presences. The online shopping experience continues to improve and retail foot traffic in places like shopping malls continues to stall, so the evolution of clothing sellers marches on.
Competitors in the athletic apparel industry include Nike (NYSE:NKE), Under Armour (NYSE:UA), and Columbia Sportswear (NASDAQ:COLM).Sales Growth
Lululemon is larger than most consumer retail companies and benefits from economies of scale, giving it an edge over its competitors.
As you can see below, the company's annualized revenue growth rate of 24.7% over the last four years (we compare to 2019 to normalize for COVID-19 impacts) was incredible as it added more brick-and-mortar locations and increased sales at existing, established stores.
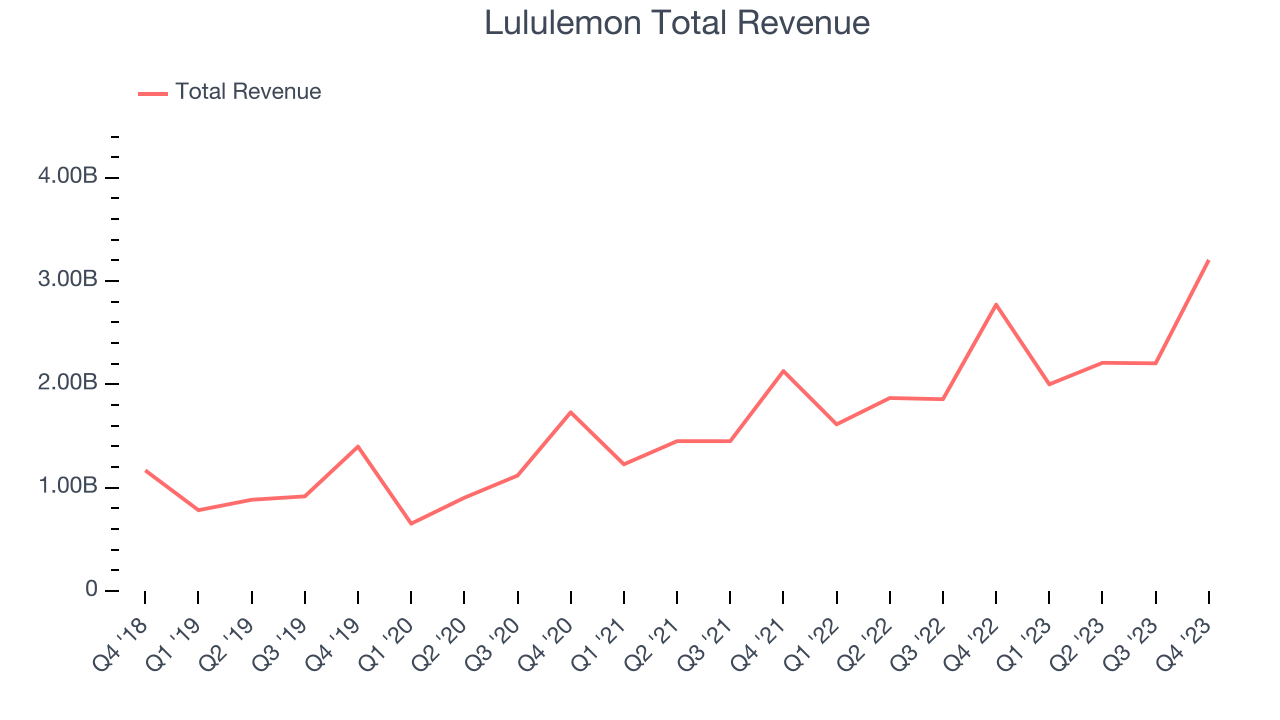
This quarter, Lululemon's year-on-year revenue growth clocked in at 15.6%, and its $3.21 billion in revenue was in line with Wall Street's estimates. The company is guiding for revenue to rise 9.3% year on year to $2.19 billion next quarter, slowing from the 24% year-on-year increase it recorded in the same quarter last year. Looking ahead, Wall Street expects sales to grow 13.5% over the next 12 months, a deceleration from this quarter.
Same-Store Sales
Lululemon's demand has outpaced the broader consumer retail sector over the last eight quarters. On average, the company has grown its same-store sales by a robust 18.8% year on year. This performance gives it the confidence to rapidly expand its store count. When a company has strong demand, more locations should help it reach more customers seeking its products and boost revenue growth.
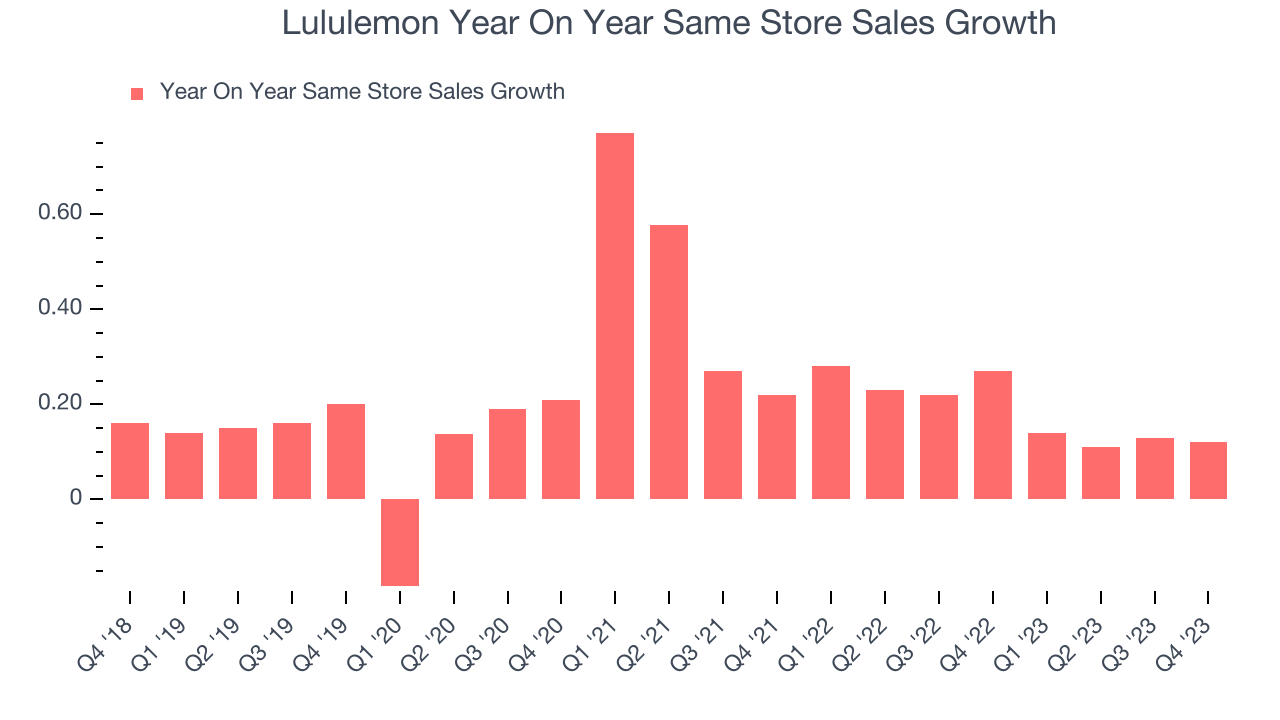
In the latest quarter, Lululemon's same-store sales rose 12% year on year. By the company's standards, this growth was a meaningful deceleration from the 27% year-on-year increase it posted 12 months ago. We'll be watching Lululemon closely to see if it can reaccelerate growth.
Number of Stores
A retailer's store count often determines on how much revenue it can generate.
When a retailer like Lululemon is opening new stores, it usually means it's investing for growth because demand is greater than supply. Since last year, Lululemon's store count increased by 56 locations, or 8.5%, to 711 total retail locations in the most recently reported quarter.
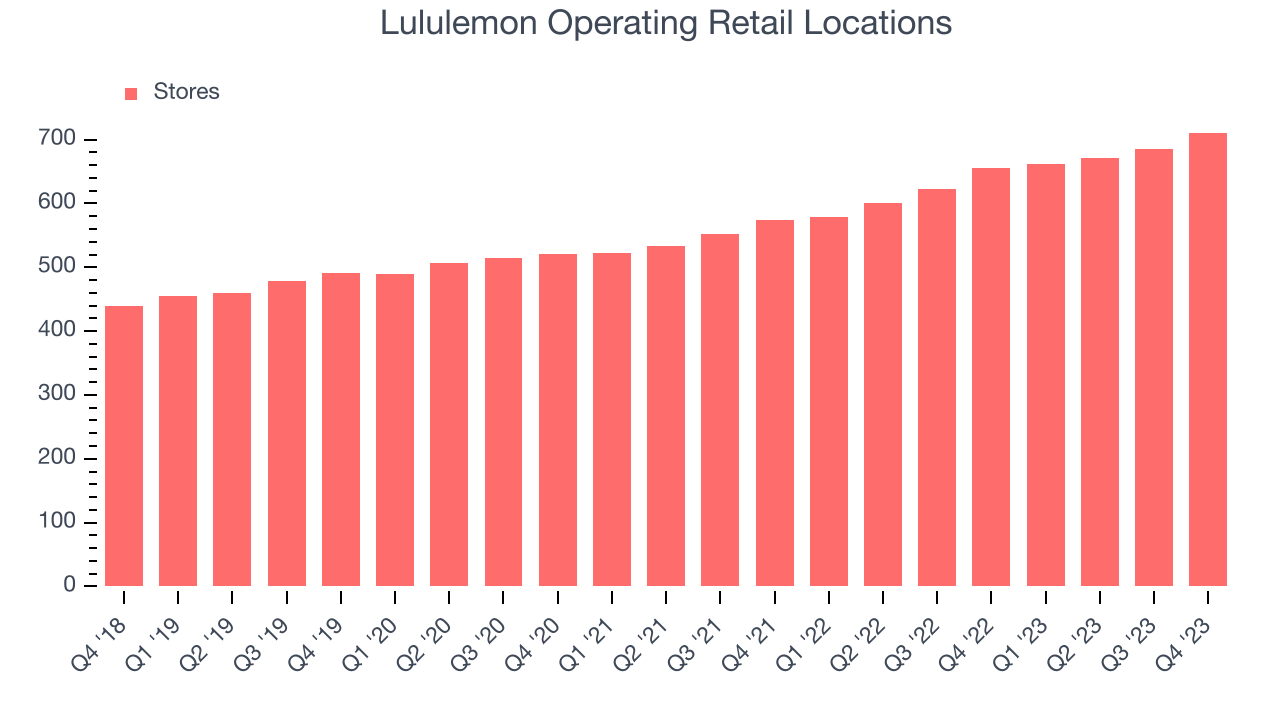
Taking a step back, the company has rapidly opened new stores over the last eight quarters, averaging 11.9% annual growth in its physical footprint. This store growth is much higher than other retailers. With an expanding store base and demand, revenue growth can come from multiple vectors: sales from new stores, sales from e-commerce, or increased foot traffic and higher sales per customer at existing stores.
Gross Margin & Pricing Power
Lululemon has best-in-class unit economics for a retailer, enabling it to invest in areas such as marketing and talent to stay one step ahead of the competition. As you can see below, it's averaged an exceptional 57% gross margin over the last two years. This means the company makes $0.57 for every $1 in revenue before accounting for its operating expenses.
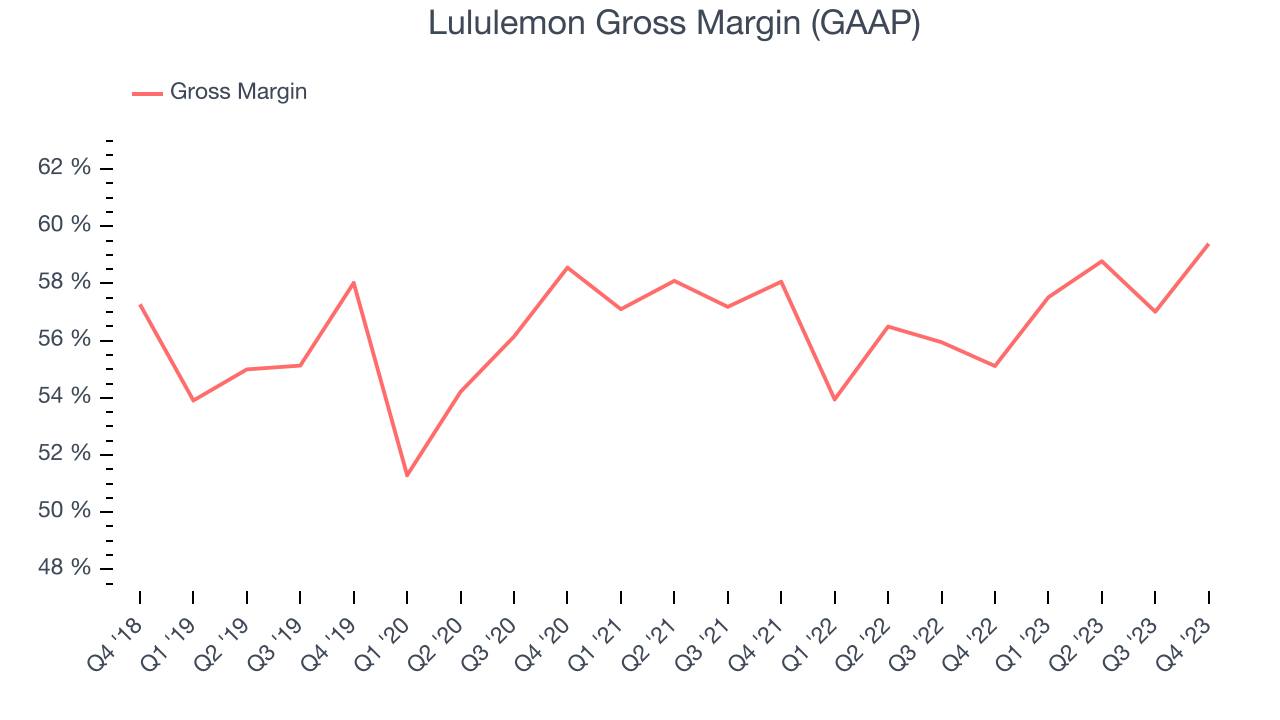
Lululemon's gross profit margin came in at 59.4% this quarter, marking a 4.3 percentage point increase from 55.1% in the same quarter last year. This margin expansion is a good sign in the near term. It shows the company increased its pricing power, and if this trend continues, it could signal a less competitive environment where it has more negotiating leverage and stable input costs (such as distribution expenses to move goods).
Operating Margin
Operating margin is a key profitability metric for retailers because it accounts for all expenses keeping the lights on, including wages, rent, advertising, and other administrative costs.
In Q4, Lululemon generated an operating profit margin of 28.5%, up 17.2 percentage points year on year. This increase was encouraging, and we can infer Lululemon was more disciplined with its expenses or gained leverage on fixed costs because its operating margin expanded more than its gross margin.
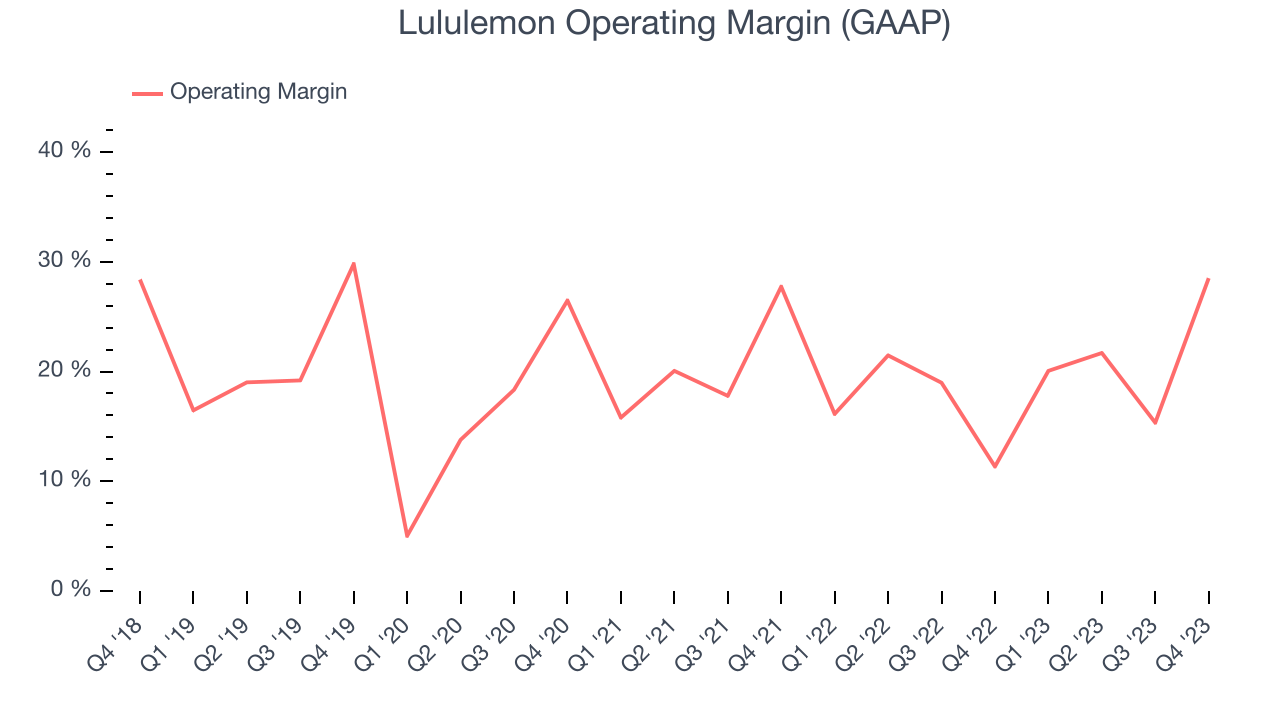 Zooming out, Lululemon has been a well-managed company over the last two years. It's demonstrated elite profitability for a consumer retail business, boasting an average operating margin of 19.5%. On top of that, its margin has improved by 5.8 percentage points year on year (on average), an extremely encouraging sign for shareholders.
 EPS
These days, some companies issue new shares like there's no tomorrow. That's why we like to track earnings per share (EPS) because it accounts for shareholder dilution and share buybacks.
In Q4, Lululemon reported EPS at $5.29, up from $0.94 in the same quarter a year ago. This print beat Wall Street's estimates by 5.1%.
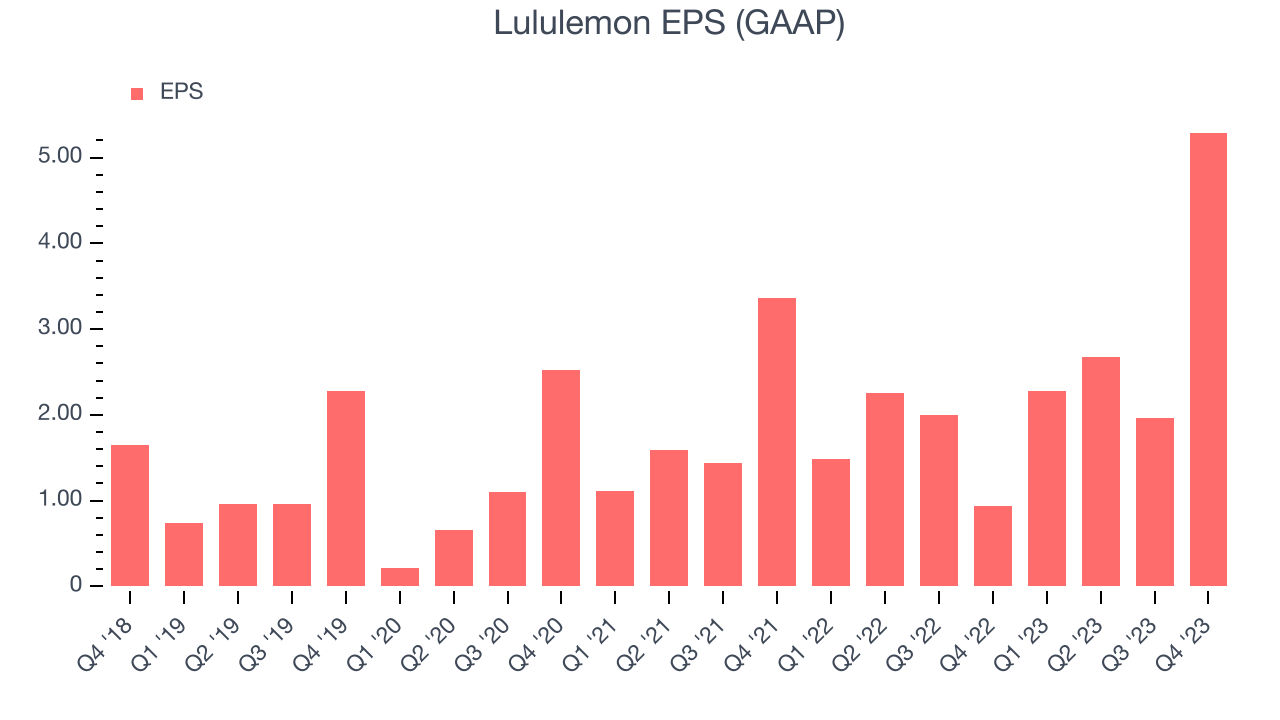
Between FY2019 and FY2023, Lululemon's adjusted diluted EPS grew 147%, translating into a solid 25.4% compounded annual growth rate. If it can maintain this rate of growth, Lululemon will more than triple its EPS in the next five years.
Wall Street expects the company to continue growing earnings over the next 12 months, with analysts projecting an average 18.4% year-on-year increase in EPS.
Cash Is King
Although earnings are undoubtedly valuable for assessing company performance, we believe cash is king because you can't use accounting profits to pay the bills.
Lululemon's free cash flow came in at $1.18 billion in Q4, up 40.3% year on year. This result represents a 36.7% margin.
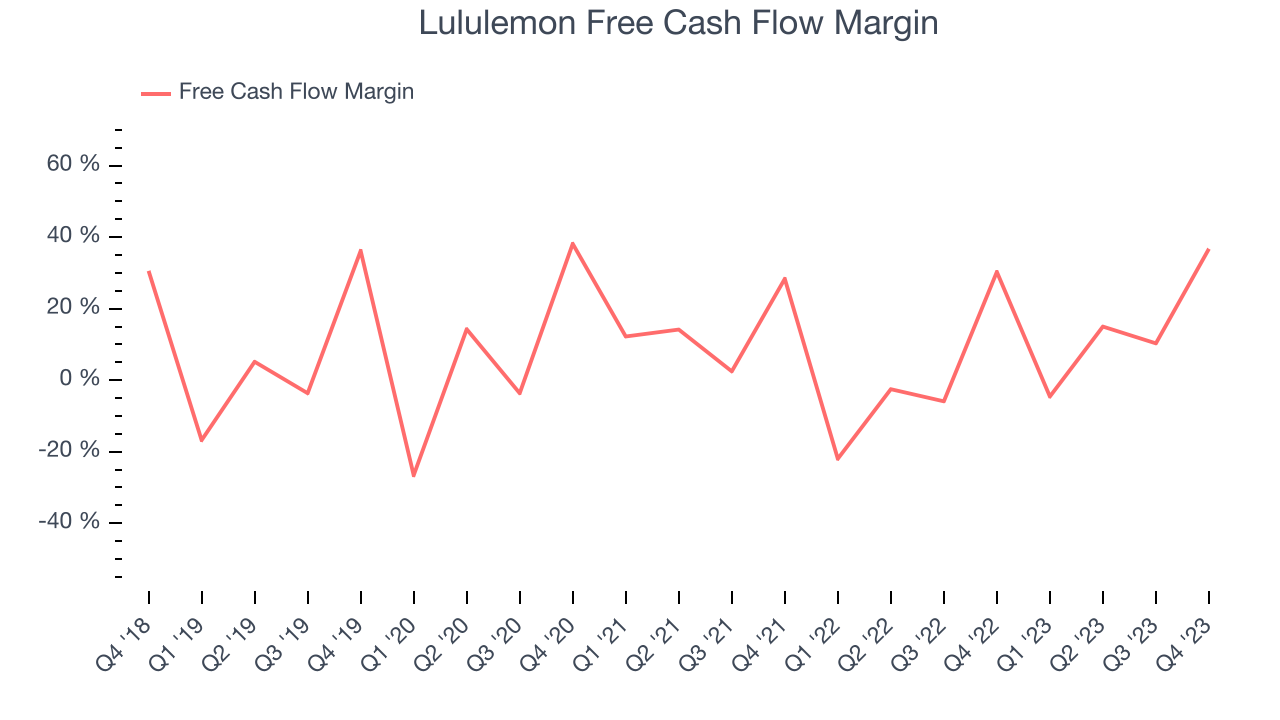
Over the last eight quarters, Lululemon has shown terrific cash profitability, enabling it to reinvest, return capital to investors, and stay ahead of the competition while maintaining a robust cash balance. The company's free cash flow margin has been among the best in consumer retail, averaging 11.1%. Furthermore, its margin has averaged year-on-year increases of 13.1 percentage points. Shareholders should be excited as this will certainly help Lululemon achieve its long-term strategic goals.
Return on Invested Capital (ROIC)
EPS and free cash flow tell us whether a company was profitable while growing revenue. But was it capital-efficient? Enter ROIC, a metric showing how much operating profit a company generates relative to how much money the business raised (debt and equity).
Lululemon's five-year average ROIC was 48.3%, placing it among the best retail companies. Just as you’d like your investment dollars to generate returns, Lululemon's invested capital has produced excellent profits.
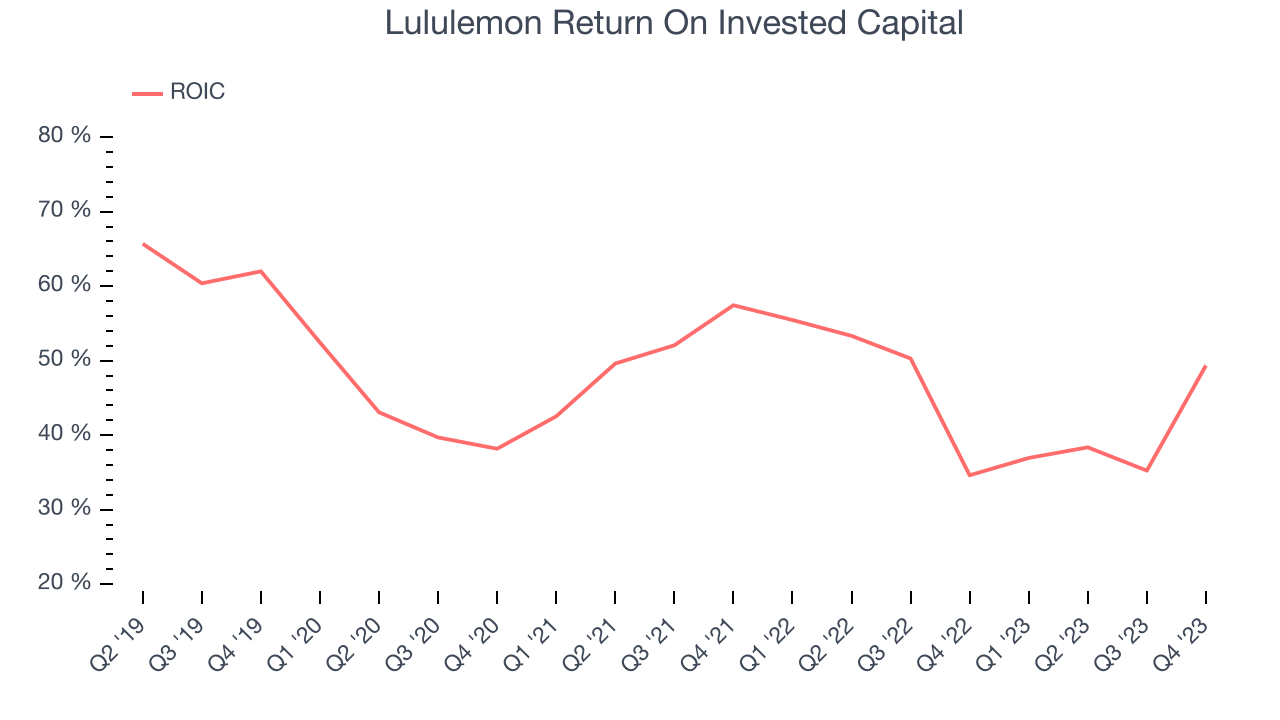
The trend in its ROIC, however, is often what surprises the market and drives the stock price. Unfortunately, Lululemon's ROIC averaged 8.1 percentage point decreases over the last few years. The company has historically shown the ability to generate good returns, but they have gone the wrong way recently, making us a bit conscious.
Balance Sheet Risk
As long-term investors, the risk we care most about is the permanent loss of capital. This can happen when a company goes bankrupt or raises money from a disadvantaged position and is separate from short-term stock price volatility, which we are much less bothered by.
Lululemon is a profitable, well-capitalized company with $2.24 billion of cash and $1.40 billion of debt, meaning it could pay back all its debt tomorrow and still have $840.7 million of cash on its balance sheet. This net cash position gives Lululemon the freedom to raise more debt, return capital to shareholders, or invest in growth initiatives.
Key Takeaways from Lululemon's Q4 Results
It was encouraging to see Lululemon slightly top analysts' revenue and EPS expectations this quarter. The company's growth was driven by a 12% increase in its same-store sales, with American stores growing 7% and international stores growing 44% on a constant currency basis. Despite the beats, its full-year revenue and earnings guidance fell short of Wall Street's estimates, causing the stock to drop. The company was down 8.8% on the results and traded at $437 per share. Today, the stock is at $342.
Is Now The Time?
Lululemon may have had a tough quarter, but investors should also consider its valuation and business qualities when assessing the investment opportunity.
There are numerous reasons why we think Lululemon is one of the best consumer companies out there. For starters, its revenue growth has been exceptional over the last four years. On top of that, its new store openings have increased its brand equity, and its impressive gross margins are a wonderful starting point for the overall profitability of the business.
Lululemon's price-to-earnings ratio based on the next 12 months is 23.6x. Looking at the consumer landscape today, Lululemon's qualities really stand out and we like it at this price.
Wall Street analysts covering the company had a one-year price target of $505.55 per share right before these results (compared to the current share price of $342.00), implying they saw upside in buying Lululemon in the short term.
To get the best start with StockStory, check out our most recent stock picks, and then sign up to our earnings alerts by adding companies to your watchlist here. We typically have the quarterly earnings results analyzed within seconds of the data being released, and especially for companies reporting pre-market, this often gives investors the chance to react to the results before the market has fully absorbed the information.