
Ride sharing service Lyft (NASDAQ: LYFT) reported results ahead of analysts' expectations in Q1 CY2024, with revenue up 27.7% year on year to $1.28 billion. It made a GAAP loss of $0.08 per share, improving from its loss of $0.50 per share in the same quarter last year.
Lyft (LYFT) Q1 CY2024 Highlights:
- Revenue: $1.28 billion vs analyst estimates of $1.16 billion (10.2% beat)
- Gross Bookings: $3.69 billion vs analyst estimates of $3.59 billion (2.9% beat)
- EPS: -$0.08 vs analyst estimates of -$0.16 (48.5% beat)
- Gross Margin (GAAP): 40.9%, up from 36.7% in the same quarter last year
- Free Cash Flow of $127.1 million, up from $14.94 million in the previous quarter
- Active Riders: 21.9 million, up 2.35 million year on year
- Market Capitalization: $7.06 billion
Founded by Logan Green and John Zimmer as a long-distance intercity carpooling company Zimride, Lyft (NASDAQ: LYFT) operates a ridesharing network in the US and Canada.
Uber created the first ride hailing app, allowing users to summon black limousines via their mobile devices, an innovation that disrupted modern transportation. Lyft followed and expanded the service to the mass market, positioning it as a casual, friendly carpool experience that aimed to appeal to younger generations. Initially, Lyft’s drivers had a pink mustache affixed to the grill of their car, which has since been replaced by an “Amp” device, which lights up the car’s dashboard to help riders easily find their car.
The company’s value propositions are multiple. For individuals, Lyft effectively lowered the cost per mile for taxi transportation vs. legacy cabs, while providing ease of use and convenience. For drivers, it has provided flexible earning opportunities.
Gig Economy
The iPhone changed the world, ushering in the era of the “always-on” internet and “on-demand” services - anything someone could want is just a few taps away. Likewise, the gig economy sprang up in a similar fashion, with a proliferation of tech-enabled freelance labor marketplaces, which work hand and hand with many on demand services. Individuals can now work on demand too. What began with tech enabled platforms that aggregated riders and drivers has expanded over the past decade to include food delivery, groceries, and now even a plumber or graphic designer are all just a few taps away.
Lyft’s (NASDAQ: LYFT) main competitor in ride hailing is Uber (NYSE:UBER).
Sales Growth
Lyft's revenue growth over the last three years has been very strong, averaging 37% annually. This quarter, Lyft beat analysts' estimates and reported solid 27.7% year-on-year revenue growth.
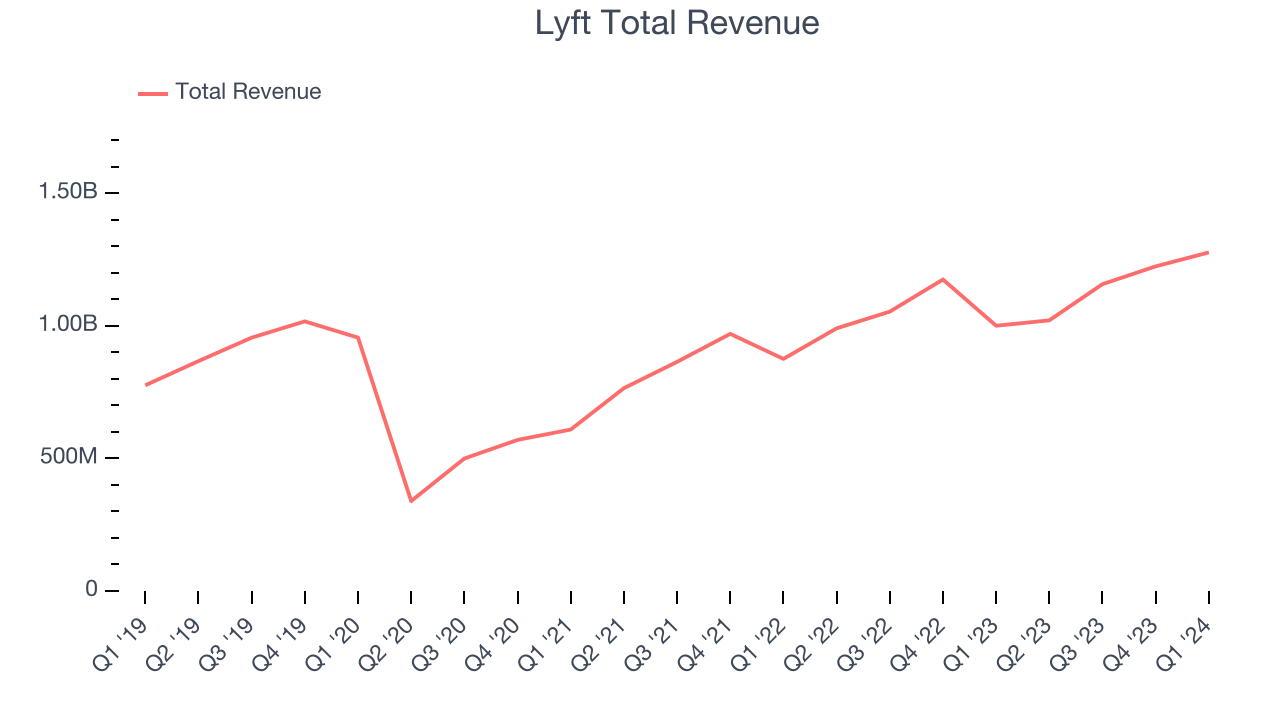
Ahead of the earnings results, analysts were projecting sales to grow 14% over the next 12 months.
Usage Growth
As a gig economy marketplace, Lyft generates revenue growth by expanding the number of services on its platform (e.g. rides, deliveries, freelance jobs) and raising the commission fee from each service provided.
Over the last two years, Lyft's users, a key performance metric for the company, grew 10.3% annually to 21.9 million. This is decent growth for a consumer internet company.
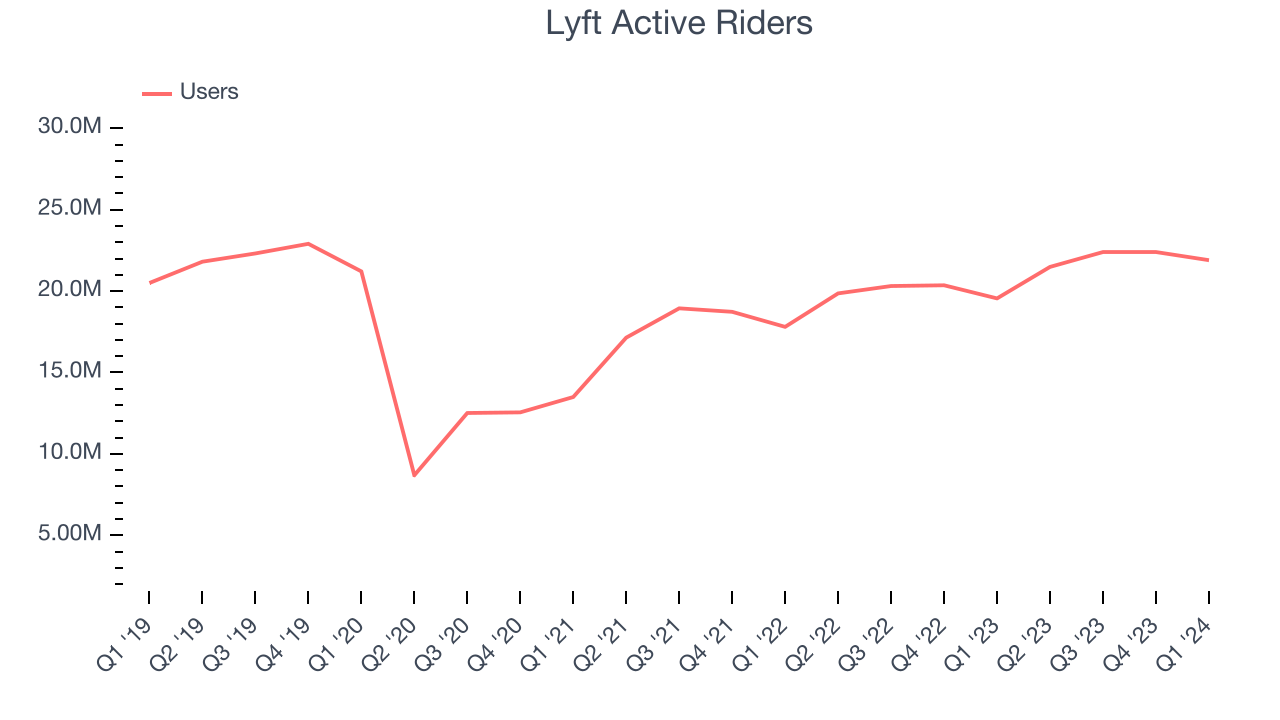
In Q1, Lyft added 2.35 million users, translating into 12% year-on-year growth.
Revenue Per User
Average revenue per user (ARPU) is a critical metric to track for consumer internet businesses like Lyft because it measures how much the company earns in transaction fees from each user. This number also informs us about Lyft's take rate, which represents its pricing leverage over the ecosystem, or "cut" from each transaction.
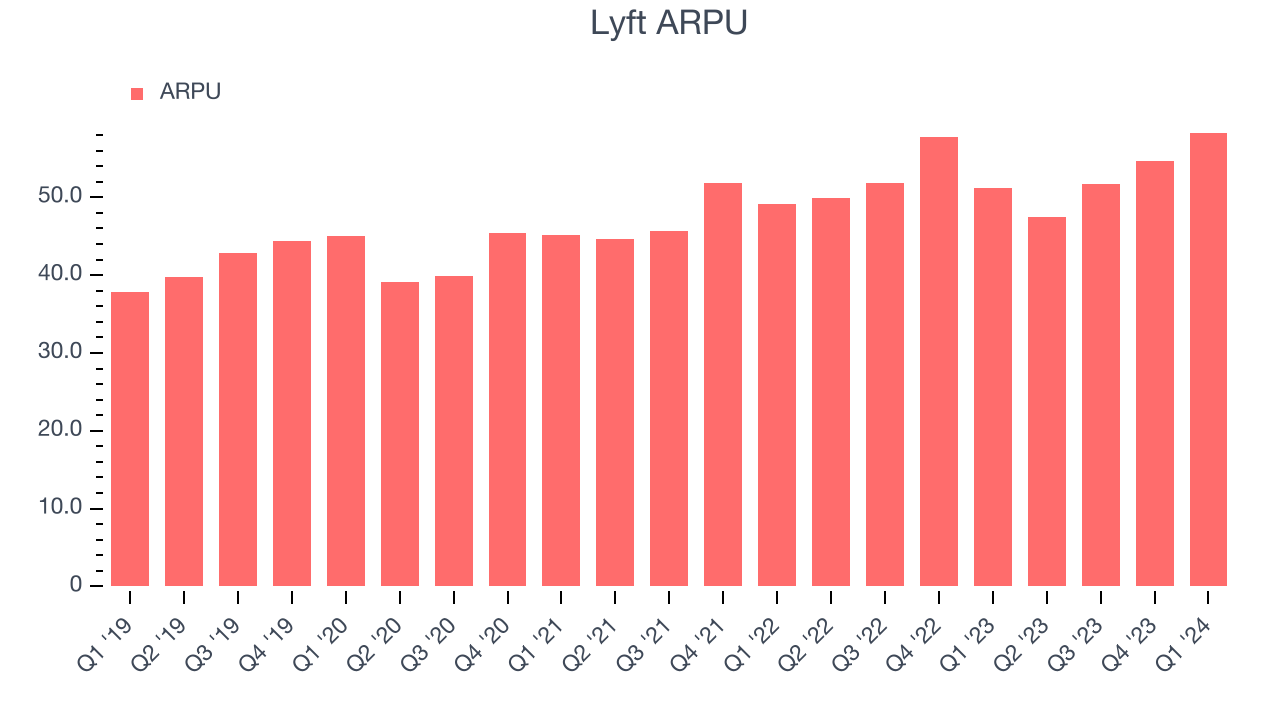
Lyft's ARPU growth has been decent over the last two years, averaging 5.6%. The company's ability to increase prices while growing its users demonstrates the value of its platform. This quarter, ARPU grew 14% year on year to $58.32 per user.
Pricing Power
A company's gross profit margin has a major impact on its ability to exert pricing power, develop new products, and invest in marketing. These factors may ultimately determine the winner in a competitive market, making it a critical metric to track for the long-term investor.
Lyft's gross profit margin, which tells us how much money the company gets to keep after covering the base cost of its products and services, came in at 40.9% this quarter, up 4.2 percentage points year on year.
For gig economy businesses like Lyft, these aforementioned costs typically include server hosting, customer support, and payment processing fees. Another cost of revenue could also be insurance to protect against liabilities arising from providing transportation, housing, or freelance work services. After paying for these expenses, Lyft had $0.41 for every $1 in revenue to invest in marketing, talent, and the development of new products and services.
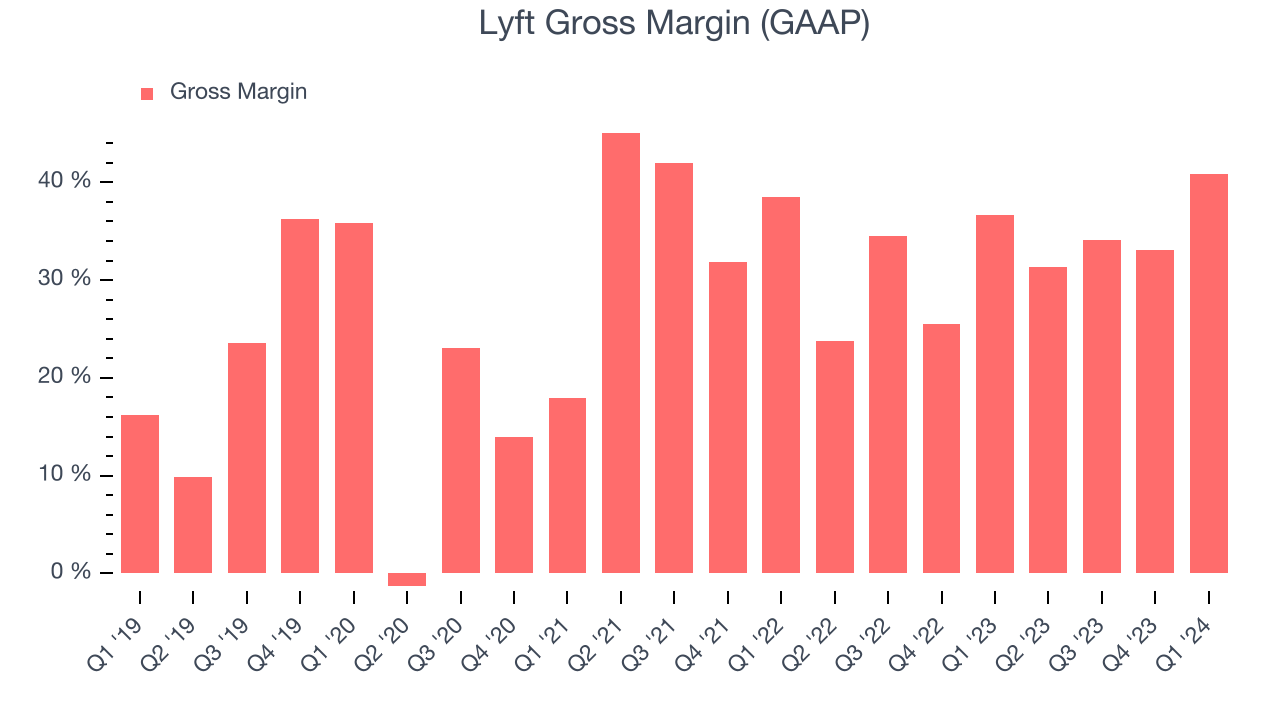
Lyft's gross margins have been trending up over the last 12 months, averaging 35.1%. This is a welcome development, as Lyft's margins are below the industry average, and rising margins could suggest improved demand and pricing power.
User Acquisition Efficiency
Unlike enterprise software that's typically sold by dedicated sales teams, consumer internet businesses like Lyft grow from a combination of product virality, paid advertisement, and incentives.
Lyft is quite efficient at acquiring new users, spending only 30.6% of its gross profit on sales and marketing expenses over the last year. This efficiency indicates that Lyft has a highly differentiated product offering, giving it the freedom to invest its resources into new growth initiatives.
Profitability & Free Cash Flow
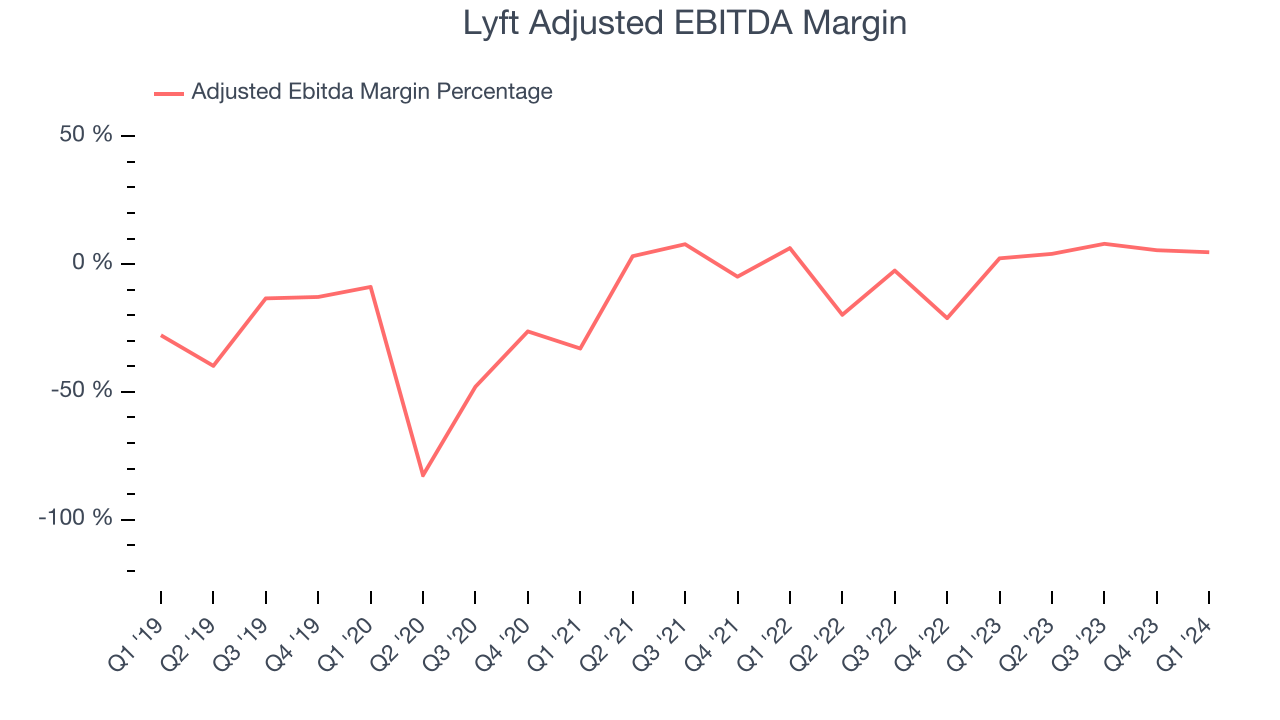
Investors frequently analyze operating income to understand a business's core profitability. Similar to operating income, adjusted EBITDA is the most common profitability metric for consumer internet companies because it removes various one-time or non-cash expenses, offering a more normalized view of a company's profit potential.
Lyft reported EBITDA of $59.4 million this quarter, resulting in a 4.7% margin. The company has also shown above-average profitability for a consumer internet business over the last four quarters, with average EBITDA margins of 5.5%.
If you've followed StockStory for a while, you know that we emphasize free cash flow. Why, you ask? We believe that in the end, cash is king, and you can't use accounting profits to pay the bills. Lyft's free cash flow came in at $127.1 million in Q1, turning positive year on year.
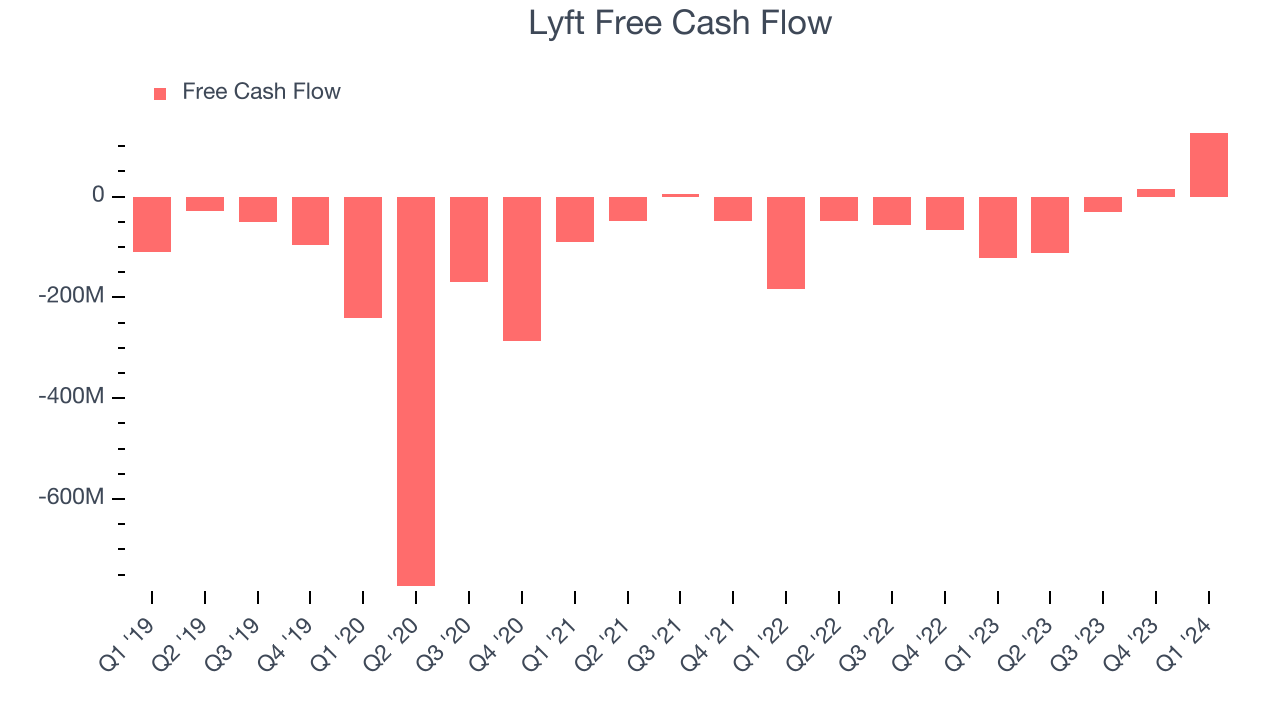
Lyft broke even from a free cash flow perspective over the last 12 months. This below-average FCF margin stems from Lyft's need to reinvest in its business to penetrate the market.
Key Takeaways from Lyft's Q1 Results
We were impressed by how significantly Lyft blew past analysts' revenue expectations this quarter as its gross bookings and number of rides conducted outperformed. We were also glad its EPS and free cash flow topped Wall Street's estimates-this was the second consecutive quarter of positive free cash flow, which is encouraging given its unprofitable history. Zooming out, we think this was an impressive quarter that should delight shareholders. The stock is up 3.4% after reporting and currently trades at $17.16 per share.
Is Now The Time?
When considering an investment in Lyft, investors should take into account its valuation and business qualities as well as what's happened in the latest quarter.
Although we have other favorites, we understand the arguments that Lyft isn't a bad business. Its revenue growth has been impressive over the last three years, and growth is expected to increase in the short term. And while its gross margins make it extremely difficult to reach positive operating profits compared to other consumer internet businesses, the good news is its user acquisition is very efficient.
At the moment, Lyft trades at 18.2x next 12 months EV-to-EBITDA. In the end, beauty is in the eye of the beholder. While Lyft wouldn't be our first pick, if you like the business, the shares are trading at a pretty interesting price right now.
Wall Street analysts covering the company had a one-year price target of $17.15 per share right before these results (compared to the current share price of $17.16).
To get the best start with StockStory check out our most recent Stock picks, and then sign up to our earnings alerts by adding companies to your watchlist here. We typically have the quarterly earnings results analyzed within seconds of the data being released, and especially for the companies reporting pre-market, this often gives investors the chance to react to the results before the market has fully absorbed the information.