
Luxury casino and resort operator Monarch (NASDAQ:MCRI) fell short of analysts' expectations in Q1 CY2024, with revenue up 4.3% year on year to $121.7 million. It made a GAAP profit of $0.93 per share, improving from its profit of $0.90 per share in the same quarter last year.
Monarch (MCRI) Q1 CY2024 Highlights:
- Revenue: $121.7 million vs analyst estimates of $122.3 million (0.5% miss)
- EPS: $0.93 vs analyst expectations of $0.96 (3.4% miss)
- No forward guidance was provided in the earnings release
- Gross Margin (GAAP): 52.5%, up from 51.5% in the same quarter last year
- Market Capitalization: $1.33 billion
Established in 1993, Monarch (NASDAQ:MCRI) operates luxury casinos and resorts, offering high-end gaming, dining, and hospitality experiences.
Monarch began its journey with the Atlantis Casino Resort Spa in Reno, Nevada. It aimed to deliver a high-quality gaming and hospitality experience, focusing on the luxury resort market. The company's destinations provide an extensive range of amenities and services beyond traditional gaming.
Monarch's properties feature modern casino gaming facilities, deluxe hotel accommodations, fine dining, spa services, and entertainment. Its resorts target both gaming enthusiasts and guests seeking a premium leisure experience.
Revenue for Monarch is primarily derived from its diverse offerings, including casino operations, hotel services, and dining and entertainment amenities. The company prioritizes luxury, quality, and complete service, appealing to customers seeking an encompassing resort experience.
Casino Operator
Casino operators enjoy limited competition because gambling is a highly regulated industry. These companies can also enjoy healthy margins and profits. Have you ever heard the phrase ‘the house always wins’? Regulation cuts both ways, however, and casinos may face stroke-of-the-pen risk that suddenly limits what they can or can't do and where they can do it. Furthermore, digitization is changing the game, pun intended. Whether it’s online poker or sports betting on your smartphone, innovation is forcing these players to adapt to changing consumer preferences, such as being able to wager anywhere on demand.
Competitors in the casino and resort industry include Boyd Gaming (NYSE:BYD), Red Rock Resorts (NASDAQ:RRR), and Golden Entertainment (NASDAQ:GDEN).Sales Growth
A company's long-term performance can indicate its business quality. Any business can enjoy short-lived success, but best-in-class ones sustain growth over many years. Monarch's annualized revenue growth rate of 15.8% over the last five years was decent for a consumer discretionary business. 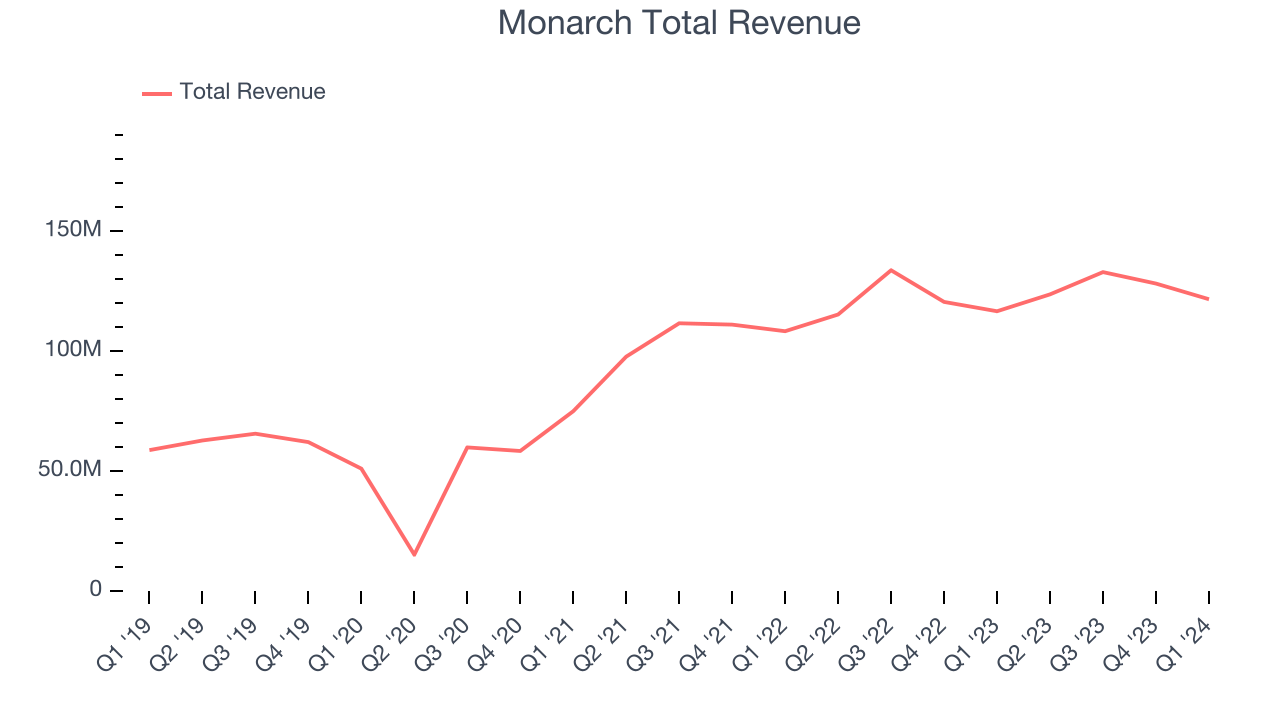 Within consumer discretionary, a long-term historical view may miss a company riding a successful new product or emerging trend. That's why we also follow short-term performance. Monarch's recent history shows the business has slowed as its annualized revenue growth of 8.7% over the last two years is below its five-year trend.
This quarter, Monarch's revenue grew 4.3% year on year to $121.7 million, falling short of Wall Street's estimates. Looking ahead, Wall Street expects sales to grow 1.8% over the next 12 months, a deceleration from this quarter.
Operating Margin
Operating margin is an important measure of profitability. It’s the portion of revenue left after accounting for all core expenses–everything from the cost of goods sold to advertising and wages. Operating margin is also useful for comparing profitability across companies with different levels of debt and tax rates because it excludes interest and taxes.
Monarch has been a well-oiled machine over the last two years. It's demonstrated elite profitability for a consumer discretionary business, boasting an average operating margin of 22.6%.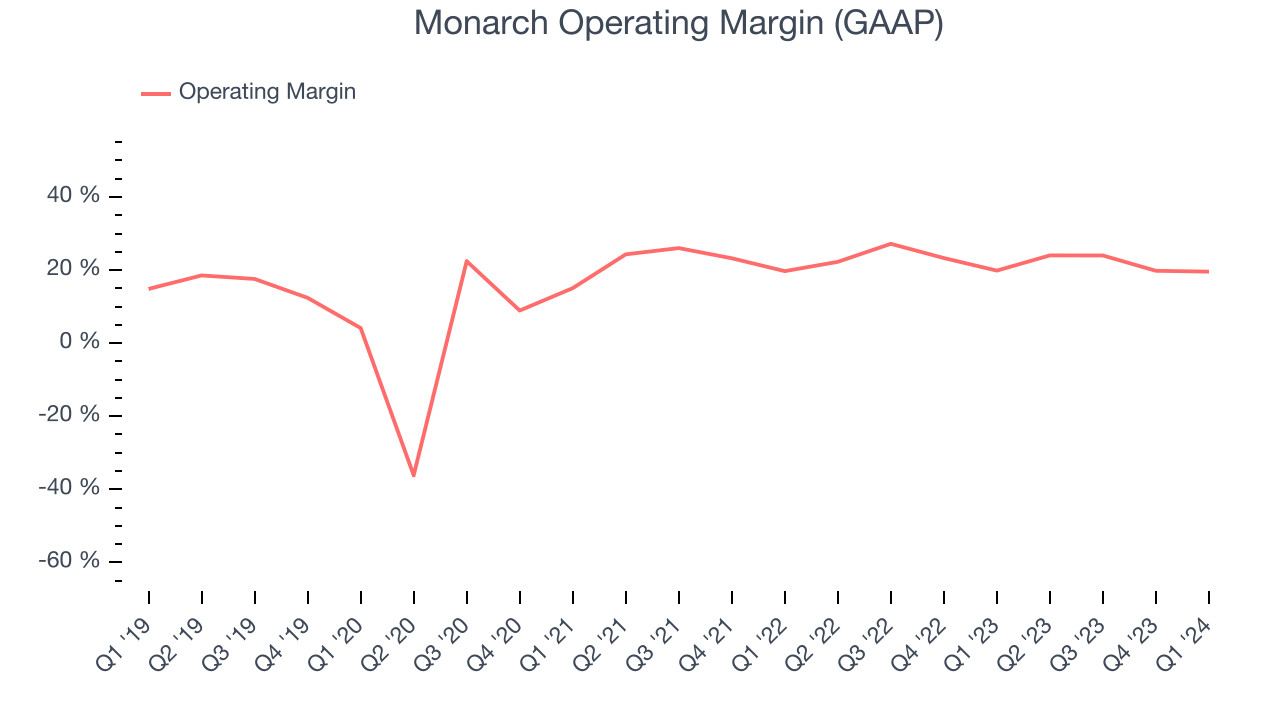
This quarter, Monarch generated an operating profit margin of 19.6%, in line with the same quarter last year. This indicates the company's costs have been relatively stable.
Over the next 12 months, Wall Street expects Monarch to maintain its LTM operating margin of 21.9%.EPS
Analyzing long-term revenue trends tells us about a company's historical growth, but the long-term change in its earnings per share (EPS) points to the profitability and efficiency of that growth–for example, a company could inflate its sales through excessive spending on advertising and promotions. 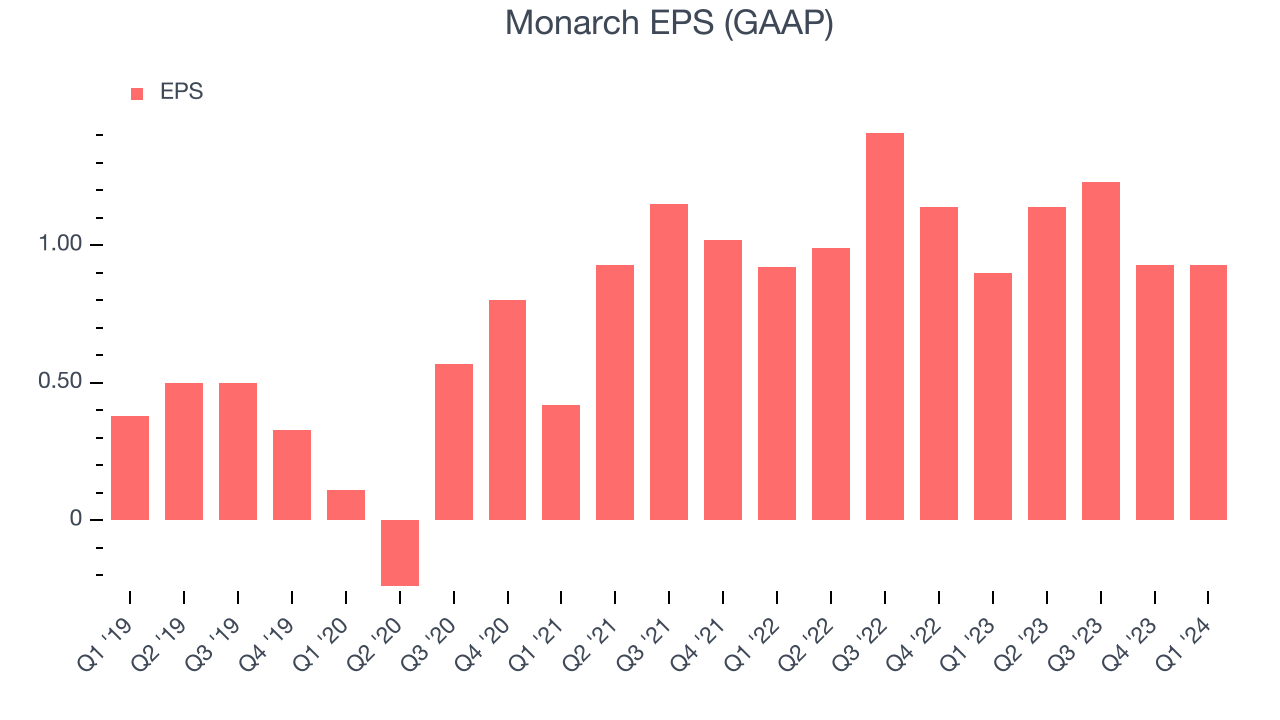
Over the last five years, Monarch's EPS grew 129%, translating into a remarkable 18% compounded annual growth rate. This performance is higher than its 15.8% annualized revenue growth over the same period. There are a few reasons for this, and understanding why can shed light on its fundamentals.
While we mentioned earlier that Monarch's operating margin was flat this quarter, a five-year view shows its margin has expanded 4.7 percentage points, leading to higher profitability and earnings. Taxes and interest expenses can also affect EPS growth, but they don't tell us as much about a company's fundamentals.In Q1, Monarch reported EPS at $0.93, up from $0.90 in the same quarter last year. Despite growing year on year, this print unfortunately missed analysts' estimates, but we care more about long-term EPS growth rather than short-term movements. Over the next 12 months, Wall Street expects Monarch to grow its earnings. Analysts are projecting its LTM EPS of $4.23 to climb by 5.5% to $4.46.
Return on Invested Capital (ROIC)
EPS and free cash flow tell us whether a company was profitable while growing revenue. But was it capital-efficient? A company’s ROIC explains this by showing how much operating profit a company makes compared to how much money the business raised (debt and equity).
Monarch's five-year average return on invested capital was 12.9%, somewhat low compared to the best consumer discretionary companies that pump out 25%+. Its returns suggest it historically did a subpar job investing in profitable business initiatives.
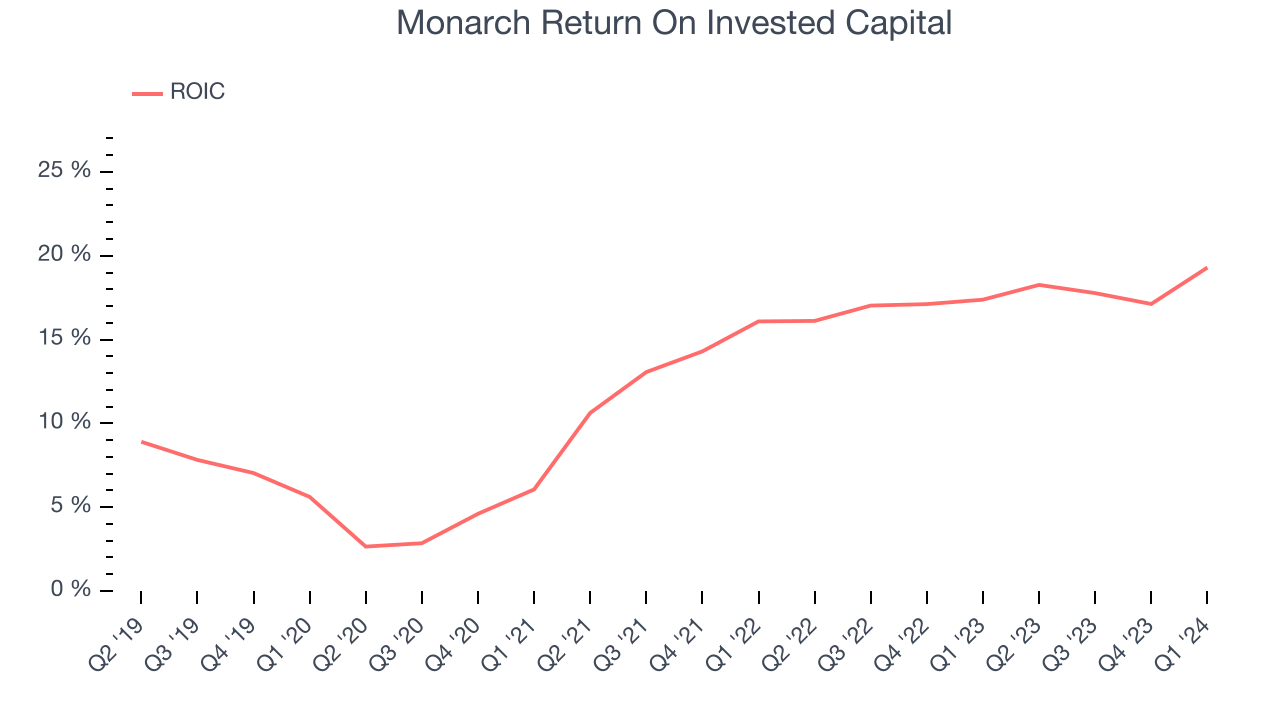
The trend in its ROIC, however, is often what surprises the market and drives the stock price. Over the last few years, Monarch's ROIC averaged 12.5 percentage point increases. This is a good sign, and if the company's returns keep rising, there's a chance it could evolve into an investable business.
Balance Sheet Risk
As long-term investors, the risk we care most about is the permanent loss of capital. This can happen when a company goes bankrupt or raises money from a disadvantaged position and is separate from short-term stock price volatility, which we are much less bothered by.
Monarch is a well-capitalized company with $39.48 million of cash and $20.2 million of debt, meaning it could pay back all its debt tomorrow and still have $19.29 million of cash on its balance sheet. This net cash position gives Monarch the freedom to raise more debt, return capital to shareholders, or invest in growth initiatives.
Key Takeaways from Monarch's Q1 Results
We struggled to find many strong positives in these results. Its EPS missed and its revenue fell short of Wall Street's estimates. Overall, this was a mediocre quarter for Monarch. The company is down 1.4% on the results and currently trades at $68.47 per share.
Is Now The Time?
Monarch may have had a tough quarter, but investors should also consider its valuation and business qualities when assessing the investment opportunity.
We have other favorites, but we understand the arguments that Monarch isn't a bad business. First off, its revenue growth has been decent over the last five years. And while its projected EPS for the next year is lacking, its powerful free cash flow generation enables it to stay ahead of the competition through consistent reinvestment of profits.
There are things to like about Monarch and there's no doubt it's a bit of a market darling, at least for some investors. But it seems there's a lot of optimism already priced in and we wonder if there are better opportunities elsewhere right now.
Wall Street analysts covering the company had a one-year price target of $72.50 per share right before these results (compared to the current share price of $68.47).
To get the best start with StockStory, check out our most recent stock picks, and then sign up for our earnings alerts by adding companies to your watchlist here. We typically have the quarterly earnings results analyzed within seconds of the data being released, and especially for companies reporting pre-market, this often gives investors the chance to react to the results before the market has fully absorbed the information.