Manufacturing company Nordson (NASDAQGS:NDSN) reported results in line with analysts’ expectations in Q2 CY2024, with revenue up 2% year on year to $661.6 million. The company’s outlook for the full year was also close to analysts’ estimates with revenue guided to $2.69 billion at the midpoint. It made a non-GAAP profit of $2.41 per share, down from its profit of $2.54 per share in the same quarter last year.
Is now the time to buy Nordson? Find out by accessing our full research report, it’s free.
Nordson (NDSN) Q2 CY2024 Highlights:
- Revenue: $661.6 million vs analyst estimates of $656.6 million (small beat)
- EPS (non-GAAP): $2.41 vs analyst estimates of $2.34 (3.1% beat)
- EPS (non-GAAP) guidance for the full year is $9.55 at the midpoint, roughly in line with what analysts were expecting
- Gross Margin (GAAP): 55.8%, in line with the same quarter last year
- EBITDA Margin: 31.5%, in line with the same quarter last year
- Free Cash Flow Margin: 21.6%, down from 27.9% in the same quarter last year
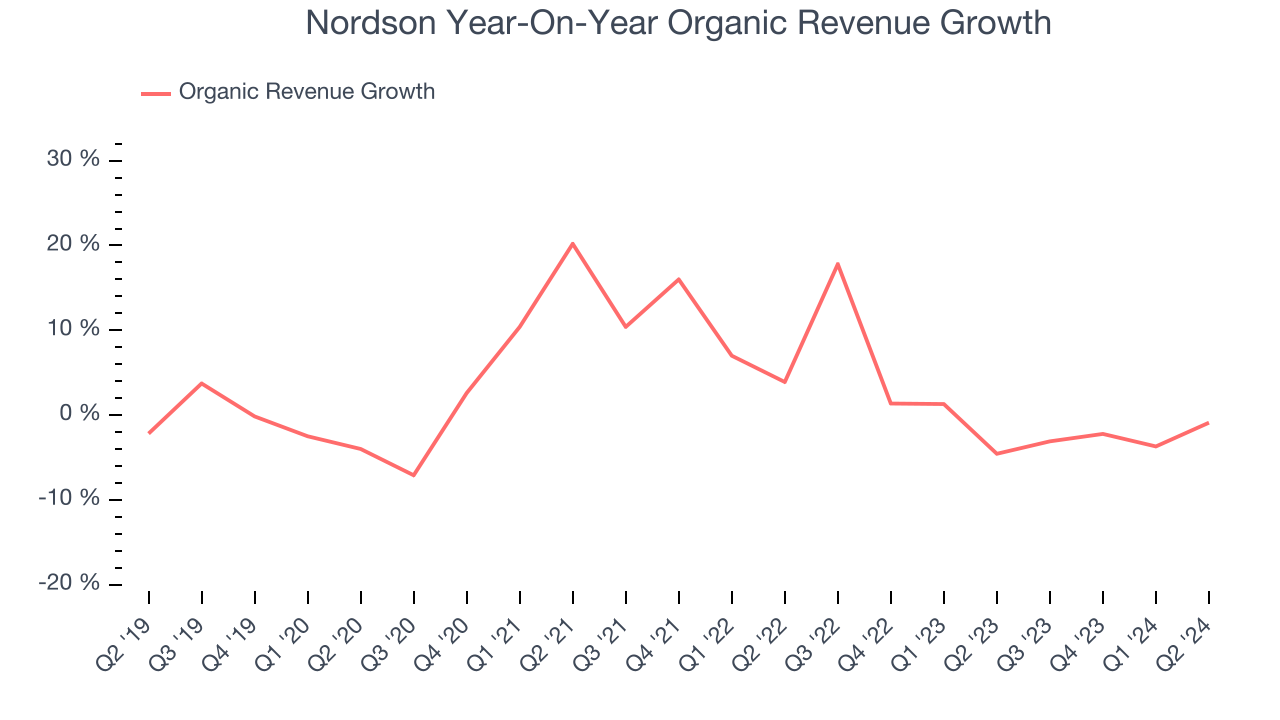
- Organic Revenue was flat year on year (-4.6% in the same quarter last year)
- Market Capitalization: $13.71 billion
Commenting on the Company’s fiscal 2024 third quarter results, Nordson President and Chief Executive Officer Sundaram Nagarajan said, “We delivered third quarter revenue in line with our expectations, driven by strong organic growth in our industrial product lines. Our Advanced Technology Solutions segment sequentially grew compared to second quarter, as order entry steadily improves in electronics end markets. Across the company, the teams executed another solid operating performance delivering strong gross margins and 31% EBITDA margin. Overall, I am pleased with our focus on the customer while managing profitability well against headwinds in select businesses.”
Founded in 1954, Nordson Corporation (NASDAQ:NDSN) manufactures dispensing equipment and industrial adhesives, sealants and coatings.
Professional Tools and Equipment
Automation that increases efficiency and connected equipment that collects analyzable data have been trending, creating new demand. Some professional tools and equipment companies also provide software to accompany measurement or automated machinery, adding a stream of recurring revenues to their businesses. On the other hand, professional tools and equipment companies are at the whim of economic cycles. Consumer spending and interest rates, for example, can greatly impact the industrial production that drives demand for these companies’ offerings.
Sales Growth
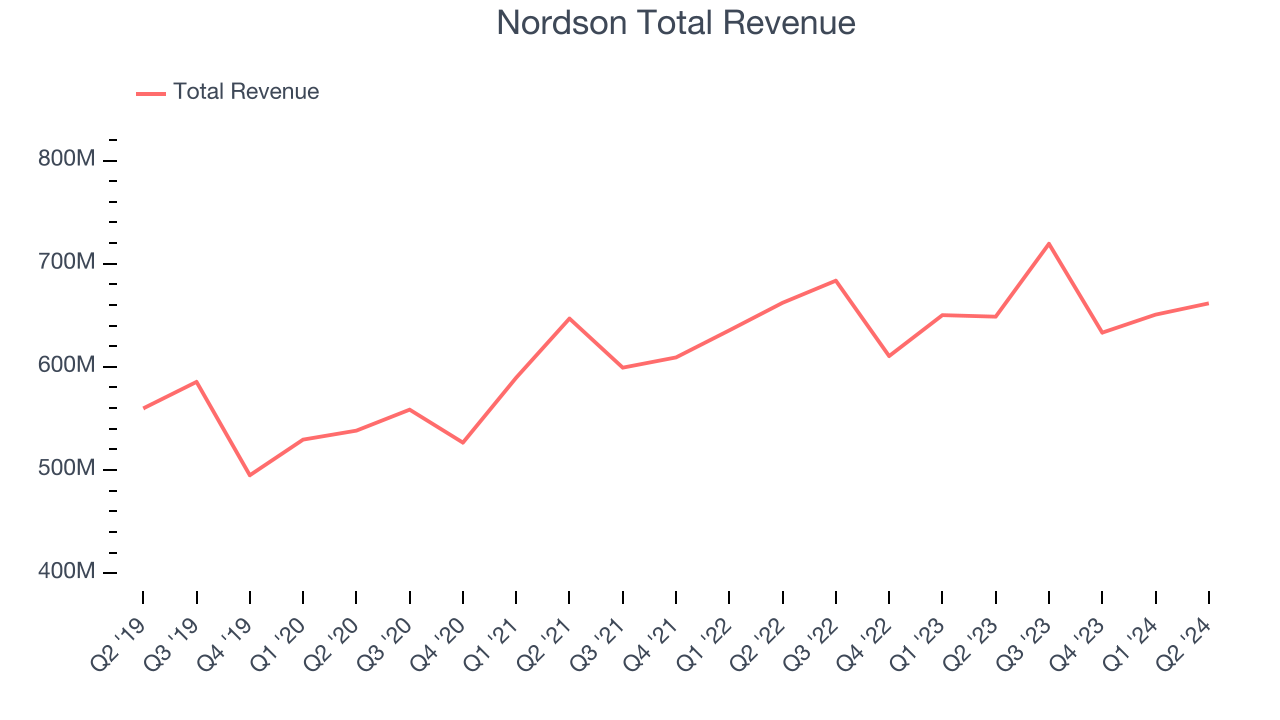
Reviewing a company’s long-term performance can reveal insights into its business quality. Any business can have short-term success, but a top-tier one tends to sustain growth for years. Unfortunately, Nordson’s 4.1% annualized revenue growth over the last five years was sluggish. This shows it failed to expand in any major way and is a rough starting point for our analysis. 
We at StockStory place the most emphasis on long-term growth, but within industrials, a half-decade historical view may miss cycles, industry trends, or a company capitalizing on catalysts such as a new contract win or a successful product line. Nordson’s annualized revenue growth of 3.1% over the last two years aligns with its five-year trend, suggesting its demand was consistently weak.
We can better understand the company’s sales dynamics by analyzing its organic revenue, which strips out one-time events like acquisitions and currency fluctuations because they don’t accurately reflect its fundamentals. Over the last two years, Nordson’s organic revenue was flat. Because this number is lower than its normal revenue growth, we can see that some mixture of acquisitions and foreign exchange rates boosted its headline performance. 
This quarter, Nordson grew its revenue by 2% year on year, and its $661.6 million of revenue was in line with Wall Street’s estimates. Looking ahead, Wall Street expects sales to grow 2.4% over the next 12 months.
When a company has more cash than it knows what to do with, buying back its own shares can make a lot of sense–as long as the price is right. Luckily, we’ve found one, a low-priced stock that is gushing free cash flow AND buying back shares. Click here to claim your Special Free Report on a fallen angel growth story that is already recovering from a setback.
Operating Margin
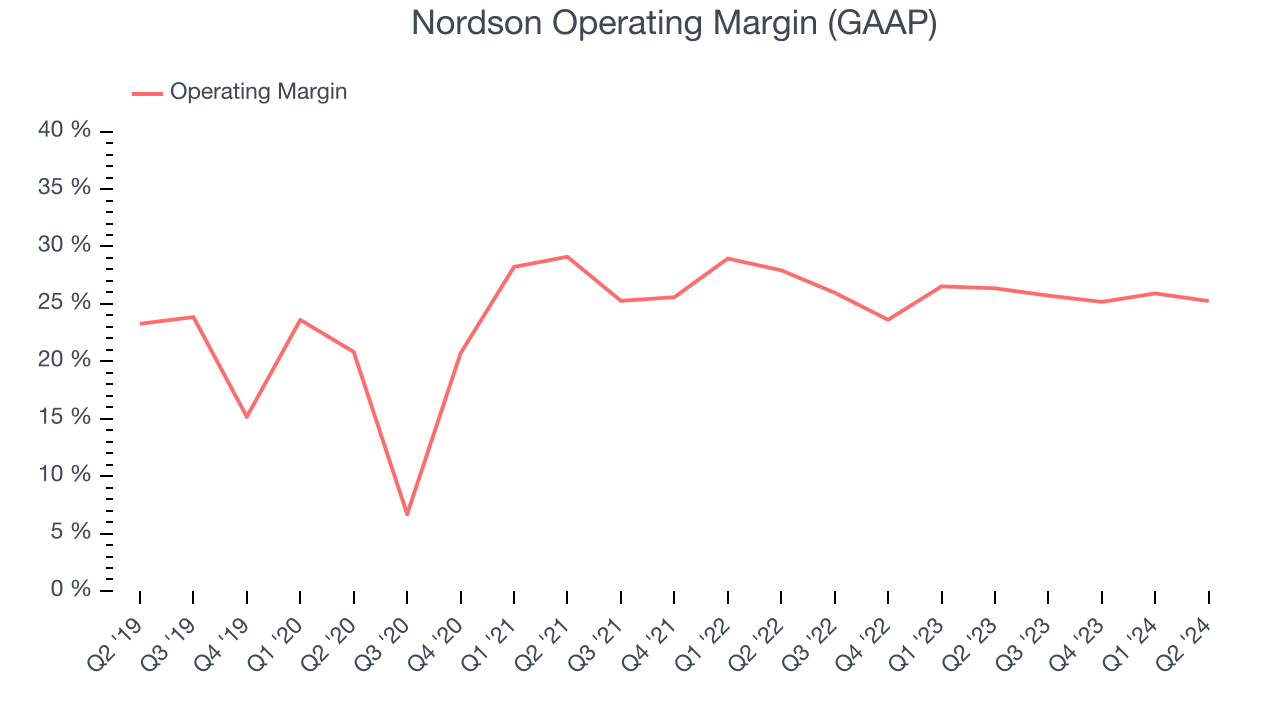
Nordson has been a well-oiled machine over the last five years. It demonstrated elite profitability for an industrials business, boasting an average operating margin of 24.3%. This result isn’t surprising as its high gross margin gives it a favorable starting point.
Analyzing the trend in its profitability, Nordson’s annual operating margin rose by 4.5 percentage points over the last five years, showing its efficiency has improved.

This quarter, Nordson generated an operating profit margin of 25.3%, down 1.1 percentage points year on year. Since Nordson’s operating margin decreased more than its gross margin, we can assume the company was recently less efficient because expenses such as sales, marketing, R&D, and administrative overhead increased.
EPS
We track the long-term growth in earnings per share (EPS) for the same reason as long-term revenue growth. Compared to revenue, however, EPS highlights whether a company’s growth was profitable.
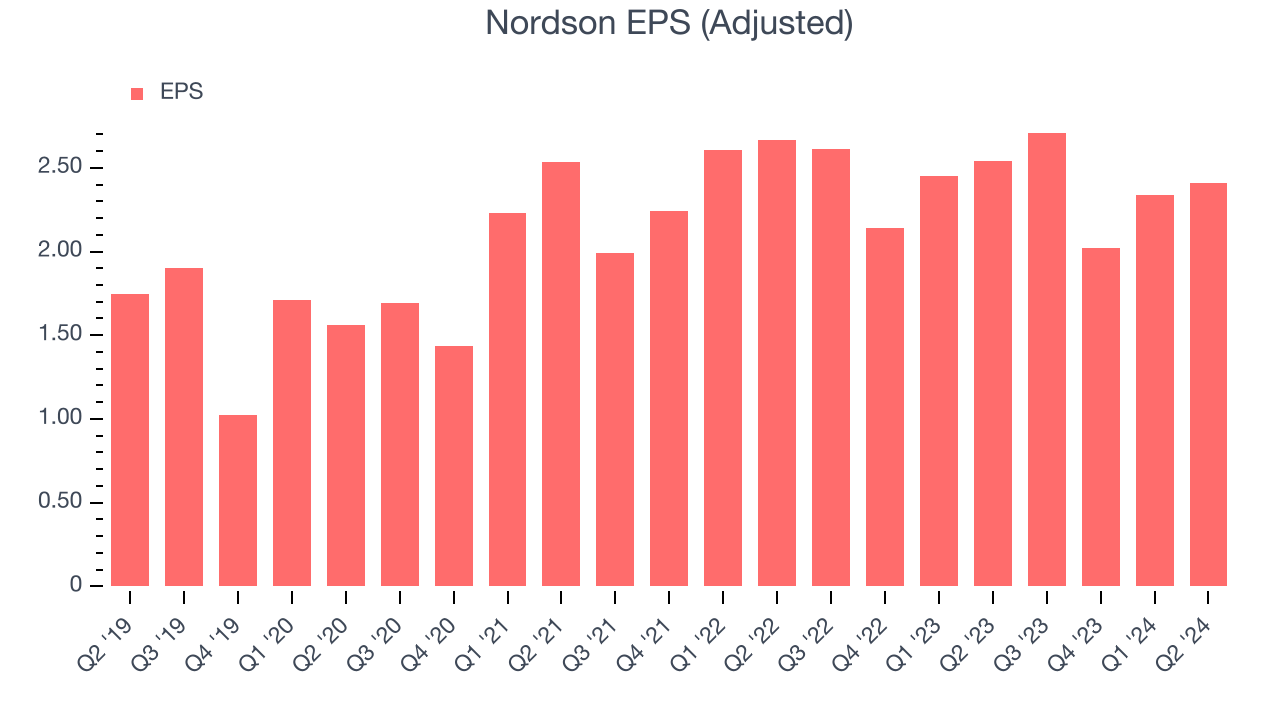
Nordson’s EPS grew at a decent 9.6% compounded annual growth rate over the last five years, higher than its 4.1% annualized revenue growth. This tells us the company became more profitable as it expanded.

Diving into Nordson’s quality of earnings can give us a better understanding of its performance. As we mentioned earlier, Nordson’s operating margin declined this quarter but expanded by 4.5 percentage points over the last five years. This was the most relevant factor (aside from the revenue impact) behind its higher earnings; taxes and interest expenses can also affect EPS but don’t tell us as much about a company’s fundamentals.
Like with revenue, we also analyze EPS over a more recent period because it can give insight into an emerging theme or development for the business. For Nordson, EPS didn’t budge over the last two years, a regression from its five-year trend. We hope it can revert to earnings growth in the coming years.
In Q2, Nordson reported EPS at $2.41, down from $2.54 in the same quarter last year. Despite falling year on year, this print beat analysts’ estimates by 3.1%. Over the next 12 months, Wall Street expects Nordson to grow its earnings. Analysts are projecting its EPS of $9.48 in the last year to climb by 6.5% to $10.10.
Key Takeaways from Nordson’s Q2 Results
We enjoyed seeing Nordson exceed analysts’ organic revenue expectations this quarter. We were also glad its revenue outperformed Wall Street’s estimates. Full year EPS guidance was in line with expectations, showing that the company is squarely on track. Overall, this quarter was solid. The stock traded up 1.2% to $251 immediately following the results.
Nordson may have had a good quarter, but does that mean you should invest right now? When making that decision, it’s important to consider its valuation, business qualities, as well as what has happened in the latest quarter. We cover that in our actionable full research report which you can read here, it’s free.
