
Real estate services firm Newmark (NASDAQ:NMRK) announced better-than-expected results in Q1 CY2024, with revenue up 4.9% year on year to $546.5 million. On the other hand, the company's full-year revenue guidance of $2.47 billion at the midpoint came in 4% below analysts' estimates. It made a non-GAAP profit of $0.15 per share, down from its profit of $40.80 per share in the same quarter last year.
Newmark (NMRK) Q1 CY2024 Highlights:
- Revenue: $546.5 million vs analyst estimates of $526.1 million (3.9% beat)
- EPS (non-GAAP): $0.15 vs analyst expectations of $0.15 (in line)
- Gross Margin (GAAP): 30.5%, up from 30.1% in the same quarter last year
- Market Capitalization: $1.72 billion
Founded in 1929, Newmark (NASDAQ:NMRK) provides commercial real estate services, including leasing advisory, global corporate services, investment sales and capital markets, property and facilities management, valuation and advisory, and consulting.
Newmark's client base encompasses tenants, owners, investors, and developers across office, retail, industrial, and multifamily properties. The company's extensive service offering enables it to cater to the entirety of its clients' commercial real estate needs, from strategic planning and market research to transaction execution and property management.
Newmark's Capital Markets group is a standout feature, providing clients with a comprehensive range of financing solutions, including equity and debt financing, loan sales, and loan servicing. This expertise in capital markets complements its advisory services, enabling clients to leverage opportunities in the dynamic real estate market effectively.
The company has a substantial global footprint with offices across North America, Europe, Asia Pacific, and the Middle East. Newmark's presence is bolstered by its strategic partnerships, extending its reach and enhancing its ability to serve clients in key markets around the world.
Real Estate Services
Technology has been a double-edged sword in real estate services. On the one hand, internet listings are effective at disseminating information far and wide, casting a wide net for buyers and sellers to increase the chances of transactions. On the other hand, digitization in the real estate market could potentially disintermediate key players like agents who use information asymmetries to their advantage.
Newmark’s primary competitors include CBRE (NYSE:CBRE), Jones Lang LaSalle (NYSE:JLL), Cushman & Wakefield (NYSE:CWK), Colliers International (NASDAQ:CIGI), and Marcus & Millichap (NYSE:MMI).Sales Growth
A company’s long-term performance can give signals about its business quality. Any business can put up a good quarter or two, but many enduring ones muster years of growth. Newmark's annualized revenue growth rate of 3.9% over the last five years was weak for a consumer discretionary business. 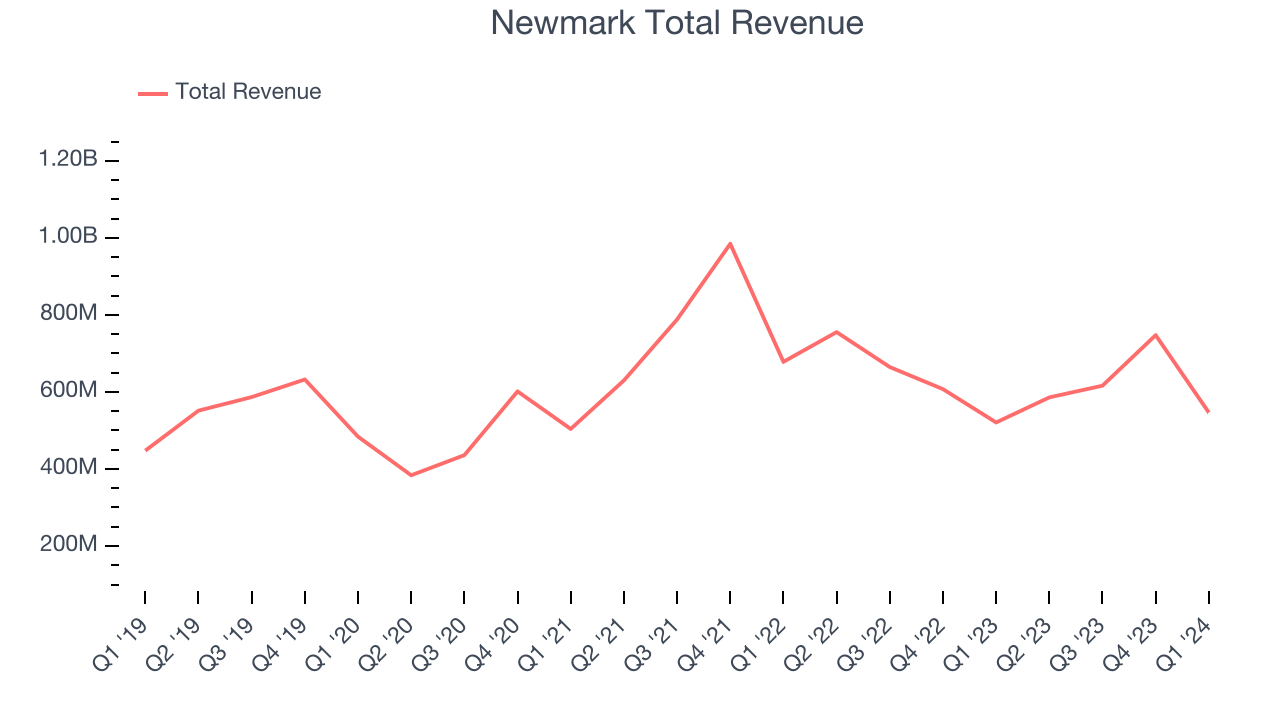 Within consumer discretionary, a long-term historical view may miss a company riding a successful new product or emerging trend. That's why we also follow short-term performance. Newmark's recent history shows a reversal from its already weak five-year trend as its revenue has shown annualized declines of 10% over the last two years.
We can dig even further into the company's revenue dynamics by analyzing its three most important segments: Management, Leasing, and Investment Sales, which are 47%, 29.1%, and 13% of revenue. Over the last two years, Newmark's Management revenue (property management) averaged 3.7% year-on-year growth while its Leasing (sourcing tenants) and Investment Sales (financial advisory) revenues averaged declines of 3.3% and 22.2%.
This quarter, Newmark reported reasonable year-on-year revenue growth of 4.9%, and its $546.5 million of revenue topped Wall Street's estimates by 3.9%. Looking ahead, Wall Street expects sales to grow 4.5% over the next 12 months, a deceleration from this quarter.
Operating Margin
Operating margin is an important measure of profitability. It’s the portion of revenue left after accounting for all core expenses–everything from the cost of goods sold to advertising and wages. Operating margin is also useful for comparing profitability across companies with different levels of debt and tax rates because it excludes interest and taxes.
Newmark was profitable over the last eight quarters but held back by its large expense base. It's demonstrated subpar profitability for a consumer discretionary business, producing an average operating margin of 5.4%.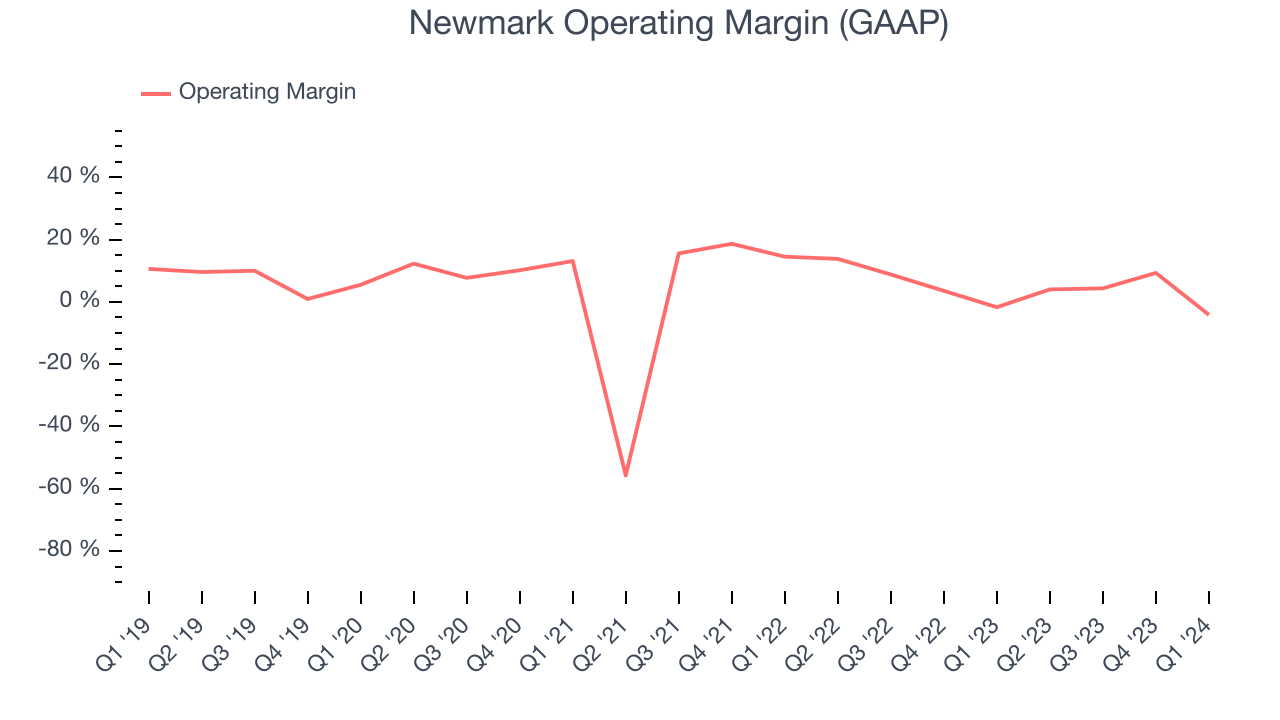
In Q1, Newmark generated an operating profit margin of negative 4.1%, down 2.4 percentage points year on year.
Over the next 12 months, Wall Street expects Newmark to become more profitable. Analysts are expecting the company’s LTM operating margin of 3.9% to rise to 14.1%.EPS
Analyzing long-term revenue trends tells us about a company's historical growth, but the long-term change in its earnings per share (EPS) points to the profitability and efficiency of that growth–for example, a company could inflate its sales through excessive spending on advertising and promotions. 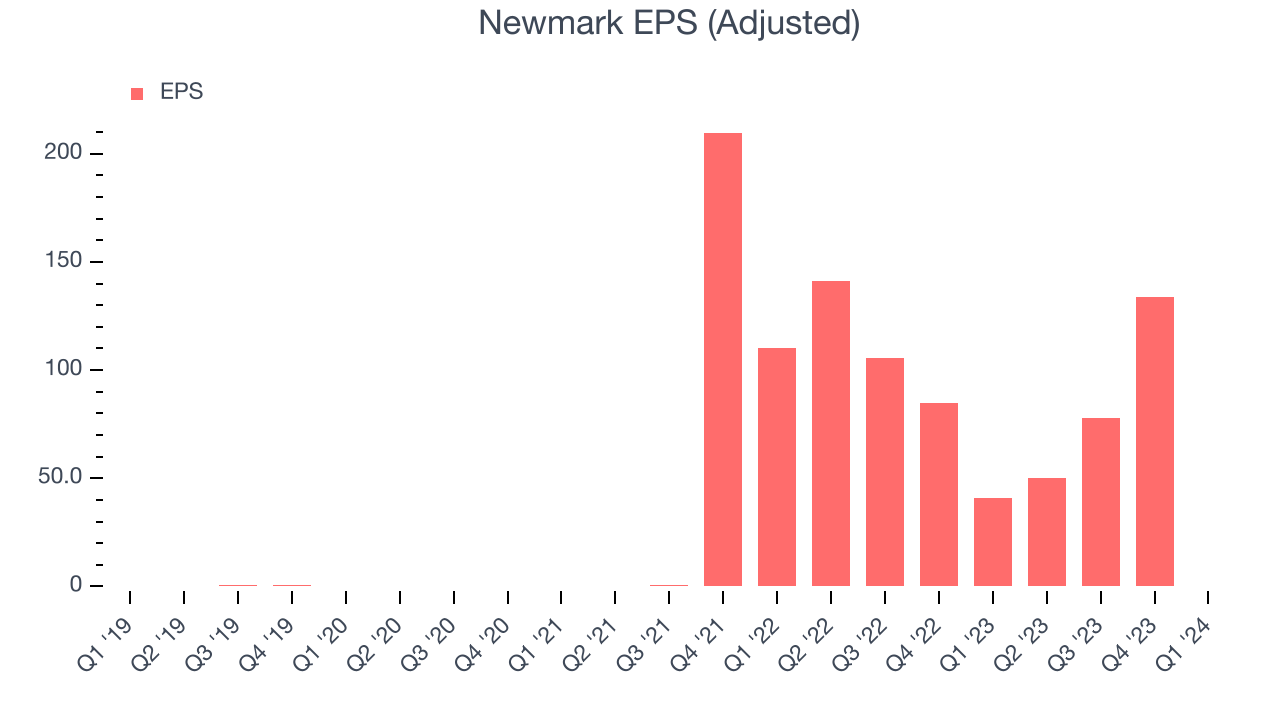
Over the last five years, Newmark's EPS grew 17,377%, translating into an astounding 181% compounded annual growth rate. This performance is materially higher than its 3.9% annualized revenue growth over the same period. Let's dig into why.
A five-year view shows that Newmark has repurchased its stock, shrinking its share count by 35%. This has led to higher per share earnings. Taxes and interest expenses can also affect EPS growth, but they don't tell us as much about a company's fundamentals.In Q1, Newmark reported EPS at $0.15, down from $40.80 in the same quarter last year. This print was close to analysts' estimates. Over the next 12 months, Wall Street expects Newmark to perform poorly. Analysts are projecting its LTM EPS of $262.15 to shrink by 99.6% to $1.10.
Return on Invested Capital (ROIC)
EPS and free cash flow tell us whether a company was profitable while growing revenue. But was it capital-efficient? Enter ROIC, a metric showing how much operating profit a company generates relative to how much money the business raised (debt and equity).
Newmark's five-year average return on invested capital was 2.4%, somewhat low compared to the best consumer discretionary companies that pump out 25%+. Its returns suggest it historically did a subpar job investing in profitable business initiatives.
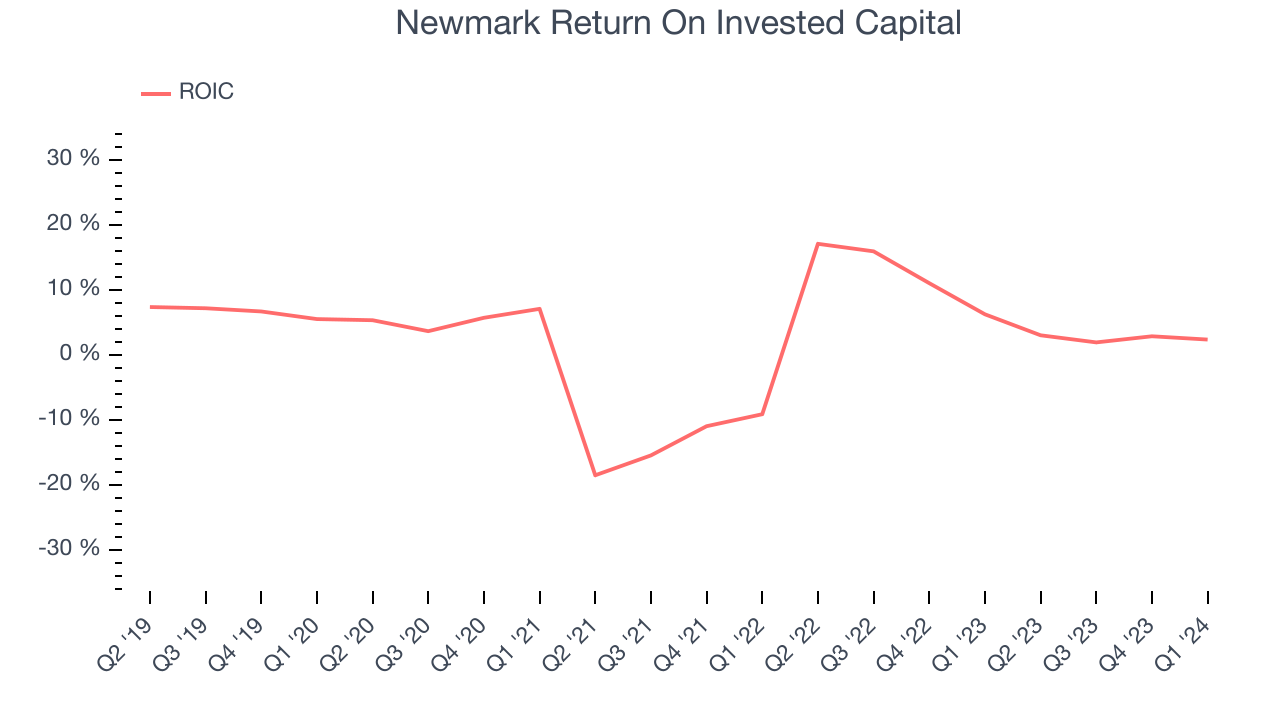
The trend in its ROIC, however, is often what surprises the market and drives the stock price. Unfortunately, Newmark's ROIC averaged 2 percentage point decreases over the last few years. Paired with its already low returns, these declines suggest the company's profitable business opportunities are few and far between.
Balance Sheet Risk
As long-term investors, the risk we care most about is the permanent loss of capital. This can happen when a company goes bankrupt or raises money from a disadvantaged position and is separate from short-term stock price volatility, which we are much less bothered by.
Newmark reported $140.9 million of cash and $670.2 million of debt on its balance sheet in the most recent quarter. As investors in high-quality companies, we primarily focus on two things: 1) that a company's debt level isn't too high and 2) that its interest payments are not excessively burdening the business.
With $398.9 million of EBITDA over the last 12 months, we view Newmark's 1.3x net-debt-to-EBITDA ratio as safe. We also see its $21.64 million of annual interest expenses as appropriate. The company's profits give it plenty of breathing room, allowing it to continue investing in new initiatives.
Key Takeaways from Newmark's Q1 Results
It was good to see Newmark beat analysts' revenue expectations this quarter. On the other hand, its full-year revenue guidance missed and its operating margin fell short of Wall Street's estimates. Overall, this was a mixed quarter for Newmark. The stock is flat after reporting and currently trades at $10.05 per share.
Is Now The Time?
Newmark may have had a tough quarter, but investors should also consider its valuation and business qualities when assessing the investment opportunity.
We cheer for all companies serving consumers, but in the case of Newmark, we'll be cheering from the sidelines. Its revenue growth has been uninspiring over the last five years, but at least growth is expected to increase in the short term. And while its EPS growth over the last five years has been fantastic, the downside is its projected EPS for the next year is lacking. On top of that, its relatively low ROIC suggests it has historically struggled to find compelling business opportunities.
Newmark's price-to-earnings ratio based on the next 12 months is 9.1x. While there are some things to like about Newmark and its valuation is reasonable, we think there are better opportunities elsewhere in the market right now.
Wall Street analysts covering the company had a one-year price target of $12.13 per share right before these results (compared to the current share price of $10.05).
To get the best start with StockStory, check out our most recent stock picks, and then sign up for our earnings alerts by adding companies to your watchlist here. We typically have the quarterly earnings results analyzed within seconds of the data being released, and especially for companies reporting pre-market, this often gives investors the chance to react to the results before the market has fully absorbed the information.