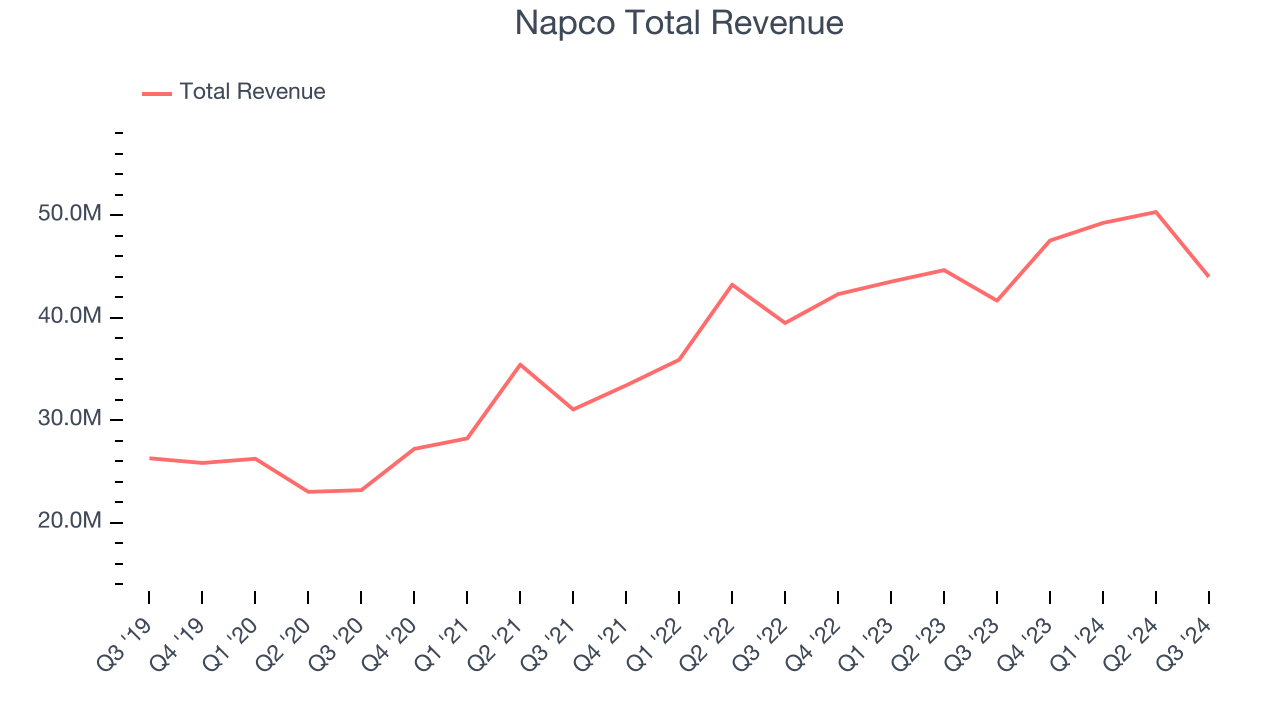
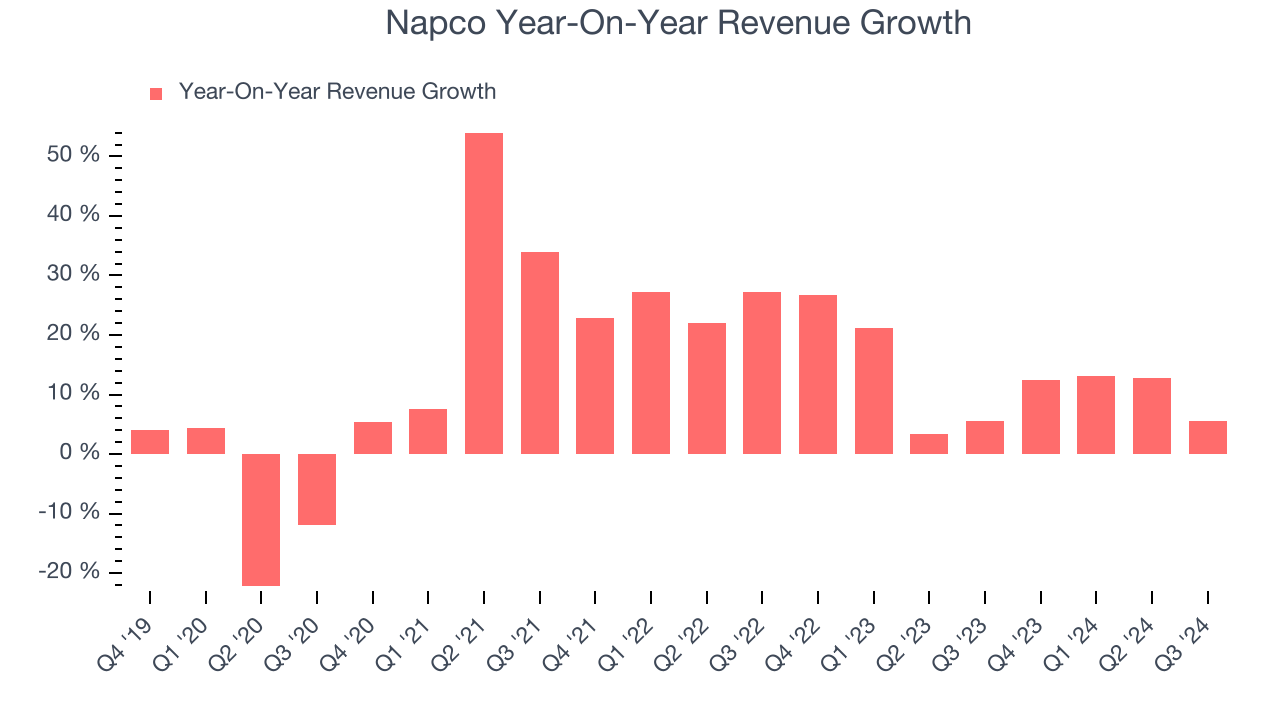
Electronic security systems manufacturer Napco Security Technologies (NASDAQ:NSSC) fell short of the market’s revenue expectations in Q3 CY2024, but sales rose 5.6% year on year to $44 million. Its GAAP profit of $0.30 per share was also 10% below analysts’ consensus estimates.
Is now the time to buy Napco? Find out by accessing our full research report, it’s free.
Napco (NSSC) Q3 CY2024 Highlights:
- Revenue: $44 million vs analyst estimates of $46.56 million (5.5% miss)
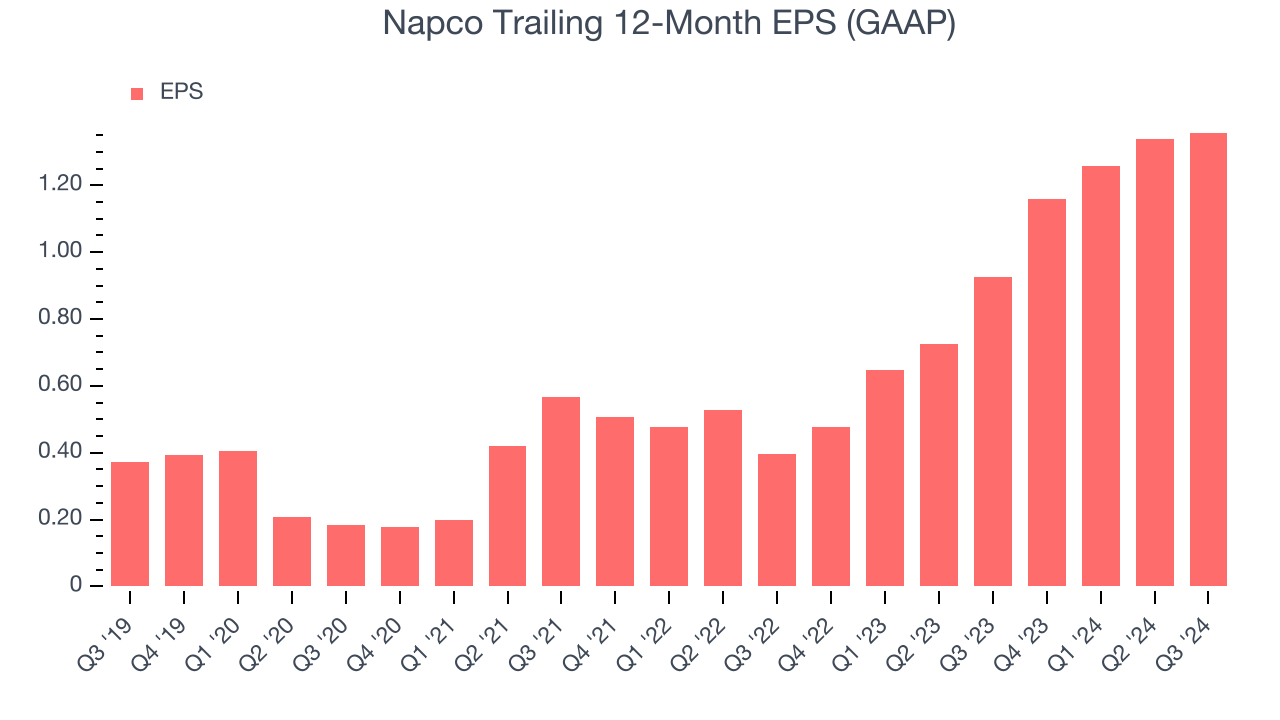
- EPS: $0.30 vs analyst expectations of $0.33 (10% miss)
- EBITDA: $12.34 million vs analyst estimates of $14.75 million (16.4% miss)
- Gross Margin (GAAP): 55.9%, up from 53.8% in the same quarter last year
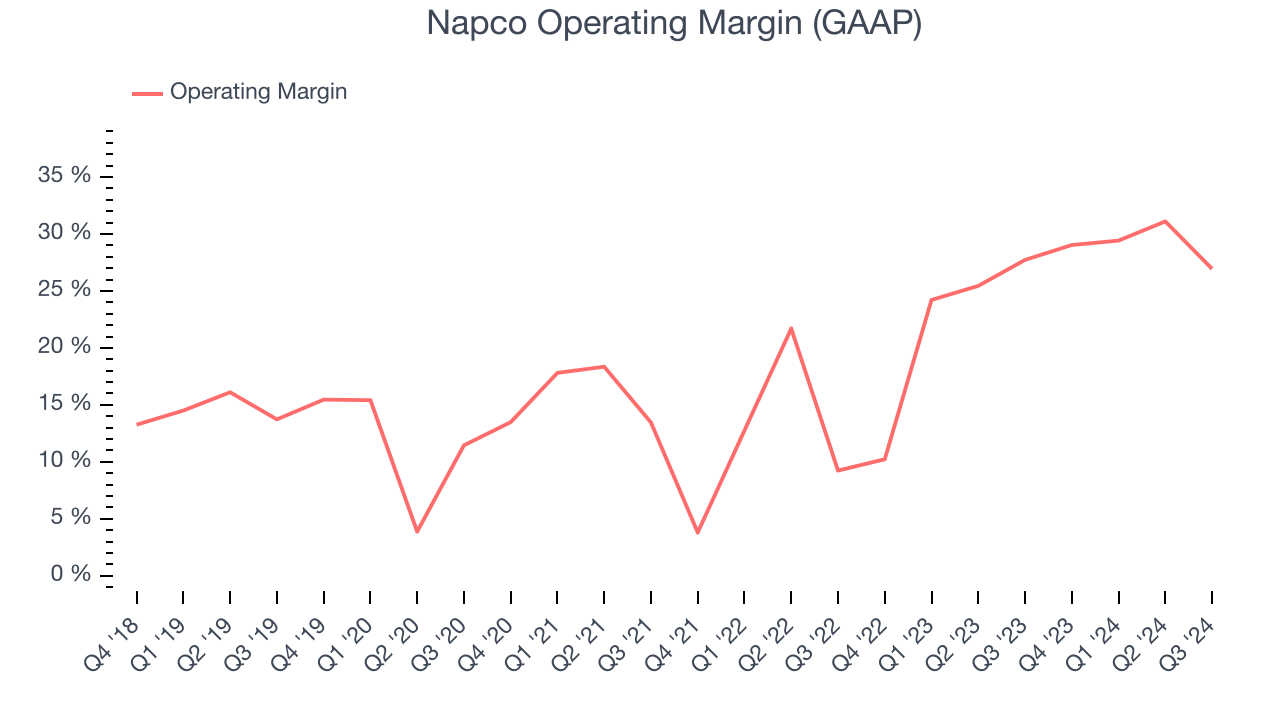
- Operating Margin: 26.9%, in line with the same quarter last year
- EBITDA Margin: 28%
- Free Cash Flow Margin: 25.8%, similar to the same quarter last year
- Market Capitalization: $1.42 billion
Richard Soloway, Chairman and CEO, commented, "Fiscal 2025 began with record revenue and net income for any first quarter in the Company's history and represents the sixteenth consecutive quarter of record sales for a quarterly reporting period. Our record quarterly net income of $11.2 million represents 25% of sales, and our Adjusted EBITDA was $12.3 million for Q1 and equates to a 28% EBITDA margin. Our cellular (radio) communication device sales increased 93% compared to Q1 last year and represent 70% of our Intrusion and Access Alarm product sales. In addition, radio sales for Q1 increased 23% sequentially and represent the highest level of radio sales since Q3 of fiscal 2023, which was the last quarter positively affected by the Verizon 3G sunset. While robust radio sales do have a negative impact on our overall equipment gross margins, which was 24% for Q1 compared to 28% in last year's first quarter, strong radio sales ultimately leads to increases in our recurring revenue business. Overall, our equipment revenue decreased 6% for the quarter, which partially was a result of a decrease in our door locking sales, which decreased 8% compared to last year. Locking products represents approximately 60% of our equipment revenues and the decline was primarily attributable to several locking distributors' efforts to lower their inventory levels. Our RSR increased 22% to $21.1 million and generated a gross margin of 91%, which was an improvement on last year's RSR margin of 90%. RSR represents 48% of total revenue in Q1 and our overall gross margin improved by over 200 basis points to 55.9% compared to 53.8% last year."
Company Overview
Napco Security Technologies, Inc. (NASDAQ:NSSC) is a leading manufacturer and designer of high-tech electronic security devices, cellular communication services for intrusion and fire alarm systems, and school safety solutions.
Electrical Systems
Like many equipment and component manufacturers, electrical systems companies are buoyed by secular trends such as connectivity and industrial automation. More specific pockets of strong demand include Internet of Things (IoT) connectivity and the 5G telecom upgrade cycle, which can benefit companies whose cables and conduits fit those needs. But like the broader industrials sector, these companies are also at the whim of economic cycles. Interest rates, for example, can greatly impact projects that drive demand for these products.
Sales Growth
A company’s long-term performance can indicate its business quality. Any business can put up a good quarter or two, but many enduring ones grow for years. Luckily, Napco’s sales grew at an excellent 12.5% compounded annual growth rate over the last five years. This is a great starting point for our analysis because it shows Napco’s offerings resonate with customers.

We at StockStory place the most emphasis on long-term growth, but within industrials, a half-decade historical view may miss cycles, industry trends, or a company capitalizing on catalysts such as a new contract win or a successful product line. Napco’s annualized revenue growth of 12.1% over the last two years aligns with its five-year trend, suggesting its demand was predictably strong. 
This quarter, Napco’s revenue grew 5.6% year on year to $44 million, missing Wall Street’s estimates.
Looking ahead, sell-side analysts expect revenue to grow 14.6% over the next 12 months, an improvement versus the last two years. This projection is healthy and shows the market thinks its newer products and services will spur faster growth.
Unless you’ve been living under a rock, it should be obvious by now that generative AI is going to have a huge impact on how large corporations do business. While Nvidia and AMD are trading close to all-time highs, we prefer a lesser-known (but still profitable) semiconductor stock benefitting from the rise of AI. Click here to access our free report on our favorite semiconductor growth story.
Operating Margin
Operating margin is an important measure of profitability as it shows the portion of revenue left after accounting for all core expenses–everything from the cost of goods sold to advertising and wages. It’s also useful for comparing profitability across companies with different levels of debt and tax rates because it excludes interest and taxes.
Napco has been a well-oiled machine over the last five years. It demonstrated elite profitability for an industrials business, boasting an average operating margin of 19.5%. This result isn’t surprising as its high gross margin gives it a favorable starting point.
Looking at the trend in its profitability, Napco’s annual operating margin rose by 17.4 percentage points over the last five years, as its sales growth gave it immense operating leverage.

This quarter, Napco generated an operating profit margin of 26.9%, in line with the same quarter last year. This indicates the company’s cost structure has recently been stable.
Earnings Per Share
We track the long-term change in earnings per share (EPS) for the same reason as long-term revenue growth. Compared to revenue, however, EPS highlights whether a company’s growth was profitable.
Napco’s EPS grew at an astounding 29.5% compounded annual growth rate over the last five years, higher than its 12.5% annualized revenue growth. This tells us the company became more profitable as it expanded.

We can take a deeper look into Napco’s earnings to better understand the drivers of its performance. As we mentioned earlier, Napco’s operating margin was flat this quarter but expanded by 17.4 percentage points over the last five years. This was the most relevant factor (aside from the revenue impact) behind its higher earnings; taxes and interest expenses can also affect EPS but don’t tell us as much about a company’s fundamentals.
Like with revenue, we analyze EPS over a shorter period to see if we are missing a change in the business.
For Napco, its two-year annual EPS growth of 84.9% was higher than its five-year trend. We love it when earnings growth accelerates, especially when it accelerates off an already high base.In Q3, Napco reported EPS at $0.30, up from $0.28 in the same quarter last year. Despite growing year on year, this print missed analysts’ estimates, but we care more about long-term EPS growth than short-term movements. Over the next 12 months, Wall Street expects Napco’s full-year EPS of $1.36 to grow by 20.7%.
Key Takeaways from Napco’s Q3 Results
We struggled to find many strong positives in these results. Its revenue missed and its EBITDA fell short of Wall Street’s estimates. Overall, this quarter could have been better. The stock traded down 14.4% to $33.06 immediately after reporting.
Napco’s latest earnings report disappointed. One quarter doesn’t define a company’s quality, so let’s explore whether the stock is a buy at the current price. If you’re making that decision, you should consider the bigger picture of valuation, business qualities, as well as the latest earnings. We cover that in our actionable full research report which you can read here, it’s free.
