
Local broadcasting and digital media company Nexstar (NASDAQ:NXST) missed analysts' expectations in Q4 FY2023, with revenue down 12.3% year on year to $1.30 billion. It made a GAAP profit of $3.32 per share, down from its profit of $5.31 per share in the same quarter last year.
Nexstar Media (NXST) Q4 FY2023 Highlights:
- Revenue: $1.30 billion vs analyst estimates of $1.31 billion (0.7% miss)
- EPS: $3.32 vs analyst expectations of $4.19 (20.8% miss)
- Guidance for 2024 adjusted EBITDA of $2,140 million at the midpoint, below expectations of roughly $2,200 million
- Free Cash Flow of $265 million, up from $85 million in the previous quarter
- Gross Margin (GAAP): 58.6%, down from 66.7% in the same quarter last year
- Market Capitalization: $5.51 billion
Founded in 1996, Nexstar (NASDAQ:NXST) is an American media company operating numerous local television stations and digital media outlets across the country.
Nexstar was created to consolidate local TV stations, enhancing local broadcasting efficiency. Starting with a single station in Pennsylvania, the company expanded by acquiring stations in medium-sized markets, focusing on improving access to quality local news and entertainment. This approach aimed to fill the media coverage gap in these areas, addressing the need for localized content.
The company provides local and national news broadcasting, digital media services, and network-affiliated television programming. Nexstar’s digital platforms supplement its core broadcasting services, offering an integrated media experience.
Revenue is generated through advertising, digital services, and retransmission fees from cable and satellite operators. Nexstar’s business model capitalizes on its network of local stations, attracting advertisers with targeted marketing opportunities.
Broadcasting
Broadcasting companies have been facing secular headwinds in the form of consumers abandoning traditional television and radio in favor of streaming services. As a result, many broadcasting companies have evolved by forming distribution agreements with major streaming platforms so they can get in on part of the action, but will these subscription revenues be as high quality and high margin as their legacy revenues? Only time will tell which of these broadcasters will survive the sea changes of technological advancement and fragmenting consumer attention.
Competitors in the local television broadcasting and digital media sector include Sinclair (NASDAQ:SBGI), Gray Television (NYSE:GTN), and TEGNA (NYSE:TGNA).Sales Growth
Reviewing a company's long-term performance can reveal insights into its business quality. Any business can have short-term success, but a top-tier one sustains growth for years. Nexstar Media's annualized revenue growth rate of 12.3% over the last five years was mediocre for a consumer discretionary business. 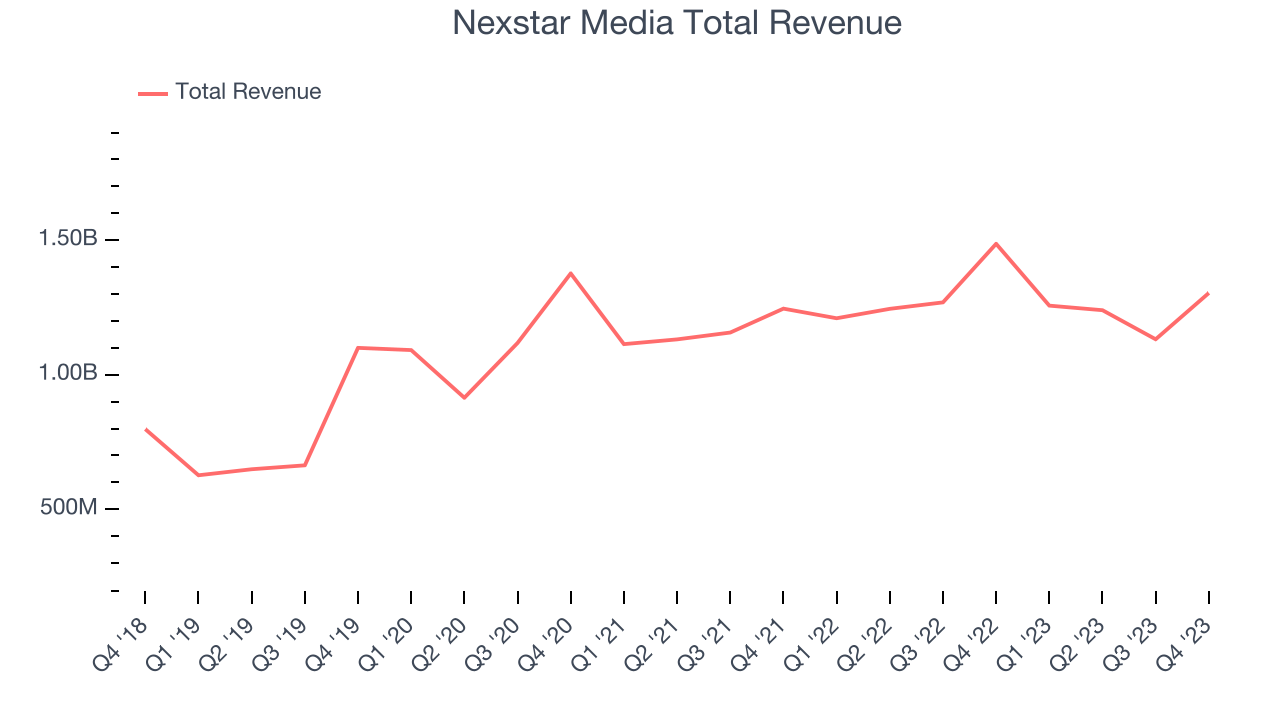 Within consumer discretionary, a long-term historical view may miss a company riding a successful new product or emerging trend. That's why we also follow short-term performance. Nexstar Media's recent history shows the business has slowed as its annualized revenue growth of 3% over the last two years is below its five-year trend.
We can better understand the company's revenue dynamics by analyzing its most important segments, Distribution and Core Advertising, which are 54% and 34.4% of revenue. Over the last two years, Nexstar Media's Distribution revenue (licensing and affiliate fees) averaged 5% year-on-year growth. On the other hand, its Core Advertising revenue (TV and radio ads) averaged 2.8% declines.
This quarter, Nexstar Media missed Wall Street's estimates and reported a rather uninspiring 12.3% year-on-year revenue decline, generating $1.30 billion of revenue. Looking ahead, Wall Street expects sales to grow 14% over the next 12 months, an acceleration from this quarter.
Operating Margin
Operating margin is an important measure of profitability. It’s the portion of revenue left after accounting for all core expenses–everything from the cost of goods sold to advertising and wages. Operating margin is also useful for comparing profitability across companies with different levels of debt and tax rates because it excludes interest and taxes.
Nexstar Media has been a well-managed company over the last eight quarters. It's demonstrated it can be one of the more profitable businesses in the consumer discretionary sector, boasting an average operating margin of 19.9%.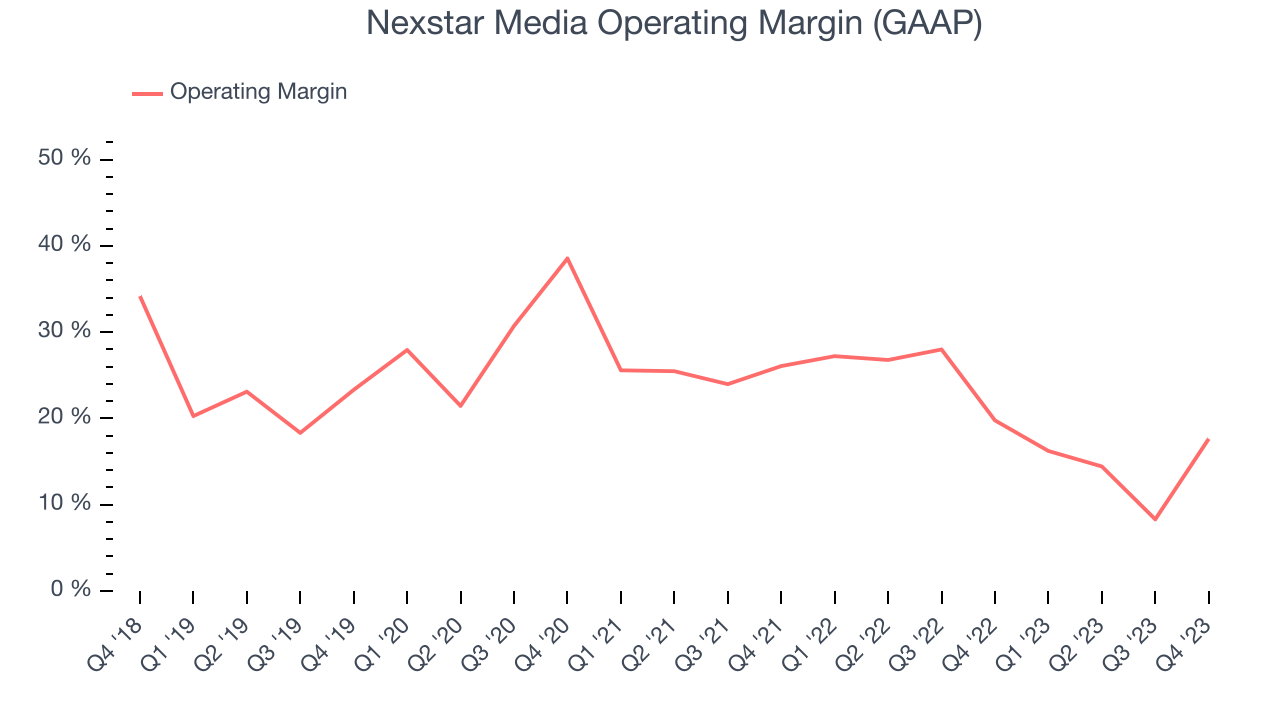
In Q4, Nexstar Media generated an operating profit margin of 17.6%, down 2.1 percentage points year on year.
Over the next 12 months, Wall Street expects Nexstar Media to become more profitable. Analysts are expecting the company’s LTM operating margin of 14.3% to rise to 25.8%.EPS
We track long-term historical earnings per share (EPS) growth for the same reason as long-term revenue growth. Compared to revenue, however, EPS highlights whether a company's growth was profitable. 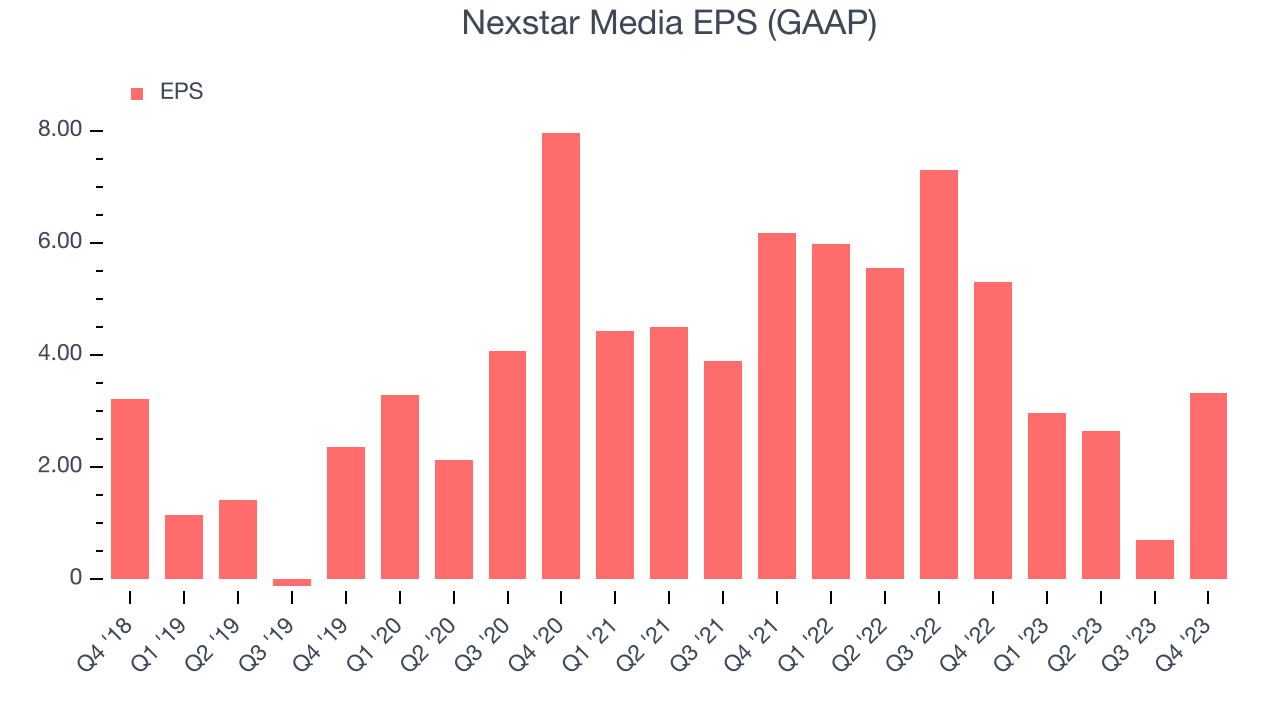
Over the last five years, Nexstar Media's EPS dropped 30.8%, translating into 5.5% annualized declines. We hope the company can generate some earnings growth in the future.
In Q4, Nexstar Media reported EPS at $3.32, down from $5.31 in the same quarter a year ago. This print unfortunately missed analysts' estimates. Over the next 12 months, Wall Street expects Nexstar Media to grow its earnings. Analysts are projecting its LTM EPS of $9.63 to climb by 172% to $26.18.
Cash Is King
Although earnings are undoubtedly valuable for assessing company performance, we believe cash is king because you can't use accounting profits to pay the bills.
Over the last two years, Nexstar Media has shown terrific cash profitability, enabling it to reinvest, return capital to investors, and stay ahead of the competition while maintaining a robust cash balance. The company's free cash flow margin has been among the best in the consumer discretionary sector, averaging 22.5%.
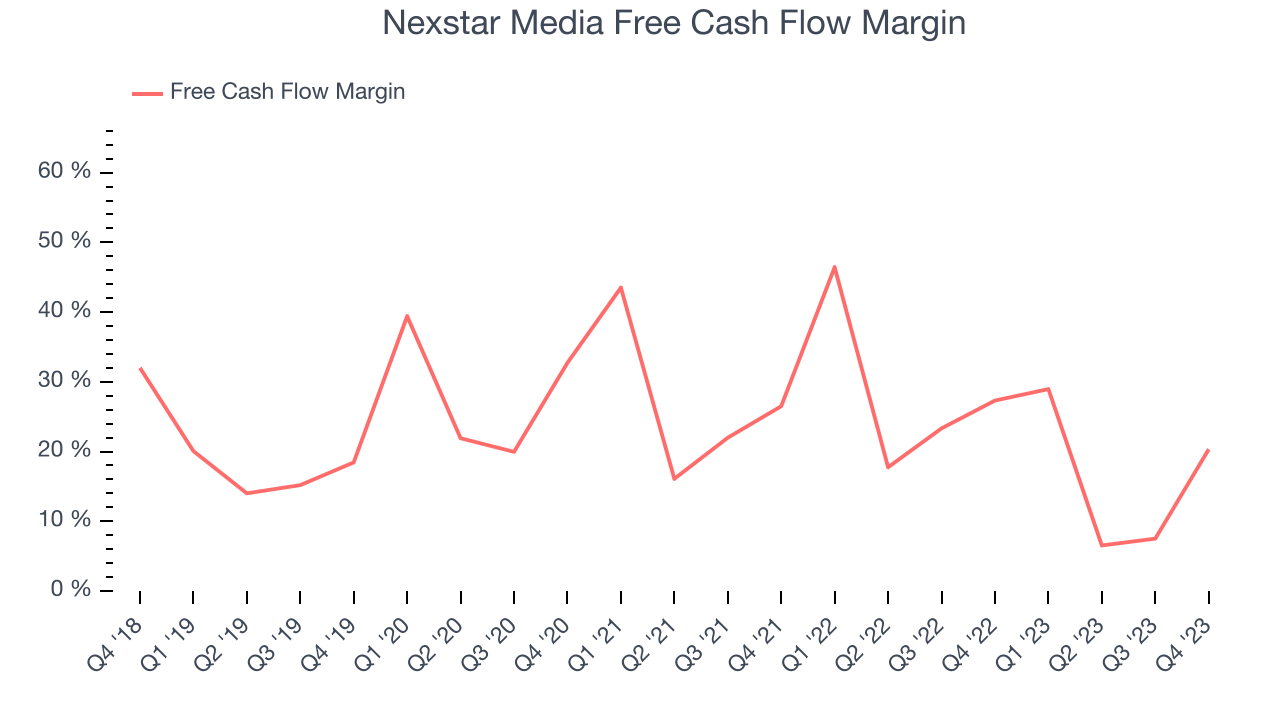
Nexstar Media's free cash flow came in at $265 million in Q4, equivalent to a 20.3% margin and down 34.7% year on year. Over the next year, analysts predict Nexstar Media's cash profitability will improve. Their consensus estimates imply its LTM free cash flow margin of 16.1% will increase to 25.4%.
Return on Invested Capital (ROIC)
EPS and free cash flow tell us whether a company was profitable while growing revenue. But was it capital-efficient? Enter ROIC, a metric showing how much operating profit a company generates relative to how much money the business raised (debt and equity).
Nexstar Media's five-year average ROIC was 36.7%, placing it among the best consumer discretionary companies. Just as you’d like your investment dollars to generate returns, Nexstar Media's invested capital has produced excellent profits.
The trend in its ROIC, however, is often what surprises the market and drives the stock price. Unfortunately, Nexstar Media's ROIC over the last two years averaged 15.4 percentage point decreases each year. We like what management has done historically but are concerned its ROIC is declining, perhaps a symptom of waning business opportunities to invest profitably.
Key Takeaways from Nexstar Media's Q4 Results
We struggled to find many strong positives in these results. Its EPS missed and its operating margin fell short of Wall Street's estimates. Adjusted EBITDA guidance for the full year was also below expectations., Overall, this was a mediocre quarter for Nexstar Media. The company is down 1.5% on the results and currently trades at $160.1 per share.
Is Now The Time?
Nexstar Media may have had a tough quarter, but investors should also consider its valuation and business qualities when assessing the investment opportunity.
We have other favorites, but we understand the arguments that Nexstar Media isn't a bad business. Although its revenue growth has been mediocre over the last five years, its growth over the next 12 months is expected to be higher. And while its declining EPS over the last five years makes it hard to trust, its stellar ROIC suggests it has been a well-run company historically.
Nexstar Media's price-to-earnings ratio based on the next 12 months is 6.8x. In the end, beauty is in the eye of the beholder. While Nexstar Media wouldn't be our first pick, if you like the business, the shares are trading at a pretty interesting price right now.
Wall Street analysts covering the company had a one-year price target of $201.35 per share right before these results (compared to the current share price of $160.10).
To get the best start with StockStory, check out our most recent stock picks, and then sign up for our earnings alerts by adding companies to your watchlist here. We typically have the quarterly earnings results analyzed within seconds of the data being released, and especially for companies reporting pre-market, this often gives investors the chance to react to the results before the market has fully absorbed the information.