
OLED provider Universal Display (NASDAQ:OLED) beat analysts' expectations in Q1 CY2024, with revenue up 26.7% year on year to $165.3 million. The company expects the full year's revenue to be around $655 million, in line with analysts' estimates. It made a GAAP profit of $1.19 per share, improving from its profit of $0.84 per share in the same quarter last year.
Universal Display (OLED) Q1 CY2024 Highlights:
- Revenue: $165.3 million vs analyst estimates of $150.4 million (9.9% beat)
- EPS: $1.19 vs analyst estimates of $1.02 (16.7% beat)
- The company reconfirmed its revenue guidance for the full year of $655 million at the midpoint
- Gross Margin (GAAP): 77.6%, up from 72.9% in the same quarter last year
- Inventory Days Outstanding: 426, up from 415 in the previous quarter
- Free Cash Flow of $64.95 million, up 120% from the previous quarter
- Market Capitalization: $7.24 billion
Serving major consumer electronics manufacturers, Universal Display (NASDAQ:OLED) is a provider of organic light emitting diode (OLED) technologies used in display and lighting applications.
Universal Display Corporation was founded in 1994 by Sherwin Seligsohn after he visited the electrical engineering school at Princeton University and observed research on self-emissive organic materials. In 1996, Universal Display went public with a research contract with Princeton, 3 part-time employees, and one patent pending.
Organic light emitting diodes or OLEDs are thin, lightweight devices that emit light that can be manufactured on both flexible and rigid substrates, which make them suitable for color displays and other lighting products. OLED displays have been capturing market share from inorganic light emitting diodes or LEDs due to superior power efficiency, contrast ratio, video response time, and manufacturing cost. As such, OLED technology is commonly employed in mobile phones, TVs, wearables, AR/VR devices, and automotive markets among others.
Universal Display generates revenue by entering into long-term agreements with our customers through (1) commercial supply agreements for the purchase of specific OLED materials and/or (2) patent license agreements related to the manufacture of display and lighting devices. Commercial supply agreements often involve multi-year purchase commitments for mass production facilities, which gives customers volume discounts and preferential pricing.
Competitors offering OLED or competing lighting technologies include Sumitomo Chemical (TSE:4005), Idemitsu Kosan (TSE:5019), and Cynora.Sales Growth
Universal Display's revenue growth over the last three years has been mediocre, averaging 16.4% annually. But as you can see below, this quarter wasn't particularly strong, with revenue growing from $130.5 million in the same quarter last year to $165.3 million. Semiconductors are a cyclical industry, and long-term investors should be prepared for periods of high growth followed by periods of revenue contractions (which can sometimes offer opportune times to buy).
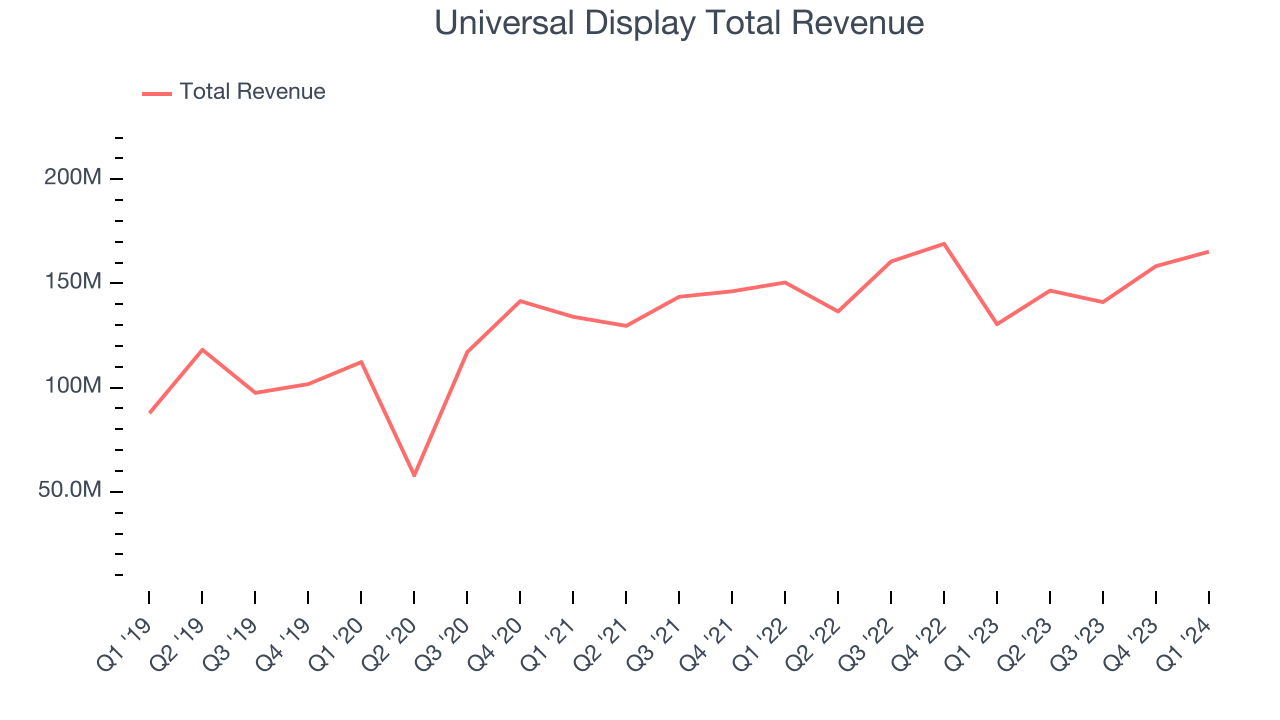
Universal Display had a good quarter as its revenue grew 26.7% year on year, topping analysts' estimates by 9.9%. Universal Display's growth inflected from negative to positive this quarter, indicating that the recent cycle downturn is likely in the rearview mirror.
Product Demand & Outstanding Inventory
Days Inventory Outstanding (DIO) is an important metric for chipmakers, as it reflects a business' capital intensity and the cyclical nature of semiconductor supply and demand. In a tight supply environment, inventories tend to be stable, allowing chipmakers to exert pricing power. Steadily increasing DIO can be a warning sign that demand is weak, and if inventories continue to rise, the company may have to downsize production.
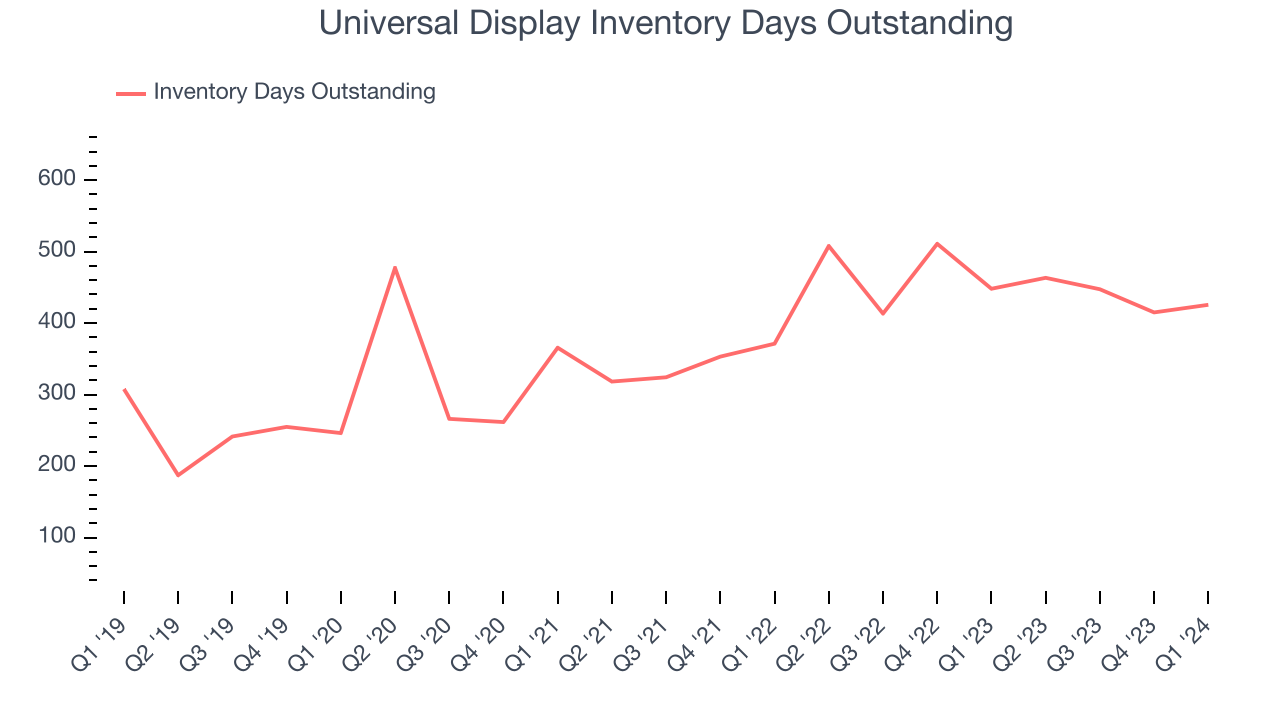
This quarter, Universal Display's DIO came in at 426, which is 61 days above its five-year average, suggesting that the company's inventory has grown to higher levels than we've seen in the past.
Pricing Power
In the semiconductor industry, a company's gross profit margin is a critical metric to track because it sheds light on its pricing power, complexity of products, and ability to procure raw materials, equipment, and labor. Universal Display's gross profit margin, which shows how much money the company gets to keep after paying key materials, input, and manufacturing costs, came in at 77.6% in Q1, up 4.8 percentage points year on year.
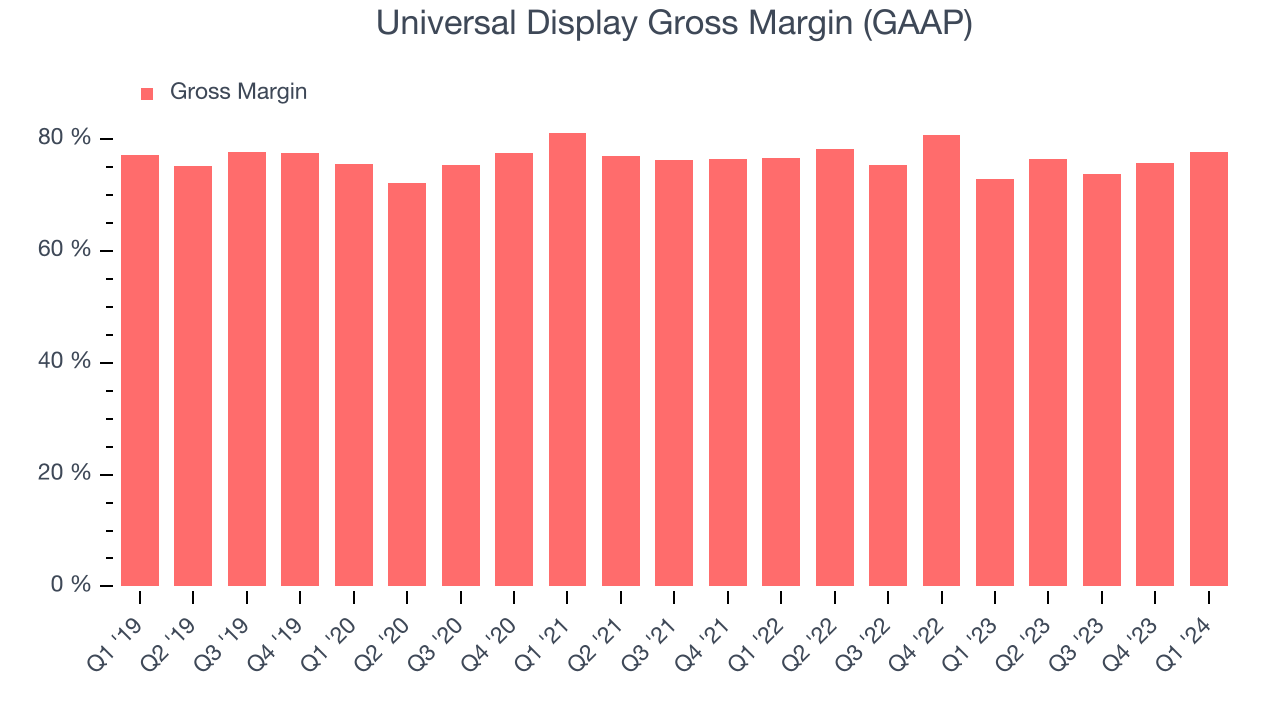
Gross margins have been relatively stable over the last year, averaging 76%. Universal Display's gross margins are some of the best in the semiconductor peer group, driven by strong pricing power from its differentiated, value-add products.
Profitability
Universal Display reported an operating margin of 47.6% in Q1, up 12.8 percentage points year on year. Operating margins are one of the best measures of profitability because they tell us how much money a company takes home after manufacturing its products, marketing and selling them, and, importantly, keeping them relevant through research and development.
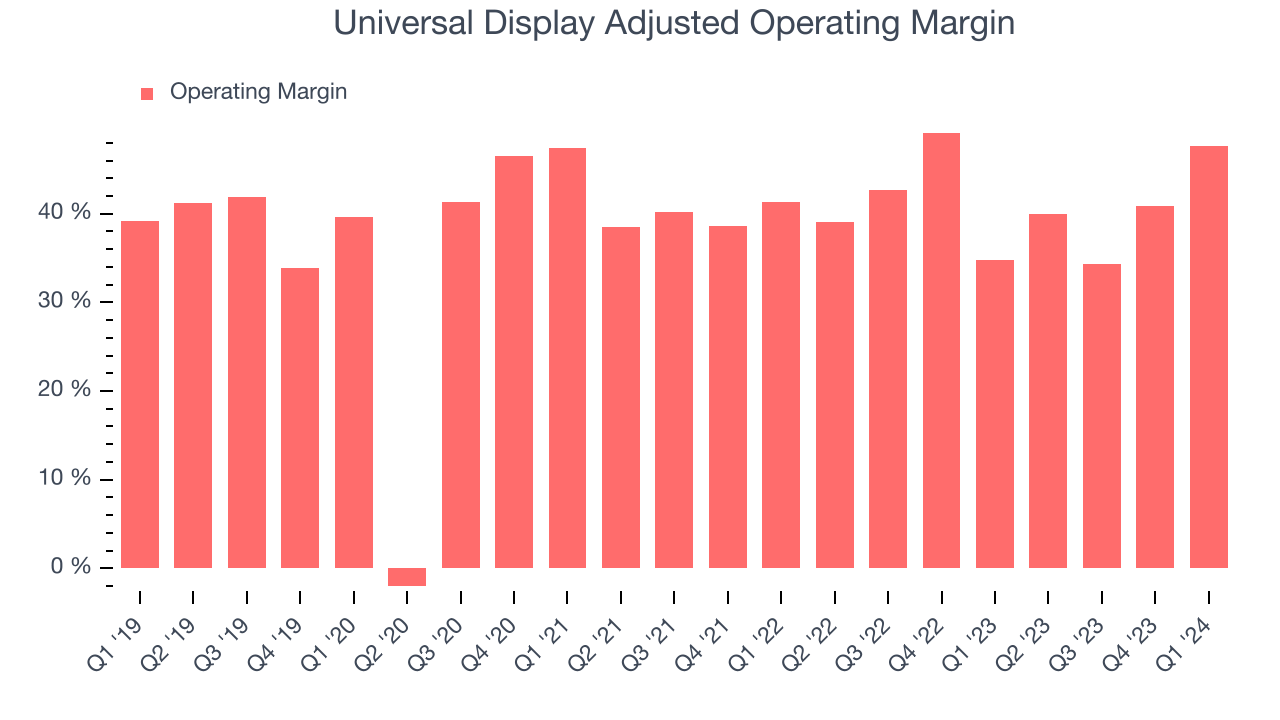
Universal Display's operating margins have been stable over the last year, averaging 38.5%. Additionally, the company's margins are among the strongest in the semiconductor industry, demonstrating how efficiently the business is managed.
Earnings, Cash & Competitive Moat
Analysts covering Universal Display expect earnings per share to grow 9% over the next 12 months, although estimates will likely change after earnings.
Although earnings are important, we believe cash is king because you can't use accounting profits to pay the bills. Universal Display's free cash flow came in at $64.95 million in Q1, up 68.6% year on year.
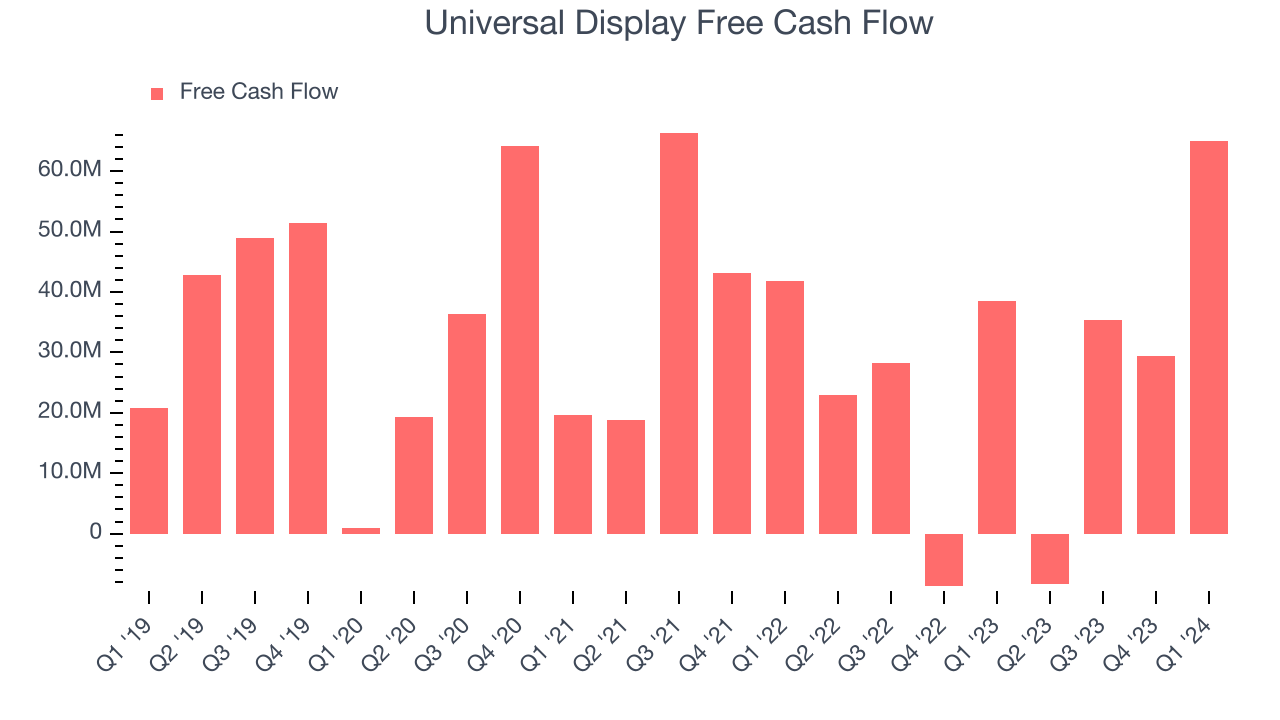
As you can see above, Universal Display produced $121.4 million in free cash flow over the last 12 months, a solid 19.9% of revenue. This FCF margin is above average for semiconductor companies and should put Universal Display in a relatively strong position to invest in future growth initiatives.
Return on Invested Capital (ROIC)
EPS and free cash flow tell us whether a company was profitable while growing revenue. But was it capital-efficient? A company’s ROIC explains this by showing how much operating profit a company makes compared to how much money the business raised (debt and equity).
Universal Display's five-year average ROIC was 50.1%, placing it among the best semiconductor companies. Just as you’d like your investment dollars to generate returns, Universal Display's invested capital has produced excellent profits.
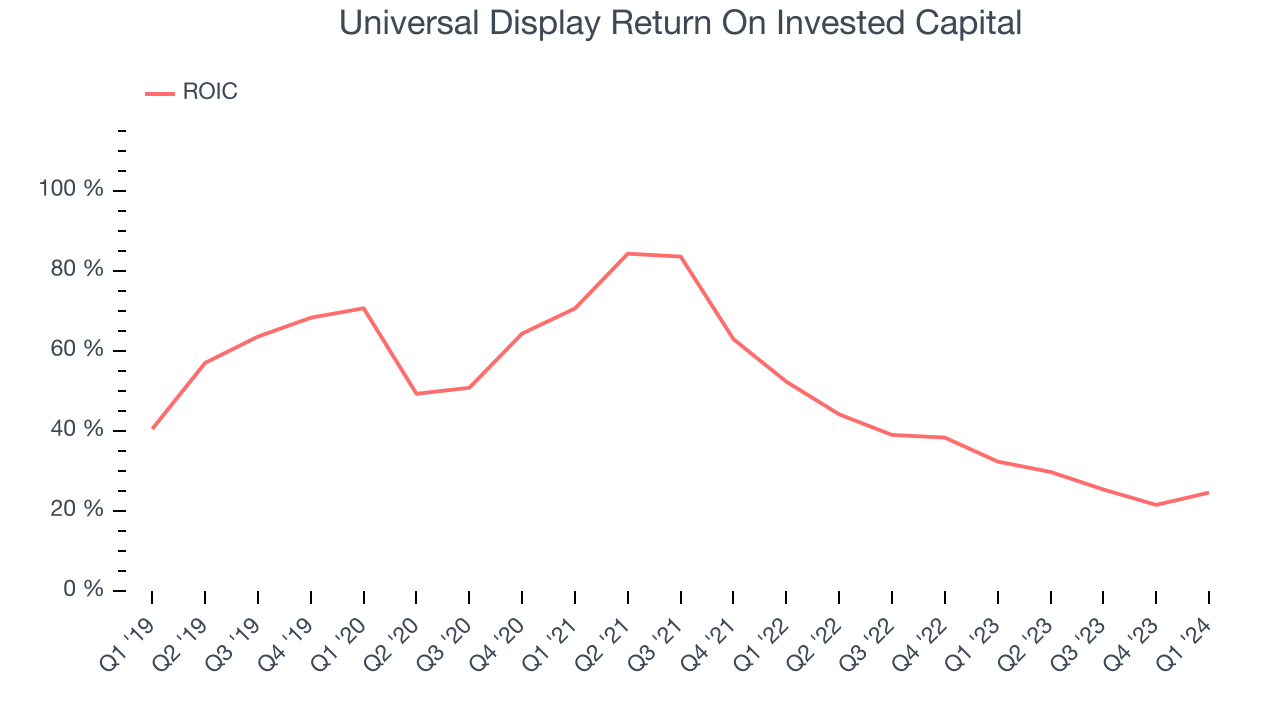
The trend in its ROIC, however, is often what surprises the market and drives the stock price. Unfortunately, Universal Display's ROIC significantly decreased over the last few years. The company has historically shown the ability to generate good returns, but the performance has not been as strong recently.
Key Takeaways from Universal Display's Q1 Results
We were impressed by Universal Display's strong operating margin improvement this quarter. We were also excited its revenue outperformed Wall Street's estimates. On the other hand, its inventory levels increased. Overall, we think this was still a really good quarter that should please shareholders. The stock is up 4.6% after reporting and currently trades at $163.5 per share.
Is Now The Time?
When considering an investment in Universal Display, investors should take into account its valuation and business qualities as well as what's happened in the latest quarter.
There are numerous reasons why we think Universal Display is one of the best semiconductor companies out there. For starters, its revenue growth has been solid over the last three years, and its growth over the next 12 months is expected to exceed that. Additionally, its impressive gross margins indicate robust pricing power, and its stellar ROIC suggests it has been a well-run company historically.
Universal Display's price-to-earnings ratio based on the next 12 months is 32.0x. Looking at the semiconductors landscape today, Universal Display's qualities really stand out, and we really like it at this price.
Wall Street analysts covering the company had a one-year price target of $202.70 per share right before these results (compared to the current share price of $163.50), implying they saw upside in buying Universal Display in the short term.
To get the best start with StockStory check out our most recent Stock picks, and then sign up to our earnings alerts by adding companies to your watchlist here. We typically have the quarterly earnings results analyzed within seconds of the data being released, and especially for the companies reporting pre-market, this often gives investors the chance to react to the results before the market has fully absorbed the information.