Discount retail company Ollie’s Bargain Outlet (NASDAQ:OLLI) reported results in line with analysts' expectations in Q4 CY2023, with revenue up 18% year on year to $648.9 million. On the other hand, the company's full-year revenue guidance of $2.26 billion at the midpoint came in 1.5% below analysts' estimates. It made a non-GAAP profit of $1.23 per share, improving from its profit of $0.84 per share in the same quarter last year.
Ollie's (OLLI) Q4 CY2023 Highlights:
- Revenue: $648.9 million vs analyst estimates of $649.2 million (small miss)
- EPS (non-GAAP): $1.23 vs analyst estimates of $1.16 (6% beat)
- Management's revenue guidance for the upcoming financial year 2024 is $2.26 billion at the midpoint, missing analyst estimates by 1.5% and implying 7.5% growth (vs 14.9% in FY2023) (EPS guidance for the same period was also below expectations)
- Gross Margin (GAAP): 40.5%, up from 37.6% in the same quarter last year
- Same-Store Sales were up 3.9% year on year (beat vs. expectations of up 3.3% year on year)
- Store Locations: 512 at quarter end, increasing by 44 over the last 12 months
- Market Capitalization: $4.64 billion
Often located in suburban or semi-rural shopping centers, Ollie’s Bargain Outlet (NASDAQ:OLLI) is a discount retailer that acquires excess inventory then sells at meaningful discounts.
For example, if Walmart orders huge quantities of toys based on a new Disney movie but the movie flops and the popularity of that toy never materializes, Walmart may sell those in bulk to Ollie’s at pennies on the dollar rather than discount the items and try to sell them individually. This is often done to clear shelf space for new products.
Ollie’s buying approach focuses on finding excess inventory or overstocked items from other retailers, so selection can change quickly and be varied. Shopping at Ollie’s is often a treasure hunt–what the consumer loses in reliable selection or the latest trends is made up for with very low prices. Prices of Ollie’s merchandise can be as much as 70% off other full-price retailers. Housewares and home decor, snacks, toys and games, and electronics are key product categories at the typical Ollie’s store.
The core customer is the value-conscious shopper who values a one-stop shop for many of a household’s needs. This customer is willing to physically go to stores and spend more time searching for the right merchandise since Ollie’s has a very limited online presence.
Discount General Merchandise Retailer
Broadline discount retailers understand that many shoppers love a good deal, and they focus on providing excellent value to shoppers by selling general merchandise at major discounts. They can do this because of unique purchasing, procurement, and pricing strategies that involve scouring the market for trendy goods or buying excess inventory from manufacturers and other retailers. They then turn around and sell these snacks, paper towels, toys, and myriad other products at highly enticing prices. Despite the unique draw and lure of discounts, these discount retailers must also contend with the secular headwinds of online shopping and challenged retail foot traffic in places like suburban strip malls.
Off-price and discount retail competitors include TJX (NYSE:TJX), Ross Stores (NASDAQ:ROST), and Burlington Stores (NYSE:BURL).Sales Growth
Ollie's is a small retailer, which sometimes brings disadvantages compared to larger competitors that benefit from economies of scale.
As you can see below, the company's annualized revenue growth rate of 10.5% over the last four years (we compare to 2019 to normalize for COVID-19 impacts) was decent as it opened new stores and grew sales at existing, established stores.
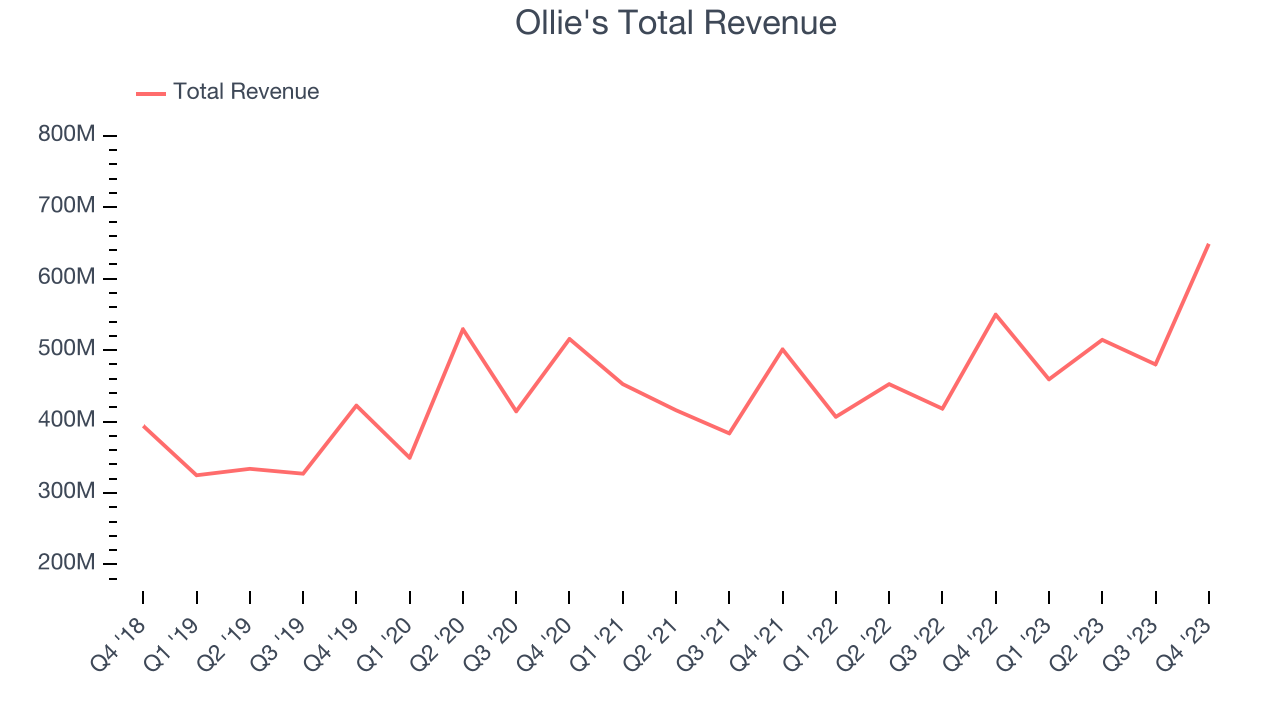
This quarter, Ollie's revenue grew 18% year on year to $648.9 million, falling short of Wall Street's estimates. Looking ahead, Wall Street expects sales to grow 9.4% over the next 12 months, a deceleration from this quarter.
Number of Stores
A retailer's store count often determines on how much revenue it can generate.
When a retailer like Ollie's is opening new stores, it usually means it's investing for growth because demand is greater than supply. Ollie's store count increased by 44 locations, or 9.4%, over the last 12 months to 512 total retail locations in the most recently reported quarter.
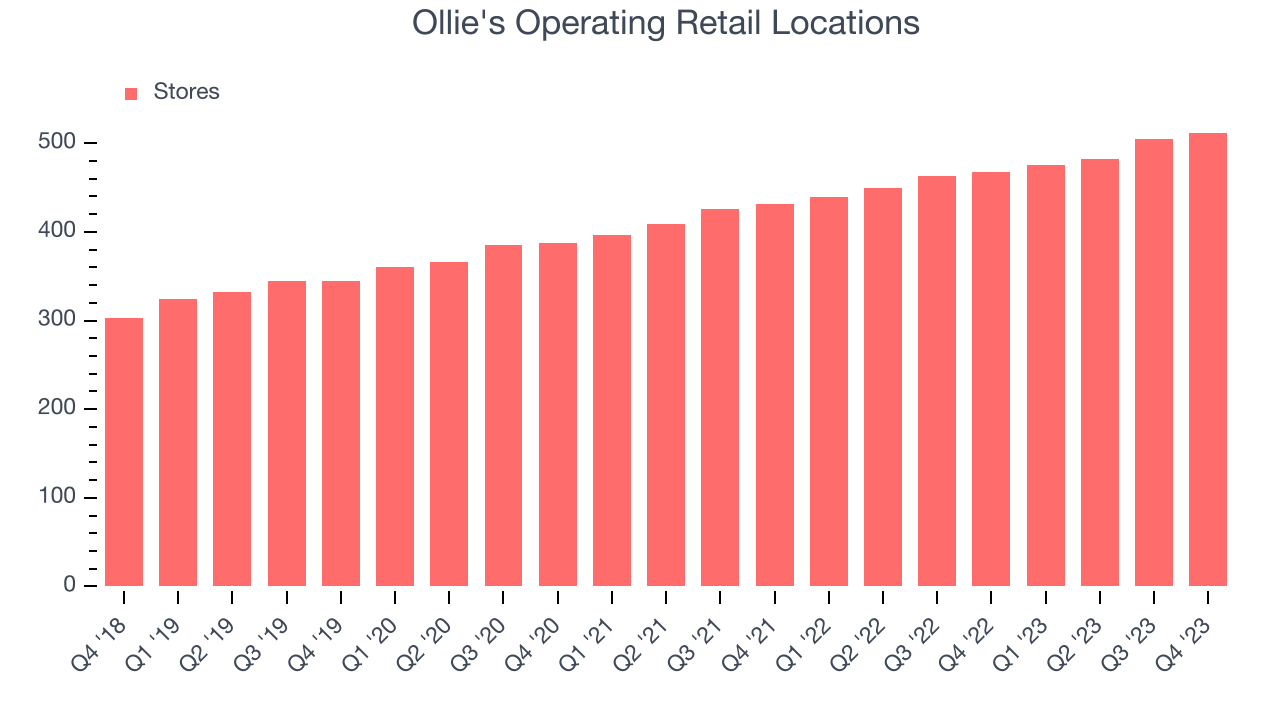
Over the last two years, the company has rapidly opened new stores, averaging 9% annual growth in its physical footprint. This store growth is among the fastest in the consumer retail sector and gives Ollie's a chance to scale towards a mid-sized company over time. With an expanding store base and demand, revenue growth can come from multiple vectors: sales from new stores, sales from e-commerce, or increased foot traffic and higher sales per customer at existing stores.
Same-Store Sales
A company's same-store sales growth shows the year-on-year change in sales for its brick-and-mortar stores that have been open for at least a year, give or take, and e-commerce platform. This is a key performance indicator for retailers because it measures organic growth and demand.
Ollie's demand within its existing stores has been relatively stable over the last eight quarters but fallen behind the broader consumer retail sector. On average, the company's same-store sales have grown by 1.5% year on year. With positive same-store sales growth amid an increasing physical footprint of stores, Ollie's is reaching more customers and growing sales.
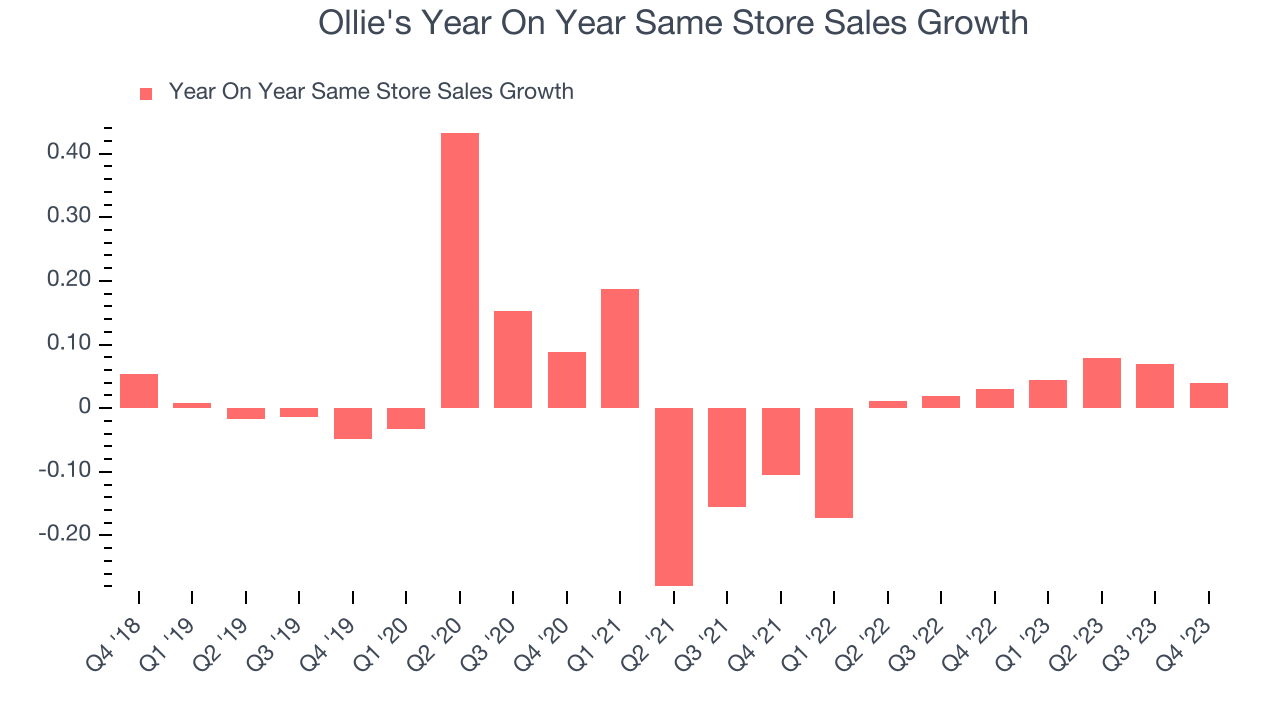
In the latest quarter, Ollie's same-store sales rose 3.9% year on year. This performance was more or less in line with the same quarter last year.
Gross Margin & Pricing Power
Ollie's unit economics are higher than the typical retailer, giving it the flexibility to invest in areas such as marketing and talent to reach more consumers. As you can see below, it's averaged a decent 37.9% gross margin over the last eight quarters. This means the company makes $0.38 for every $1 in revenue before accounting for its operating expenses.
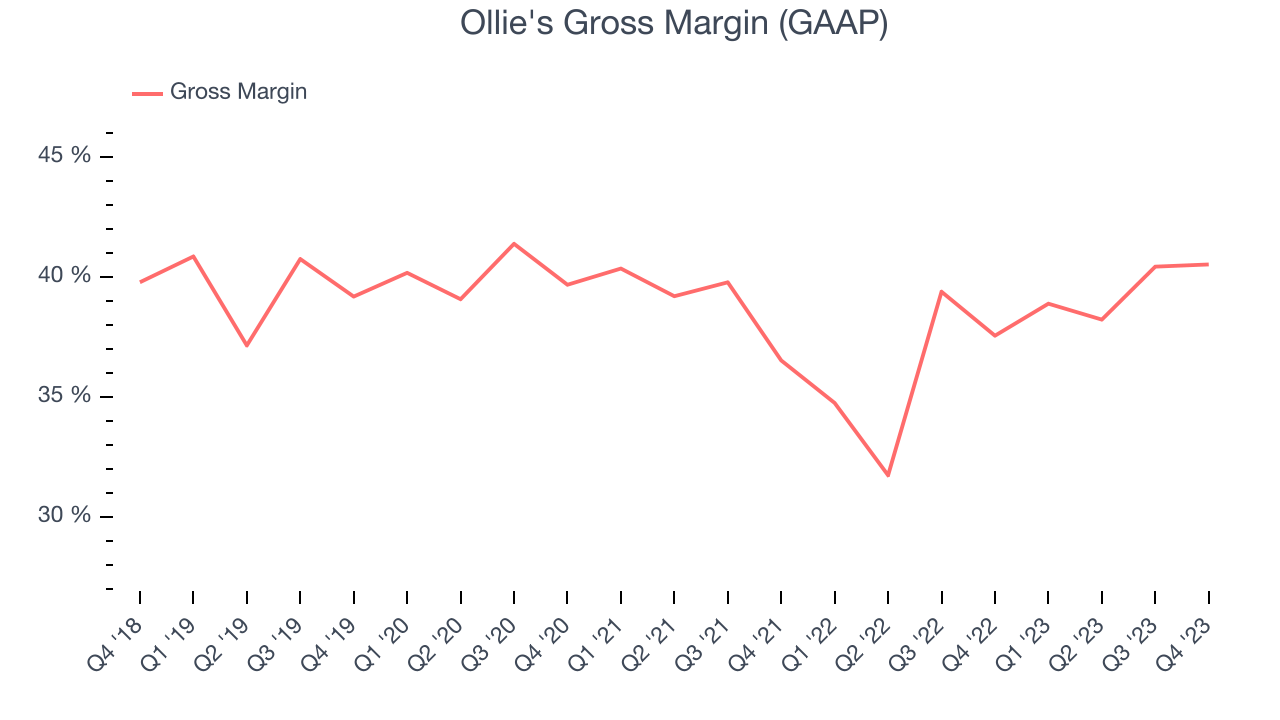
Ollie's produced a 40.5% gross profit margin in Q4, marking a 3 percentage point increase from 37.6% in the same quarter last year. This margin expansion is a good sign in the near term. If this trend continues, it could signal a less competitive environment where the company has better pricing power, less pressure to discount products, and more stable input costs (such as distribution expenses to move goods).
Operating Margin
Operating margin is an important measure of profitability for retailers as it accounts for all expenses such as keeping the lights on, including wages, rent, advertising, and other administrative costs.
In Q4, Ollie's generated an operating profit margin of 15%, up 2.9 percentage points year on year. This increase was encouraging and driven by stronger pricing power, as indicated by the company's larger rise in gross margin.
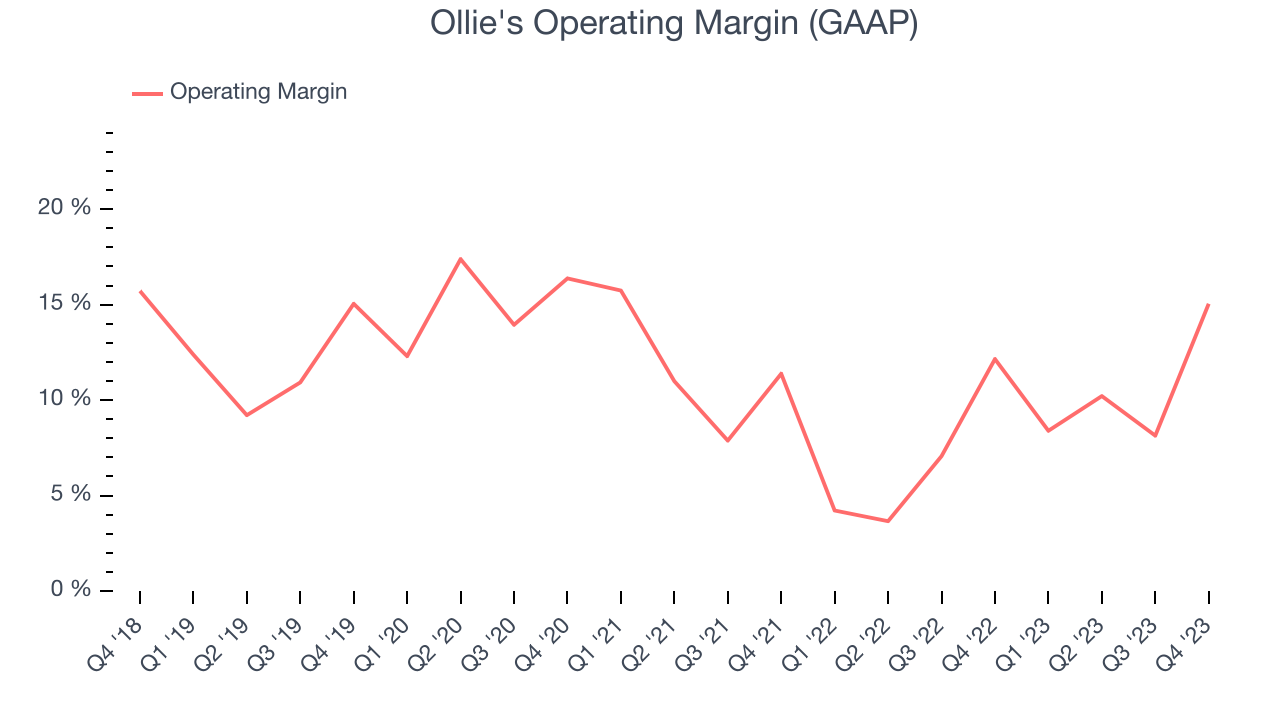
Zooming out, Ollie's has done a decent job managing its expenses over the last eight quarters. It's produced an average operating margin of 9.1%, higher than the broader consumer retail sector. On top of that, its margin has improved by 3.7 percentage points year on year (on average), an extremely encouraging sign for shareholders.
EPS
Earnings growth is a critical metric to track, but for long-term shareholders, earnings per share (EPS) is more telling because it accounts for dilution and share repurchases.
In Q4, Ollie's reported EPS at $1.23, up from $0.84 in the same quarter a year ago. This print beat Wall Street's estimates by 6%.
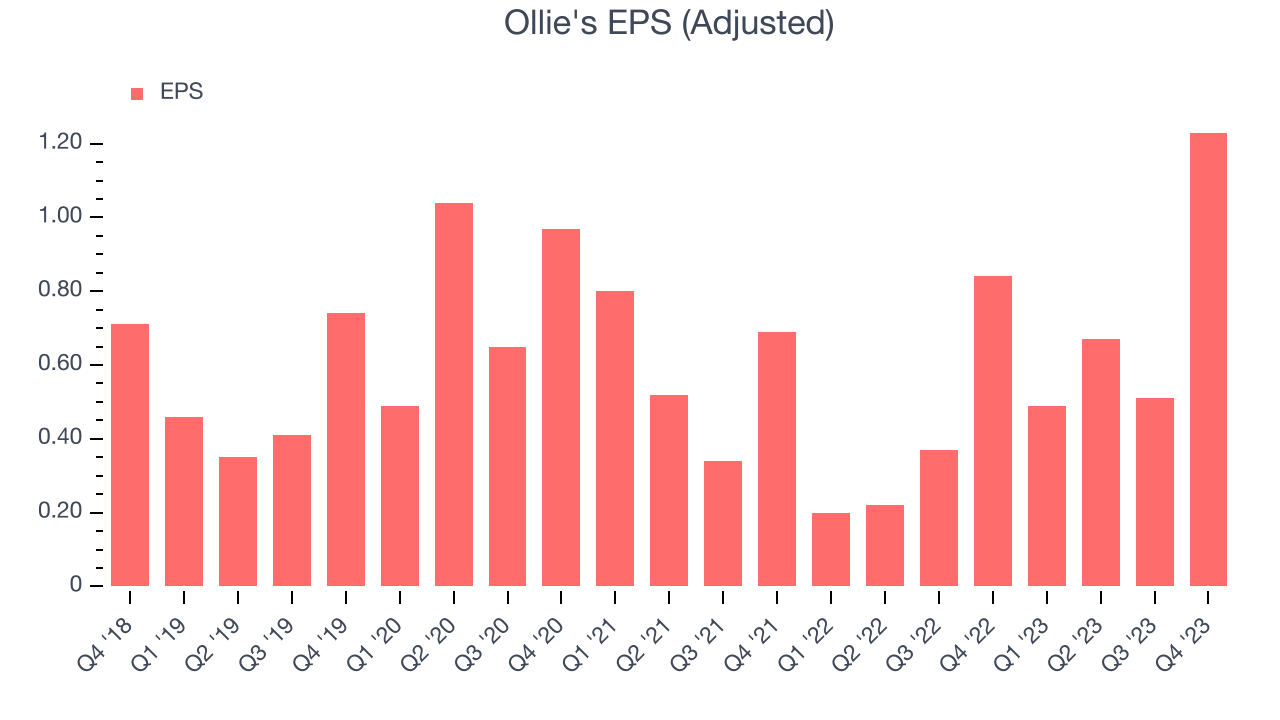
Between FY2019 and FY2023, Ollie's adjusted diluted EPS grew 48%, translating into a decent 10.3% compounded annual growth rate.
Wall Street expects the company to continue growing earnings over the next 12 months, with analysts projecting an average 11.3% year-on-year increase in EPS.
Return on Invested Capital (ROIC)
EPS and free cash flow tell us whether a company was profitable while growing revenue. But was it capital-efficient? Enter ROIC, a metric showing how much operating profit a company generates relative to how much money the business raised (debt and equity).
Ollie's five-year average ROIC was 11.5%, somewhat low compared to the best retail companies that consistently pump out 25%+. Its returns suggest it historically did a subpar job investing in profitable business initiatives.
The trend in its ROIC, however, is often what surprises the market and drives the stock price. Unfortunately, Ollie's ROIC over the last two years averaged 6.3 percentage point decreases each year. In conjunction with its already low returns, these declines suggest the company's profitable business opportunities are few and far between.
Key Takeaways from Ollie's Q4 Results
While same store sales and EPS outperformed Wall Street's estimates, revenue missed and full-year guidance for both sales and earnings were below Wall Street's estimates. Overall, this was a mediocre quarter for Ollie's. The company is down 4.1% on the results and currently trades at $72.3 per share.
Is Now The Time?
When considering an investment in Ollie's, investors should take into account its valuation and business qualities as well as what's happened in the latest quarter.
Ollie's isn't a bad business, but it probably wouldn't be one of our picks. Although its revenue growth has been decent over the last four years, its poor same-store sales performance has been a headwind. And while its expanding store base shows it's playing offense to grow its brand, the downside is its brand caters to a niche market.
Ollie's price-to-earnings ratio based on the next 12 months is 23.4x. We don't really see a big opportunity in the stock at the moment, but in the end, beauty is in the eye of the beholder. If you like Ollie's, it seems to be trading at a reasonable price.
Wall Street analysts covering the company had a one-year price target of $86.29 per share right before these results (compared to the current share price of $72.30).
To get the best start with StockStory, check out our most recent stock picks, and then sign up to our earnings alerts by adding companies to your watchlist here. We typically have the quarterly earnings results analyzed within seconds of the data being released, and especially for companies reporting pre-market, this often gives investors the chance to react to the results before the market has fully absorbed the information.
