
Auto parts and accessories retailer O’Reilly Automotive (NASDAQ:ORLY) reported results in line with analysts' expectations in Q1 CY2024, with revenue up 7.2% year on year to $3.98 billion. The company's outlook for the full year was also close to analysts' estimates with revenue guided to $16.95 billion at the midpoint. It made a GAAP profit of $9.20 per share, improving from its profit of $8.28 per share in the same quarter last year.
O'Reilly (ORLY) Q1 CY2024 Highlights:
- Revenue: $3.98 billion vs analyst estimates of $3.98 billion (small miss)
- EPS: $9.20 vs analyst expectations of $9.30 (1.1% miss)
- The company reconfirmed its revenue guidance for the full year of $16.95 billion at the midpoint
- The company raised its EPS guidance for the full year of $41.60 at the midpoint (from $41.30, expectations are for $42.48)
- Gross Margin (GAAP): 51.2%, in line with the same quarter last year
- Free Cash Flow of $438.9 million, similar to the same quarter last year
- Same-Store Sales were up 3.4% year on year (miss vs. expectations of up 4.1% year on year)
- Store Locations: 6,217 at quarter end, increasing by 188 over the last 12 months
- Market Capitalization: $64.48 billion
Serving both the DIY customer and professional mechanic, O’Reilly Automotive (NASDAQ:ORLY) is an auto parts and accessories retailer that sells everything from fuel pumps to car air fresheners to mufflers.
The company understands that DIY customers may have varying levels of expertise in auto repair, so stores feature automotive expert sales associates who can help you find which muffler will best fit your 2021 Mazda CX-5, for example.
For the professional mechanic, O’Reilly offers programs and services designed to help professional mechanics grow their businesses and increase profits. For example, volume discounts on parts and tools, extended warranties, and access to training and technical support resources are highly valued by professional customers.
O’Reilly has a national presence in the US, but it is particularly strong in the Western states. The typical store is roughly 7,000 to 10,000 square feet, organized by product category for easy shopping. In addition to its brick-and-mortar stores, O’Reilly also has an e-commerce site, not coincidentally launched in 1999, the same year as competitors AutoZone and Advance Auto Parts. The site allows customers to buy products to be shipped to their homes or to buy and pick up at the nearest store for convenience and optionality.
Auto Parts Retailer
Cars are complex machines that need maintenance and occasional repairs, and auto parts retailers cater to the professional mechanic as well as the do-it-yourself (DIY) fixer. Work on cars may entail replacing fluids, parts, or accessories, and these stores have the parts and accessories or these jobs. While e-commerce competition presents a risk, these stores have a leg up due to the combination of broad and deep selection as well as expertise provided by sales associates. Another change on the horizon could be the increasing penetration of electric vehicles.
Competitors offering auto parts and accessories include AutoZone (NYSE:AZO), Advance Auto Parts (NYSE:AAP), Genuine Parts (NYSE:GPC), and private company Pep Boys.Sales Growth
O'Reilly is larger than most consumer retail companies and benefits from economies of scale, giving it an edge over its competitors.
As you can see below, the company's annualized revenue growth rate of 10.7% over the last five years was decent as it opened new stores and grew sales at existing, established stores.
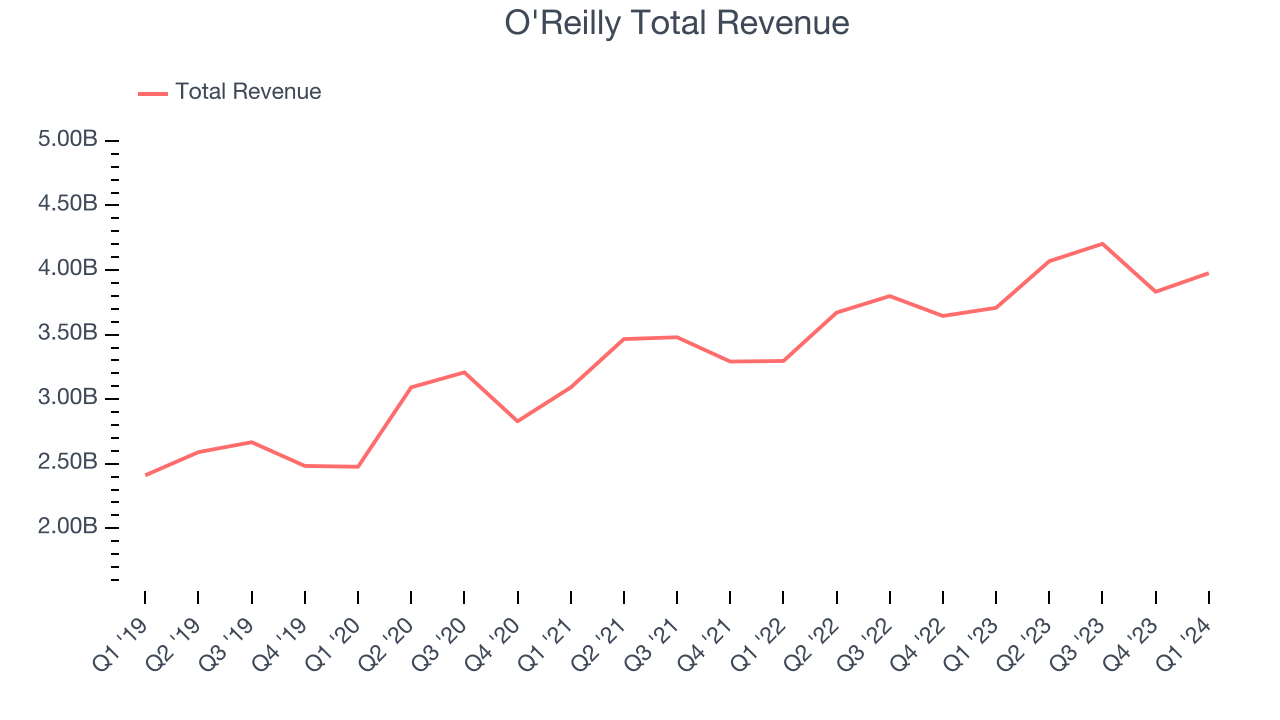
This quarter, O'Reilly's revenue grew 7.2% year on year to $3.98 billion, missing Wall Street's expectations. Looking ahead, Wall Street expects sales to grow 6.8% over the next 12 months, a deceleration from this quarter.
Same-Store Sales
O'Reilly's demand within its existing stores has generally risen over the last two years but lagged behind the broader consumer retail sector. On average, the company's same-store sales have grown by 7% year on year. With positive same-store sales growth amid an increasing physical footprint of stores, O'Reilly is reaching more customers and growing sales.
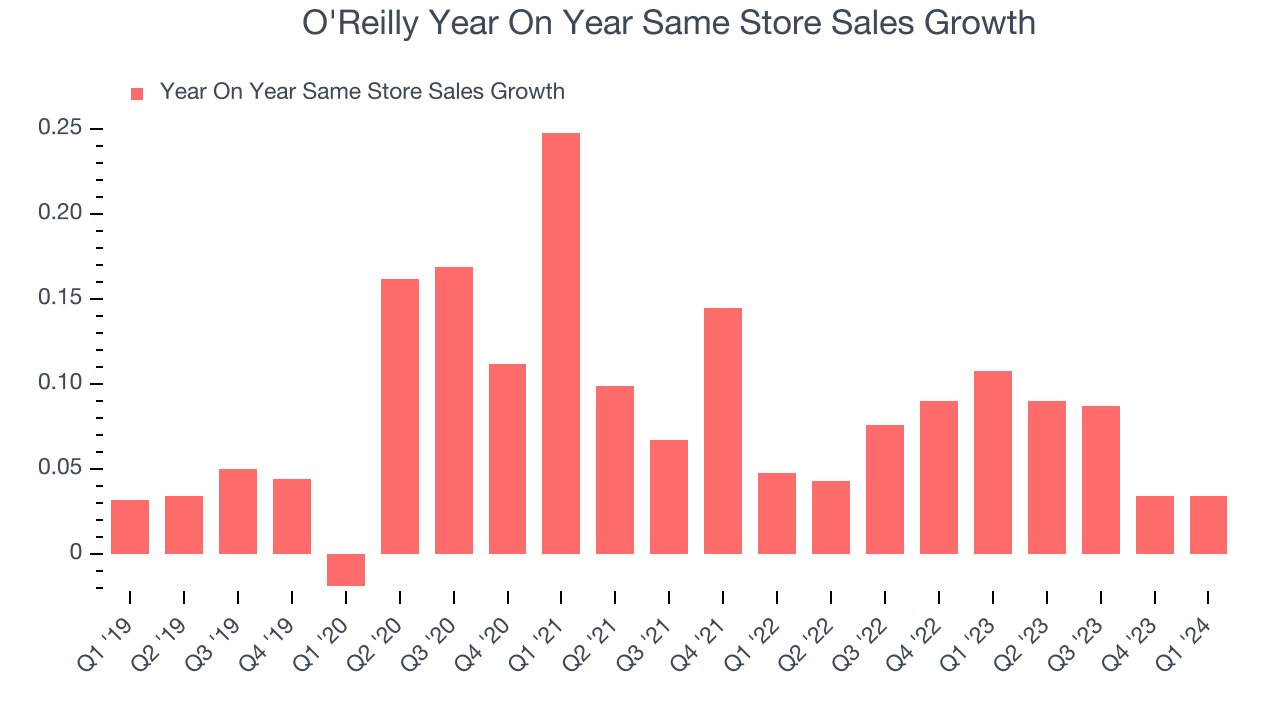
In the latest quarter, O'Reilly's same-store sales rose 3.4% year on year. By the company's standards, this growth was a meaningful deceleration from the 10.8% year-on-year increase it posted 12 months ago. We'll be watching O'Reilly closely to see if it can reaccelerate growth.
Number of Stores
A retailer's store count is a crucial factor influencing how much it can sell, and store growth is a critical driver of how quickly its sales can grow.
When a retailer like O'Reilly is opening new stores, it usually means it's investing for growth because demand is greater than supply. O'Reilly's store count increased by 188 locations, or 3.1%, over the last 12 months to 6,217 total retail locations in the most recently reported quarter.
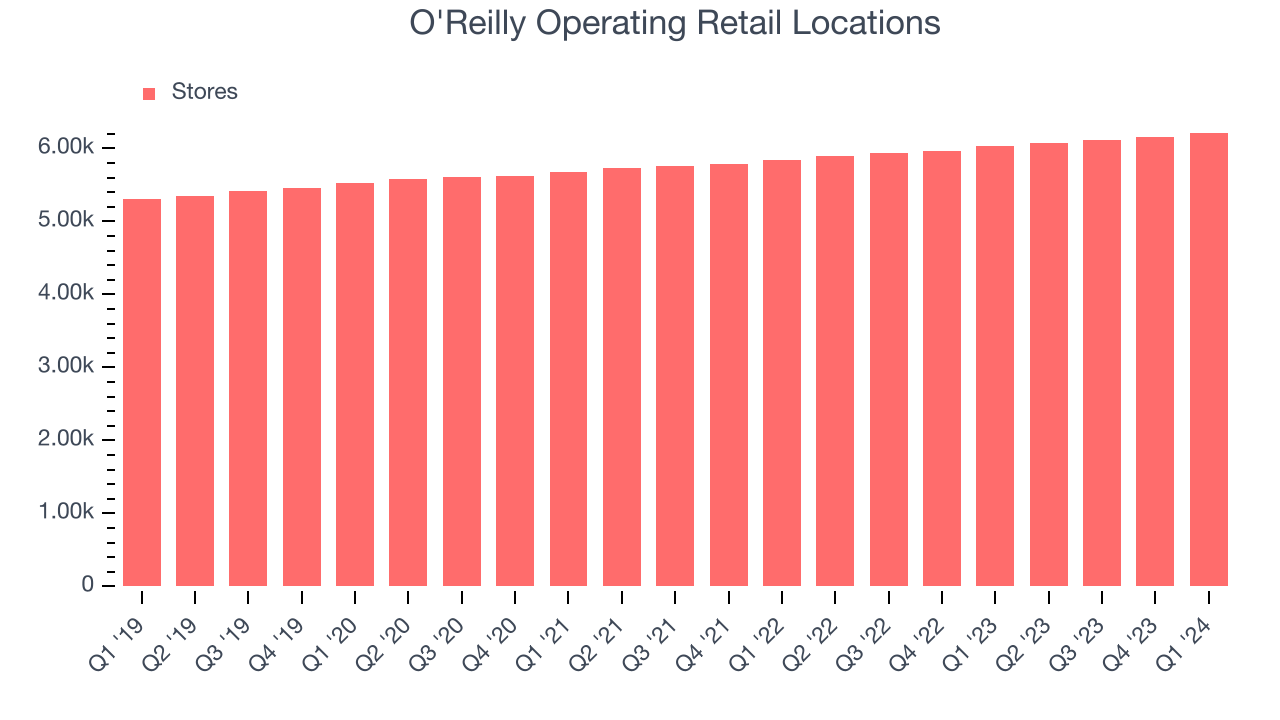
Over the last two years, the company has generally opened new stores and averaged 3.1% annual growth in its physical footprint, which is decent and on par with the broader sector. With an expanding store base and demand, revenue growth can come from multiple vectors: sales from new stores, sales from e-commerce, or increased foot traffic and higher sales per customer at existing stores.
Gross Margin & Pricing Power
O'Reilly has best-in-class unit economics for a retailer, enabling it to invest in areas such as marketing and talent to stay one step ahead of the competition. As you can see below, it's averaged an exceptional 51.2% gross margin over the last two years. This means the company makes $0.51 for every $1 in revenue before accounting for its operating expenses.
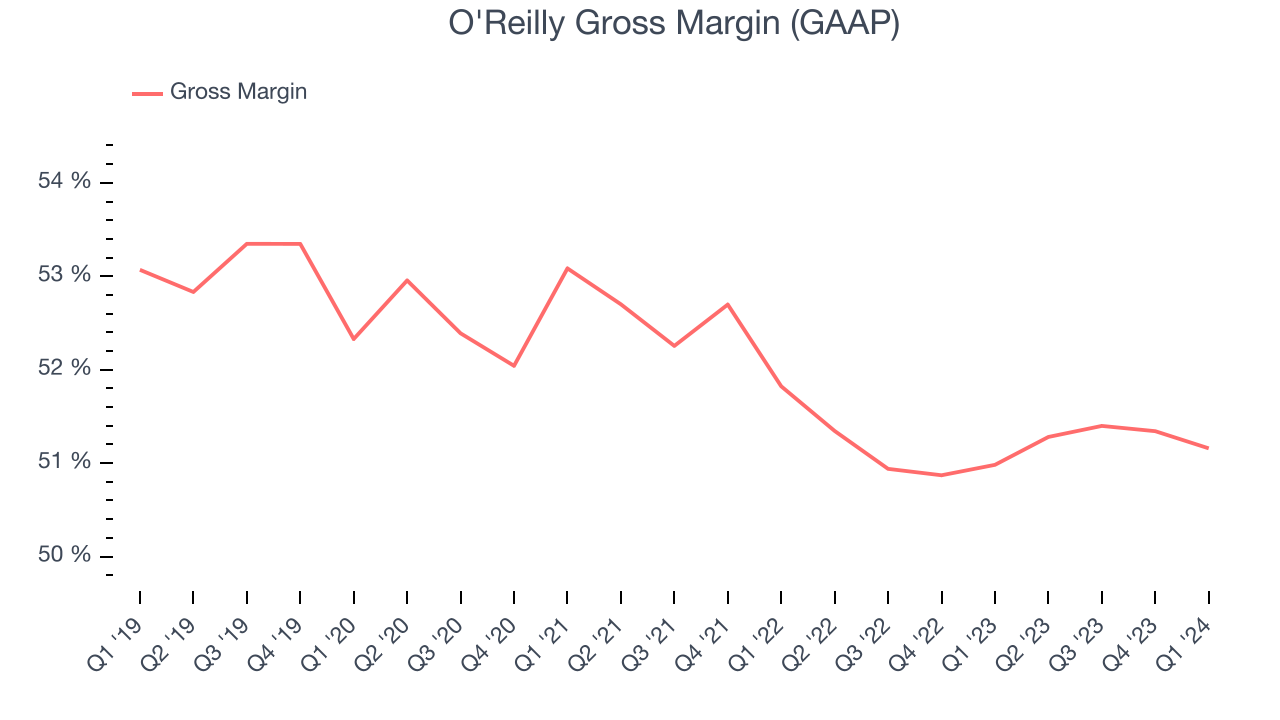
O'Reilly's gross profit margin came in at 51.2% this quarter, flat with the same quarter last year. This steady margin stems from its efforts to keep prices low for consumers and signals that it has stable input costs (such as freight expenses to transport goods).
Operating Margin
Operating margin is a key profitability metric for retailers because it accounts for all expenses keeping the lights on, including wages, rent, advertising, and other administrative costs.
This quarter, O'Reilly generated an operating profit margin of 18.9%, in line with the same quarter last year. This indicates the company's costs have been relatively stable.
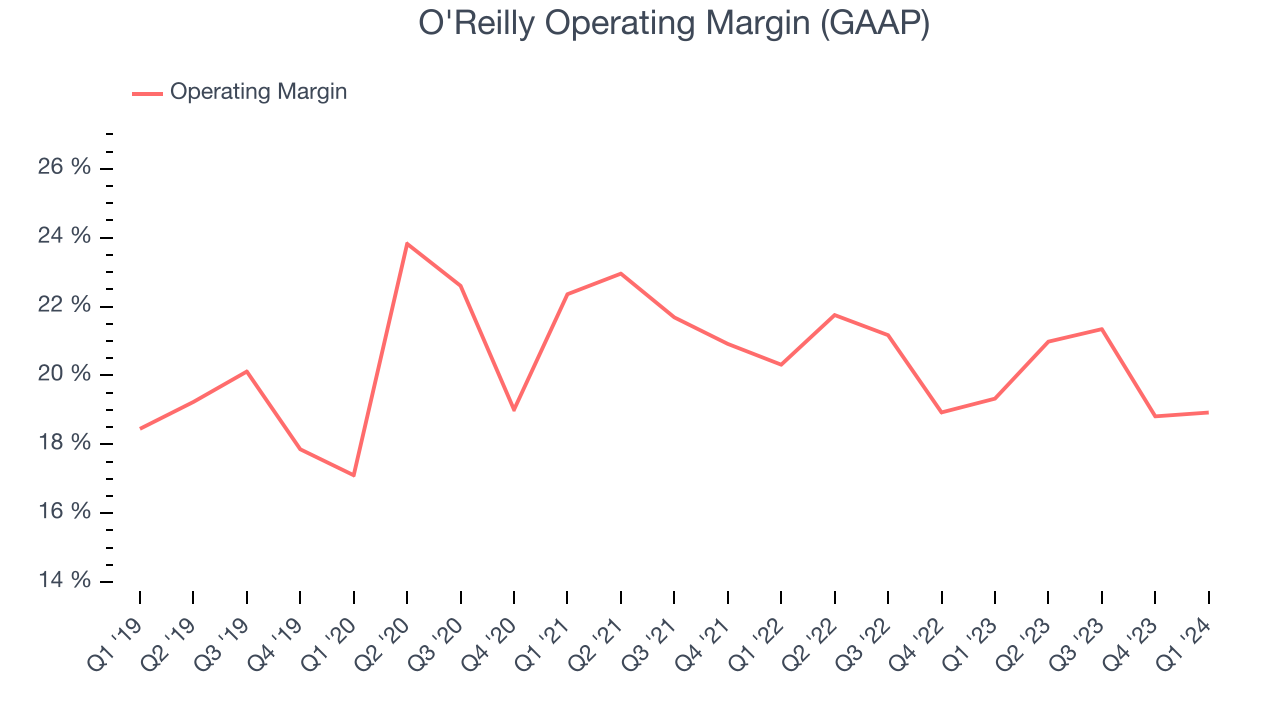 Zooming out, O'Reilly has been a well-managed company over the last two years. It's demonstrated elite profitability for a consumer retail business, boasting an average operating margin of 20.2%. On top of that, its margin has remained more or less the same, highlighting the consistency of its business.
 EPS
Earnings growth is a critical metric to track, but for long-term shareholders, earnings per share (EPS) is more telling because it accounts for dilution and share repurchases.
In Q1, O'Reilly reported EPS at $9.20, up from $8.28 in the same quarter a year ago. This print unfortunately missed Wall Street's estimates, but we care more about long-term EPS growth rather than short-term movements.
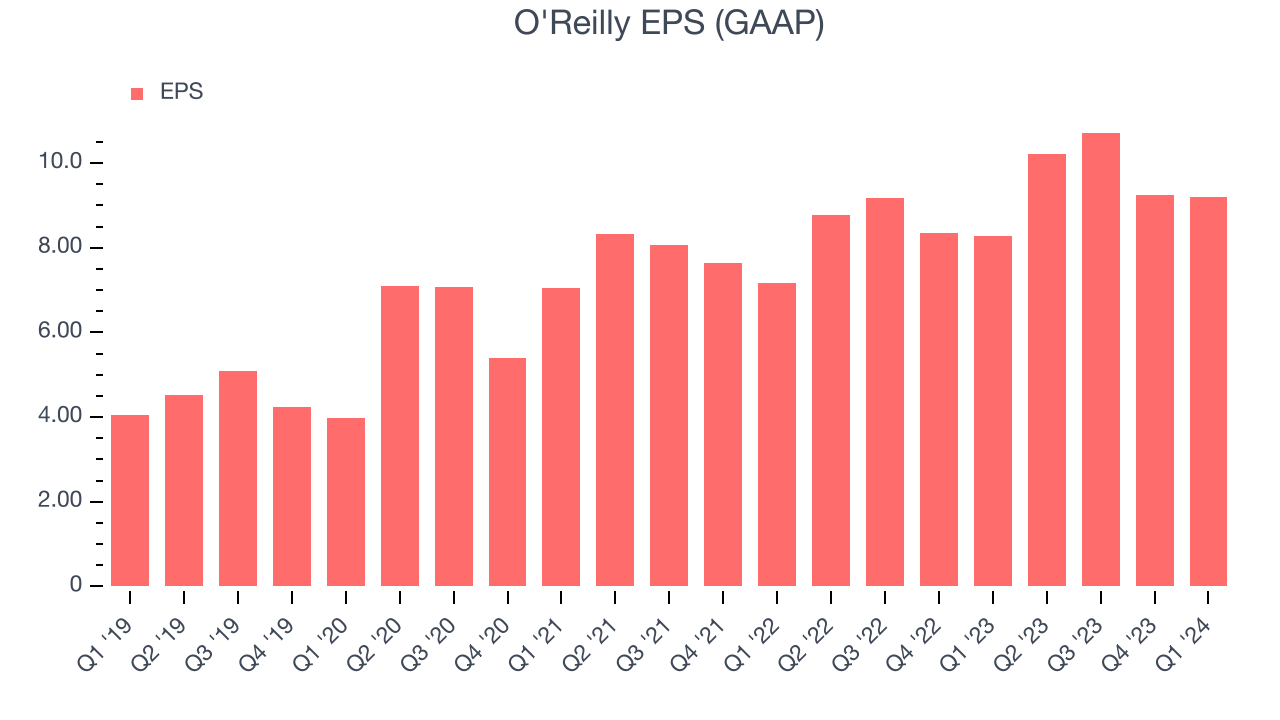
Wall Street expects the company to continue growing earnings over the next 12 months, with analysts projecting an average 10.7% year-on-year increase in EPS.
Cash Is King
If you've followed StockStory for a while, you know that we emphasize free cash flow. Why, you ask? We believe in the end, cash is king, and you can't use accounting profits to pay the bills.
O'Reilly's free cash flow came in at $438.9 million in Q1, down 9.7% year on year. This result represents a 11% margin.
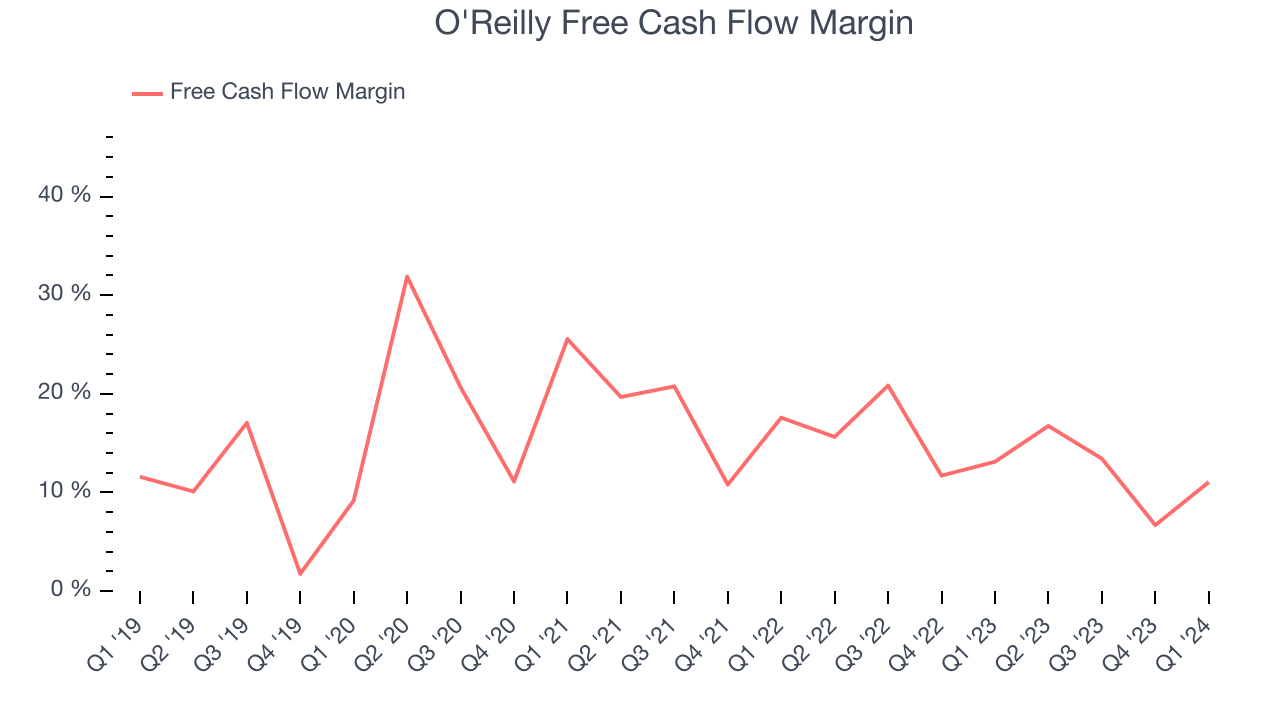
Over the last eight quarters, O'Reilly has shown terrific cash profitability, enabling it to reinvest, return capital to investors, and stay ahead of the competition while maintaining a robust cash balance. The company's free cash flow margin has been among the best in consumer retail, averaging 13.7%. However, its margin has averaged year-on-year declines of 3.3 percentage points. If this trend continues, it could signal that the business is becoming slightly more capital-intensive.
Return on Invested Capital (ROIC)
EPS and free cash flow tell us whether a company was profitable while growing revenue. But was it capital-efficient? A company’s ROIC explains this by showing how much operating profit a company makes compared to how much money the business raised (debt and equity).
O'Reilly's five-year average ROIC was 38.7%, placing it among the best retail companies. Just as you’d like your investment dollars to generate returns, O'Reilly's invested capital has produced excellent profits.
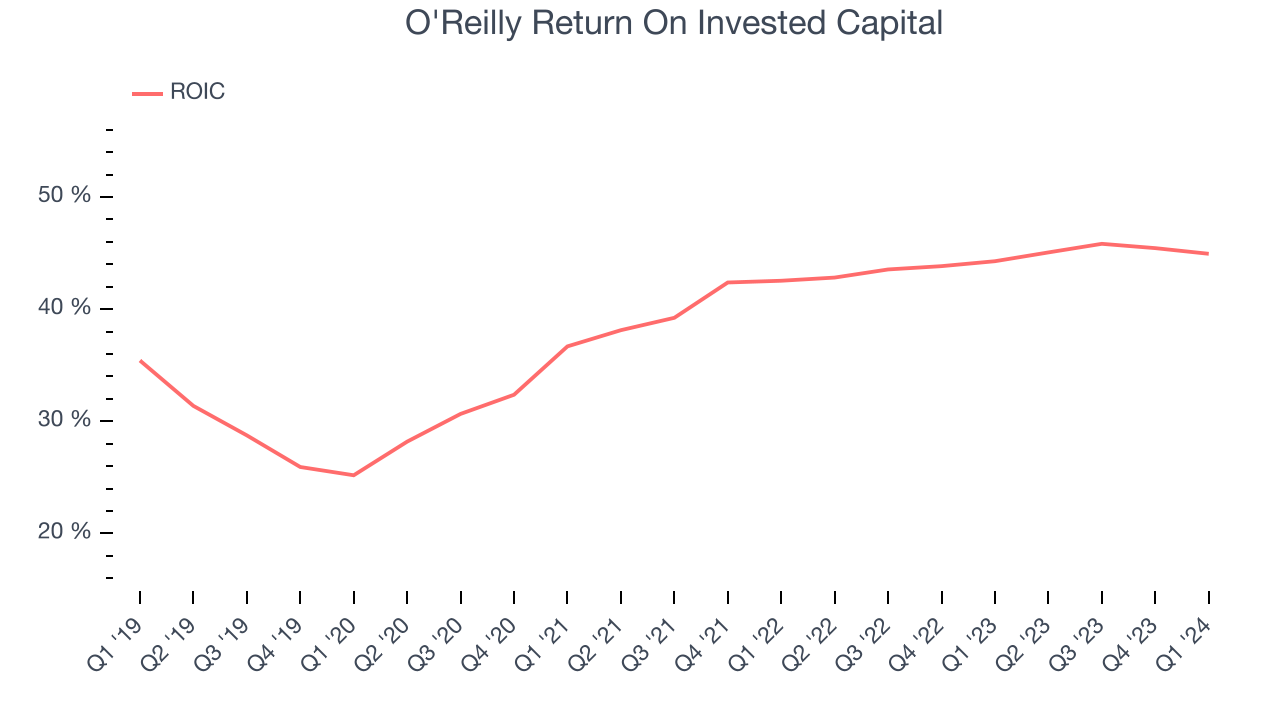
The trend in its ROIC, however, is often what surprises the market and drives the stock price. Over the last few years, O'Reilly's ROIC averaged 13.7 percentage point increases. The company has historically shown the ability to generate good returns, and its rising ROIC is a great sign. It could suggest its competitive advantage or profitable business opportunities are expanding.
Balance Sheet Risk
Debt is a tool that can boost company returns but presents risks if used irresponsibly.
O'Reilly reported $89.26 million of cash and $7.59 billion of debt on its balance sheet in the most recent quarter. As investors in high-quality companies, we primarily focus on two things: 1) that a company's debt level isn't too high and 2) that its interest payments are not excessively burdening the business.
With $3.24 billion of EBITDA over the last 12 months, we view O'Reilly's 2.3x net-debt-to-EBITDA ratio as safe. We also see its $97.57 million of annual interest expenses as appropriate. The company's profits give it plenty of breathing room, allowing it to continue investing in new initiatives.
Key Takeaways from O'Reilly's Q1 Results
We struggled to find many strong positives in these results. Same store sales missed, leading to a revenue miss. While gross margin was roughly in line with expectations, EPS missed. Additionally, the company's full-year earnings forecast was underwhelming. Overall, the results could have been better. The company is down 3.3% on the results and currently trades at $1,054.85 per share.
Is Now The Time?
O'Reilly may have had a tough quarter, but investors should also consider its valuation and business qualities when assessing the investment opportunity.
There are several reasons why we think O'Reilly is a great business. For starters, its revenue growth has been decent over the last five years. On top of that, its impressive gross margins are a wonderful starting point for the overall profitability of the business, and its impressive operating margins show it has a highly efficient business model.
O'Reilly's price-to-earnings ratio based on the next 12 months is 25.0x. Looking at the consumer landscape today, O'Reilly's qualities stand out and we still like it at this price.
Wall Street analysts covering the company had a one-year price target of $1,144 per share right before these results (compared to the current share price of $1,055).
To get the best start with StockStory, check out our most recent stock picks, and then sign up to our earnings alerts by adding companies to your watchlist here. We typically have the quarterly earnings results analyzed within seconds of the data being released, and especially for companies reporting pre-market, this often gives investors the chance to react to the results before the market has fully absorbed the information.