
Multinational media and entertainment corporation Paramount (NASDAQ:PARA) missed analysts' expectations in Q1 CY2024, with revenue up 5.8% year on year to $7.69 billion. It made a non-GAAP profit of $0.62 per share, improving from its profit of $0.11 per share in the same quarter last year.
Paramount (PARA) Q1 CY2024 Highlights:
- Revenue: $7.69 billion vs analyst estimates of $7.74 billion (0.7% miss)
- EPS (non-GAAP): $0.62 vs analyst estimates of $0.36 (73.7% beat)
- Gross Margin (GAAP): 32.9%, up from 31.7% in the same quarter last year
- Free Cash Flow of $209 million, down 52.8% from the previous quarter
- Market Capitalization: $8.36 billion
Owner of Spongebob Squarepants and formerly known as ViacomCBS, Paramount Global (NASDAQ:PARA) is a major media conglomerate offering television, film production, and digital content across various global platforms.
Paramount was born through the 2019 merger of Viacom and CBS, which brought together two industry giants to create a diversified media conglomerate. This strategic move was aimed at enhancing their capabilities in cable networks, film studios, and broadcast television, positioning them to compete effectively in the evolving entertainment market.
Paramount delivers a broad spectrum of services, including television and film production, cable network operations, and digital streaming services. Its multi-platform approach ensures versatility and widespread reach in the media landscape.
The company generates revenue from advertising, subscription fees, content licensing, and theatrical releases. Paramount's extensive content portfolio, including popular networks such as CBS and film franchises like Star Trek, appeals to a broad audience, making it a relevant player in the media and entertainment industry.
Broadcasting
Broadcasting companies have been facing secular headwinds in the form of consumers abandoning traditional television and radio in favor of streaming services. As a result, many broadcasting companies have evolved by forming distribution agreements with major streaming platforms so they can get in on part of the action, but will these subscription revenues be as high quality and high margin as their legacy revenues? Only time will tell which of these broadcasters will survive the sea changes of technological advancement and fragmenting consumer attention.
Competitors in the media and entertainment production industry include Disney (NYSE:DIS), Warner Bros. Discovery (NASDAQ:WBD), and Comcast (NASDAQ:CMCSA).Sales Growth
A company's long-term performance can indicate its business quality. Any business can enjoy short-lived success, but best-in-class ones sustain growth over many years. Paramount's annualized revenue growth rate of 1.9% over the last five years was weak for a consumer discretionary business. 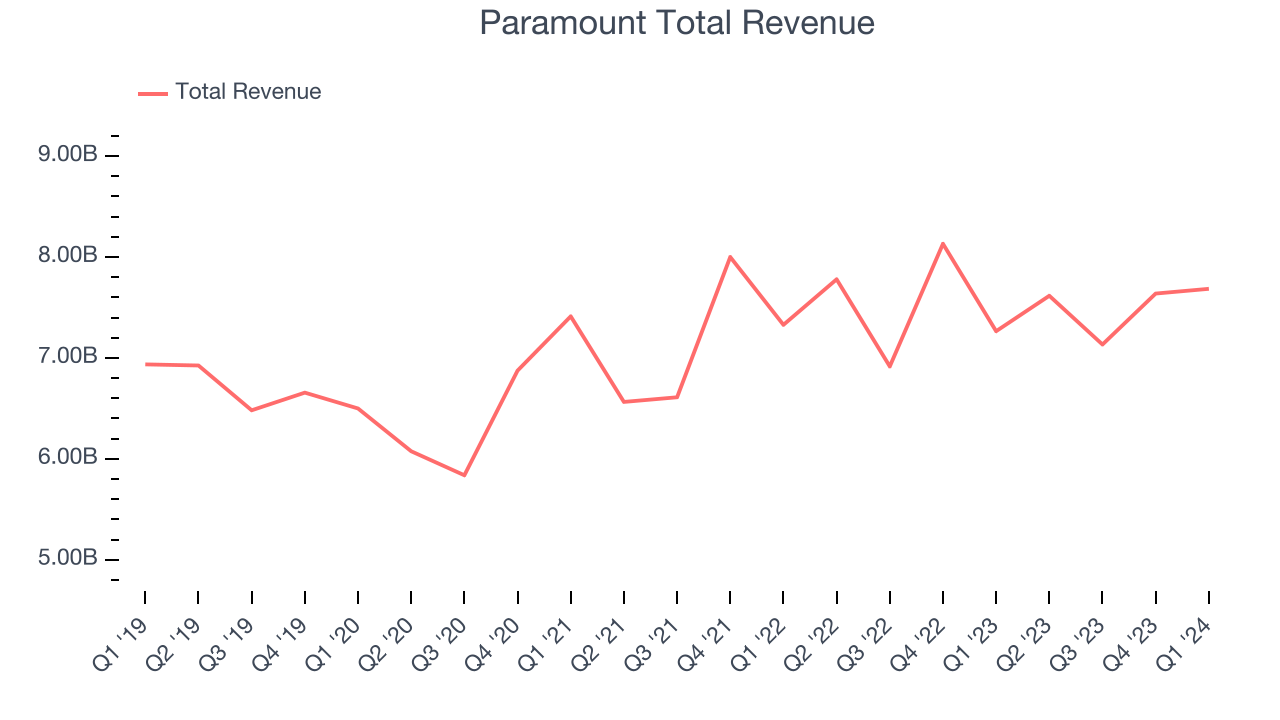 Within consumer discretionary, product cycles are short and revenue can be hit-driven due to rapidly changing trends. That's why we also follow short-term performance. Paramount's annualized revenue growth of 2.7% over the last two years aligns with its five-year revenue growth, suggesting the company's demand has been stable.
We can better understand the company's revenue dynamics by analyzing its three most important segments: TV Media, Direct-to-Consumer, and Filmed Entertainment, which are 68.1%, 24.5%, and 7.9% of revenue. Over the last two years, Paramount's TV Media revenue (broadcasting) averaged 5% year-on-year declines, but its Direct-to-Consumer (streaming) and Filmed Entertainment (movies) revenues averaged 37.3% and 18.7% growth.
This quarter, Paramount's revenue grew 5.8% year on year to $7.69 billion, missing Wall Street's estimates. Looking ahead, Wall Street expects sales to grow 1.3% over the next 12 months, a deceleration from this quarter.
Operating Margin
Operating margin is an important measure of profitability. It’s the portion of revenue left after accounting for all core expenses–everything from the cost of goods sold to advertising and wages. Operating margin is also useful for comparing profitability across companies with different levels of debt and tax rates because it excludes interest and taxes.
Paramount was profitable over the last eight quarters but held back by its large expense base. Its average operating margin of 1.2% has been among the worst in the consumer discretionary sector.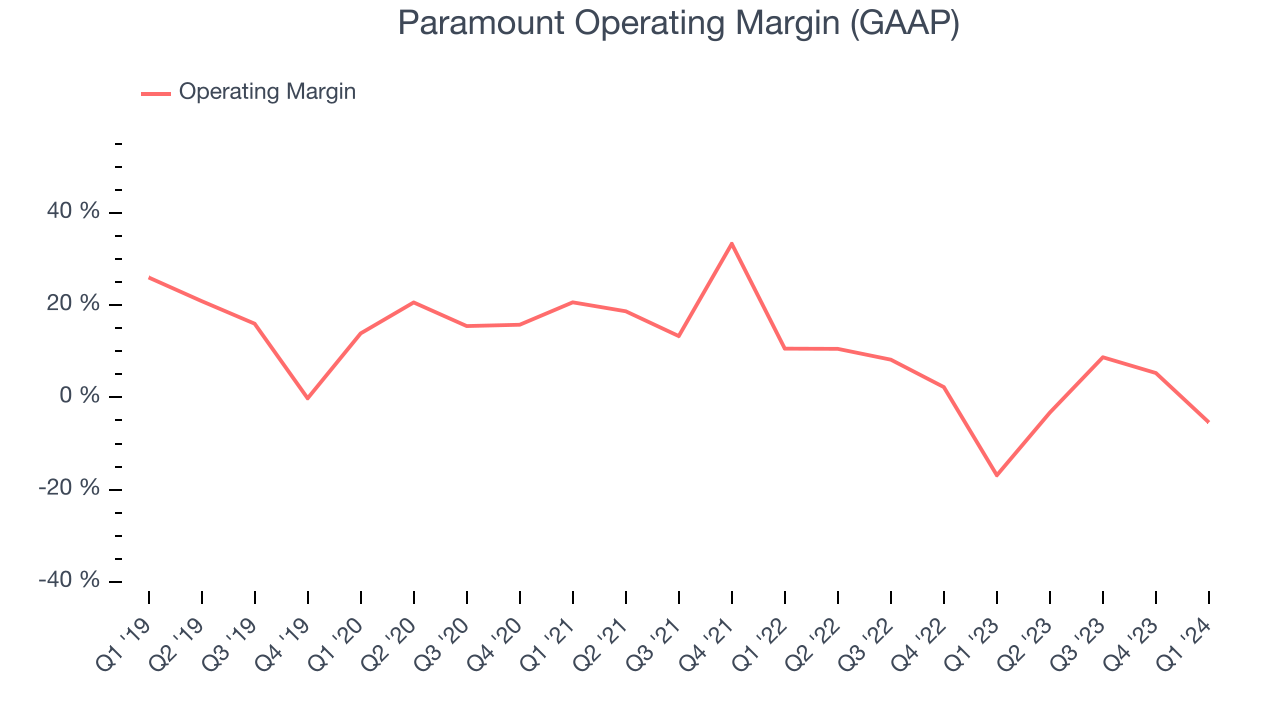
This quarter, Paramount generated an operating profit margin of negative 5.4%, up 11.4 percentage points year on year.
Over the next 12 months, Wall Street expects Paramount to become more profitable. Analysts are expecting the company’s LTM operating margin of 1.2% to rise to 7.7%.EPS
We track long-term historical earnings per share (EPS) growth for the same reason as long-term revenue growth. Compared to revenue, however, EPS highlights whether a company's growth was profitable. 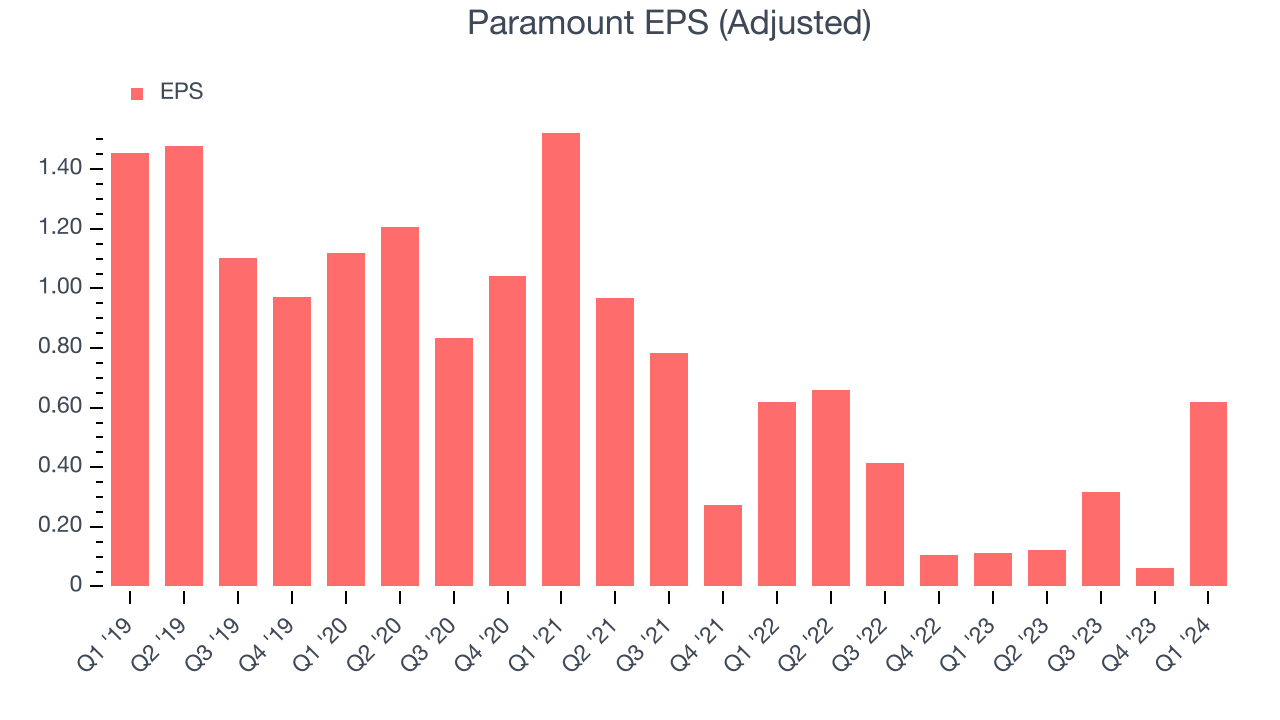
Over the last five years, Paramount's EPS dropped 249%, translating into 28.4% annualized declines. We tend to steer our readers away from companies with falling EPS, where diminishing earnings could imply changing secular trends or consumer preferences. Consumer discretionary companies are particularly exposed to this, leaving a low margin of safety around the company (making the stock susceptible to large downward swings).
In Q1, Paramount reported EPS at $0.62, up from $0.11 in the same quarter last year. This print beat analysts' estimates by 73.7%. Over the next 12 months, Wall Street expects Paramount to perform poorly. Analysts are projecting its LTM EPS of $1.12 to shrink by 2.2% to $1.10.
Cash Is King
If you've followed StockStory for a while, you know we emphasize free cash flow. Why, you ask? We believe that in the end, cash is king, and you can't use accounting profits to pay the bills.
Over the last two years, Paramount broke even from a free cash flow perspective, subpar for a consumer discretionary business.
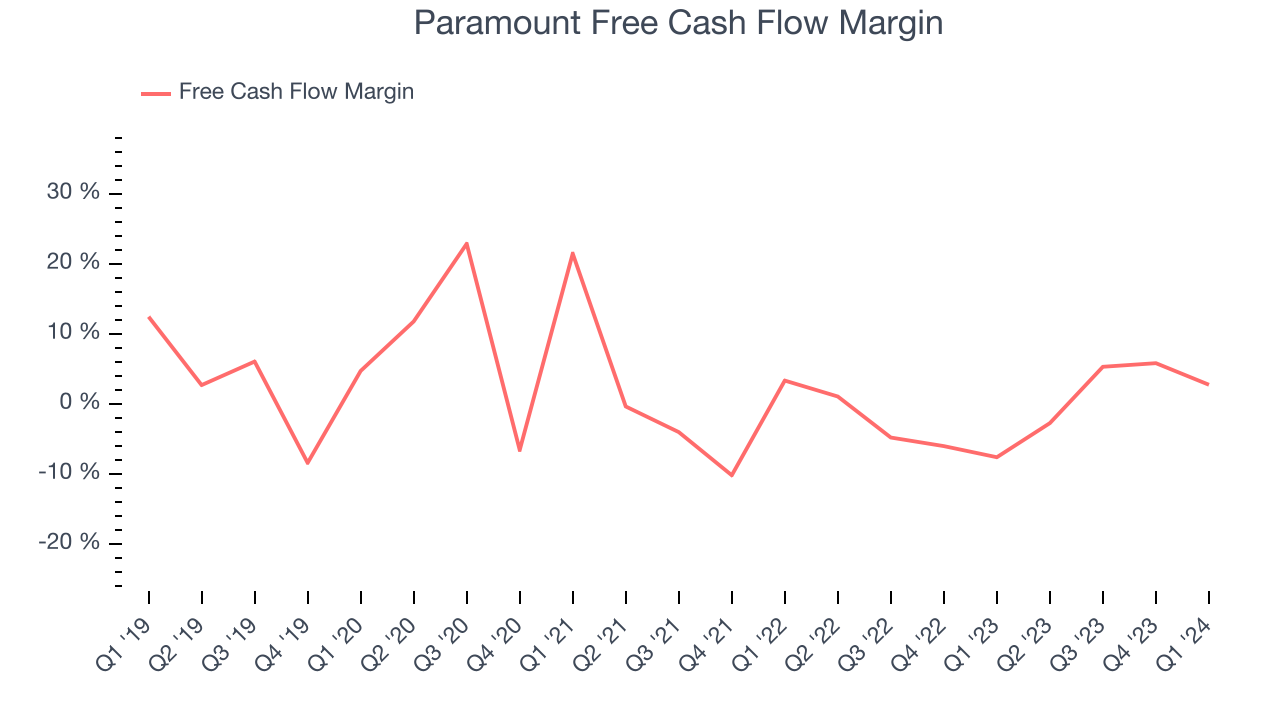
Paramount's free cash flow came in at $209 million in Q1, equivalent to a 2.7% margin. This result was great for the business as it flipped from cash flow negative in the same quarter last year to cash flow positive this quarter. Over the next year, analysts predict Paramount's cash profitability will fall to break even. Their consensus estimates imply its LTM free cash flow margin of 2.7% will decrease by 2 percentage points.
Return on Invested Capital (ROIC)
EPS and free cash flow tell us whether a company was profitable while growing revenue. But was it capital-efficient? Enter ROIC, a metric showing how much operating profit a company generates relative to how much money the business raised (debt and equity).
Paramount's five-year average return on invested capital was 10.7%, somewhat low compared to the best consumer discretionary companies that pump out 25%+. Its returns suggest it historically did a subpar job investing in profitable business initiatives.
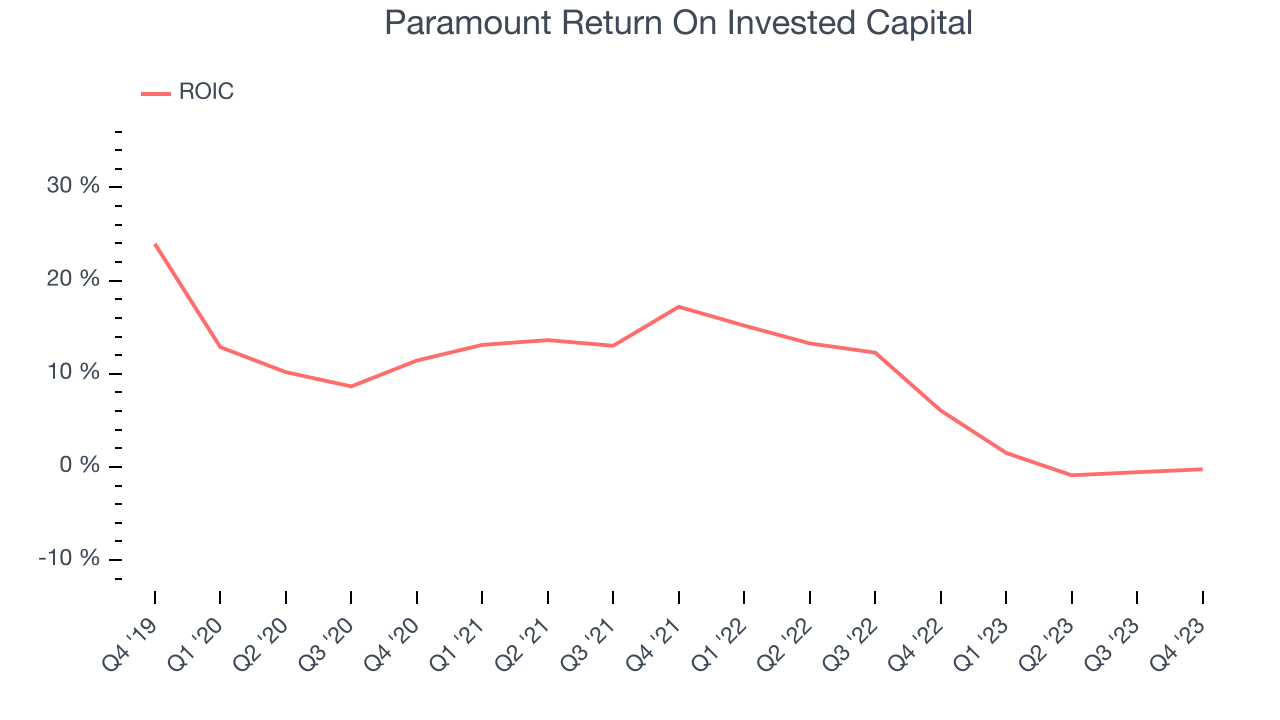
The trend in its ROIC, however, is often what surprises the market and drives the stock price. Unfortunately, Paramount's ROIC averaged 4.6 percentage point decreases over the last few years. Paired with its already low returns, these declines suggest the company's profitable business opportunities are few and far between.
Balance Sheet Risk
As long-term investors, the risk we care most about is the permanent loss of capital. This can happen when a company goes bankrupt or raises money from a disadvantaged position and is separate from short-term stock price volatility, which we are much less bothered by.
Key Takeaways from Paramount's Q1 Results
It was good to see Paramount's EPS and free cash flow beat Wall Street's estimates. On the other hand, its revenue fell short of expectations as its TV media and filmed entertainment segments performed poorly. Overall, the results could have been better. The stock is flat after reporting and currently trades at $12.29 per share.
Is Now The Time?
When considering an investment in Paramount, investors should take into account its valuation and business qualities as well as what's happened in the latest quarter.
We cheer for all companies serving consumers, but in the case of Paramount, we'll be cheering from the sidelines. Its revenue growth has been weak over the last five years, and analysts expect growth to deteriorate from here. On top of that, its declining EPS over the last five years makes it hard to trust, and its cash burn raises the question of whether it can sustainably maintain growth.
Paramount's price-to-earnings ratio based on the next 12 months is 11.1x. While there are some things to like about Paramount and its valuation is reasonable, we think there are better opportunities elsewhere in the market right now.
Wall Street analysts covering the company had a one-year price target of $13.26 per share right before these results (compared to the current share price of $12.29).
To get the best start with StockStory, check out our most recent stock picks, and then sign up for our earnings alerts by adding companies to your watchlist here. We typically have the quarterly earnings results analyzed within seconds of the data being released, and especially for companies reporting pre-market, this often gives investors the chance to react to the results before the market has fully absorbed the information.