
Food and beverage company PepsiCo (NASDAQ:PEP) reported results in line with analysts' expectations in Q1 CY2024, with revenue up 2.3% year on year to $18.25 billion. It made a non-GAAP profit of $1.61 per share, improving from its profit of $1.50 per share in the same quarter last year.
PepsiCo (PEP) Q1 CY2024 Highlights:
- Revenue: $18.25 billion vs analyst estimates of $18.11 billion (small beat)
- EPS (non-GAAP): $1.61 vs analyst estimates of $1.52 (6% beat)
- Full year guidance maintained from previous, full year EPS (non-GAAP) guidance in line with Consensus
- Gross Margin (GAAP): 54.8%, in line with the same quarter last year
- Free Cash Flow was -$1.66 billion, down from $2.90 billion in the previous quarter
- Organic Revenue was up 2.7% year on year
- Sales Volumes were down 2% year on year
- Market Capitalization: $242.5 billion
With a history that goes back more than a century, PepsiCo (NASDAQ:PEP) is a household name in food and beverages today and best known for its flagship soda.
The company traces its roots to 1893 when a pharmacist from North Carolina named Caleb Bradham concocted a carbonated beverage, initially calling it "Brad's Drink." The soda was later renamed "Pepsi-Cola" because it contained pepsin (a digestive enzyme) and kola nuts. The next major milestone occurred in 1965, when Pepsi-Cola merged with Frito-Lay to create a combined company boasting both drinks and snacks.
Today, PepsiCo offers a diverse range of snacks and beverages through brands such as Lay's, Doritos, Cheetos, Gatorade, Mountain Dew, Tropicana, and Quaker Oats, to name a few. The core customer is therefore extremely broad–everyone from families to athletes to kids and adults alike. The company's products are widely available in grocery stores, supermarkets, convenience stores, restaurants, vending machines, and movie theaters globally. PepsiCo's strong distribution network is a differentiator and ensures that products are both easily accessible and visible in terms of shelf placement.
Pepsi will always be compared to and mentioned in the same breath as competitor Coca-Cola, but the company is iconic and unique in its own right due to its history and powerhouse portfolio of brands.
Beverages and Alcohol
These companies' performance is influenced by brand strength, marketing strategies, and shifts in consumer preferences. Changing consumption patterns are particularly relevant and can be seen in the explosion of alcoholic craft beer drinks or the steady decline of non-alcoholic sugary sodas. Companies that spend on innovation to meet consumers where they are with regards to trends can reap huge demand benefits while those who ignore trends can see stagnant volumes. Finally, with the advent of the social media, the cost of starting a brand from scratch is much lower, meaning that new entrants can chip away at the market shares of established players.
Competitors that offer beverages and snacks include Coca-Cola (NYSE:KO), Keurig Dr. Pepper (NASDAQ:KDP), Nestle (SWX:NESN), and Mondelez (NASDAQ:MDLZ).Sales Growth
PepsiCo is one of the most widely recognized consumer staples companies in the world. Its influence over consumers gives it extremely high negotiating leverage with distributors, enabling it to pick and choose where it sells its products (a luxury many don't have).
As you can see below, the company's annualized revenue growth rate of 8.8% over the last three years was decent despite consumers buying less of its products. We'll explore what this means in the "Volume Growth" section.
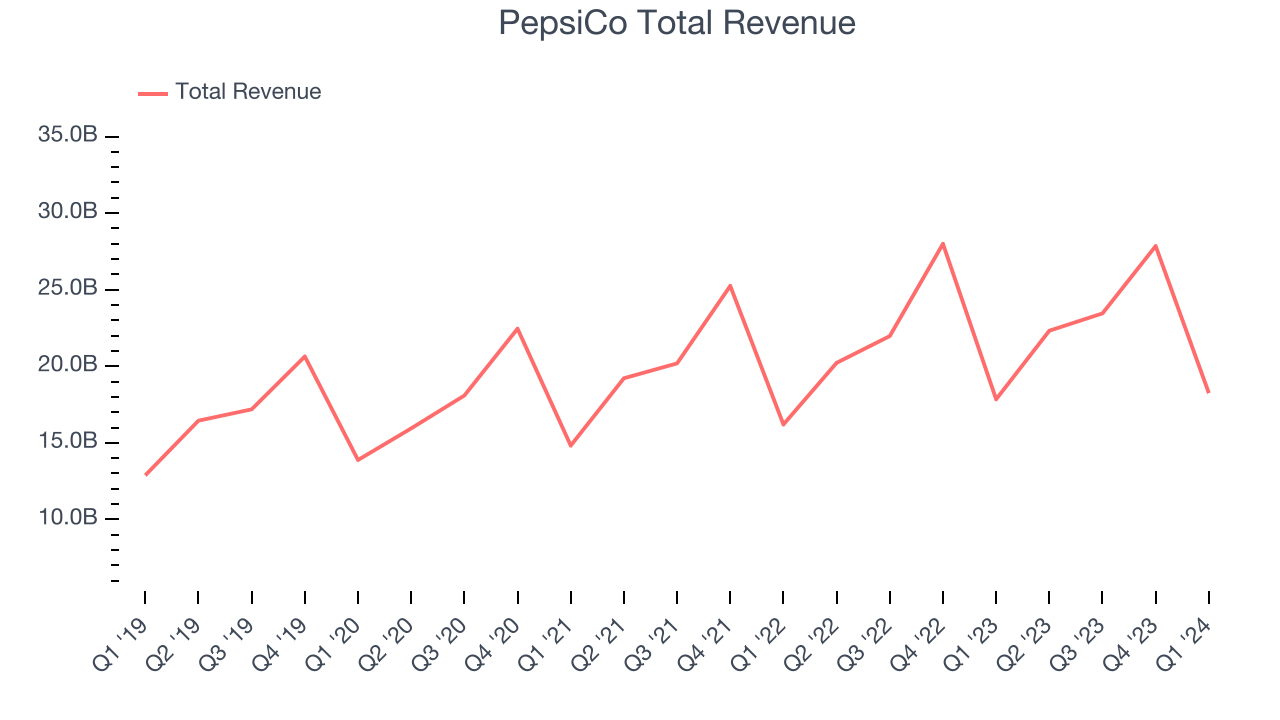
This quarter, PepsiCo grew its revenue by 2.3% year on year, and its $18.25 billion in revenue was in line with Wall Street's estimates. Looking ahead, Wall Street expects sales to grow 3.9% over the next 12 months, an acceleration from this quarter.
Volume Growth
Revenue growth can be broken down into changes in price and volume (the number of units sold). While both are important, volume is the lifeblood of a successful staples business as there’s a ceiling to what consumers will pay for everyday goods; they can always trade down to non-branded products if the branded versions are too expensive.
To analyze whether PepsiCo generated its growth from changes in price or volume, we can compare its volume growth to its organic revenue growth, which excludes non-fundamental impacts on company financials like mergers and currency fluctuations.
Over the last two years, PepsiCo's average quarterly sales volumes have shrunk by 1.9%. This decrease isn't ideal as the quantity demanded for consumer staples products is typically stable. Luckily, PepsiCo was able to offset fewer customers purchasing its products by charging higher prices, enabling it to generate 10.9% average organic revenue growth. We hope the company can grow its volumes soon, however, as consistent price increases (on top of inflation) aren't sustainable over the long term unless the business is really really special.
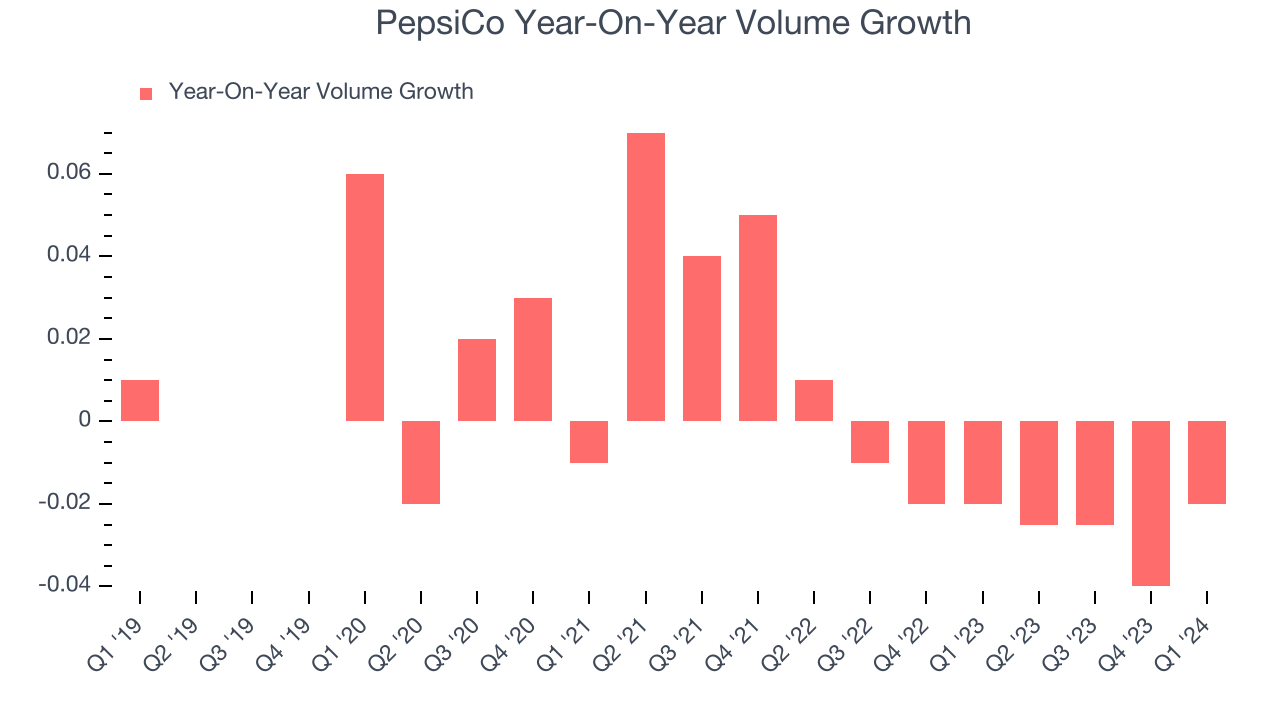
In PepsiCo's Q1 2024, sales volumes dropped 2% year on year. This result was a further deceleration from the 2% year-on-year decline it posted 12 months ago, showing the business is struggling to push its products.
Gross Margin & Pricing Power
All else equal, we prefer higher gross margins. They make it easier to generate more operating profits and indicate that a company commands pricing power by offering more differentiated products.
PepsiCo's gross profit margin came in at 54.8% this quarter, in line with the same quarter last year. That means for every $1 in revenue, $0.45 went towards paying for raw materials, production of goods, and distribution expenses.
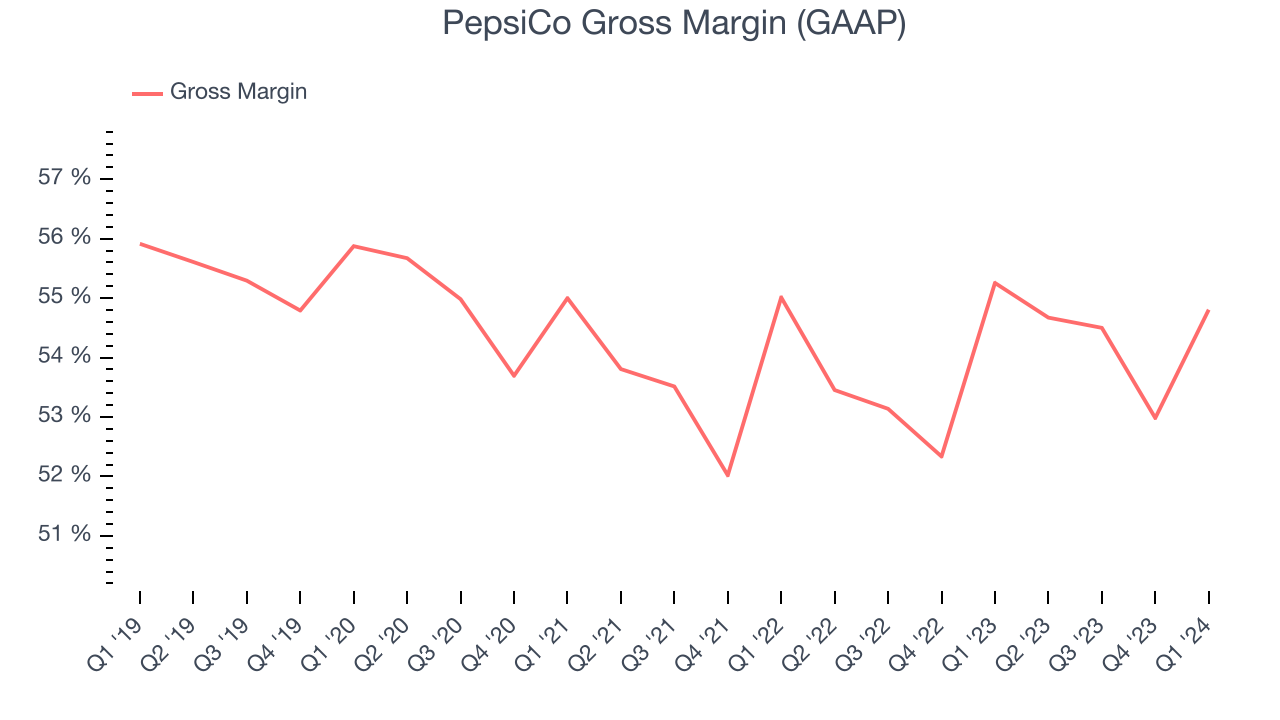
PepsiCo has best-in-class unit economics for a consumer staples company, enabling it to invest in areas such as marketing and talent to stay one step ahead of the competition. As you can see above, it's averaged an exceptional 53.8% gross margin over the last two years. Its margin has also been trending up over the last 12 months, averaging 1.3% year-on-year increases each quarter. If this trend continues, it could suggest a less competitive environment where the company has better pricing power and more favorable input costs (such as raw materials).
Operating Margin
Operating margin is an important measure of profitability accounting for key expenses such as marketing and advertising, IT systems, wages, and other administrative costs.
In Q1, PepsiCo generated an operating profit margin of 14.9%, in line with the same quarter last year. This indicates the company's costs have been relatively stable.
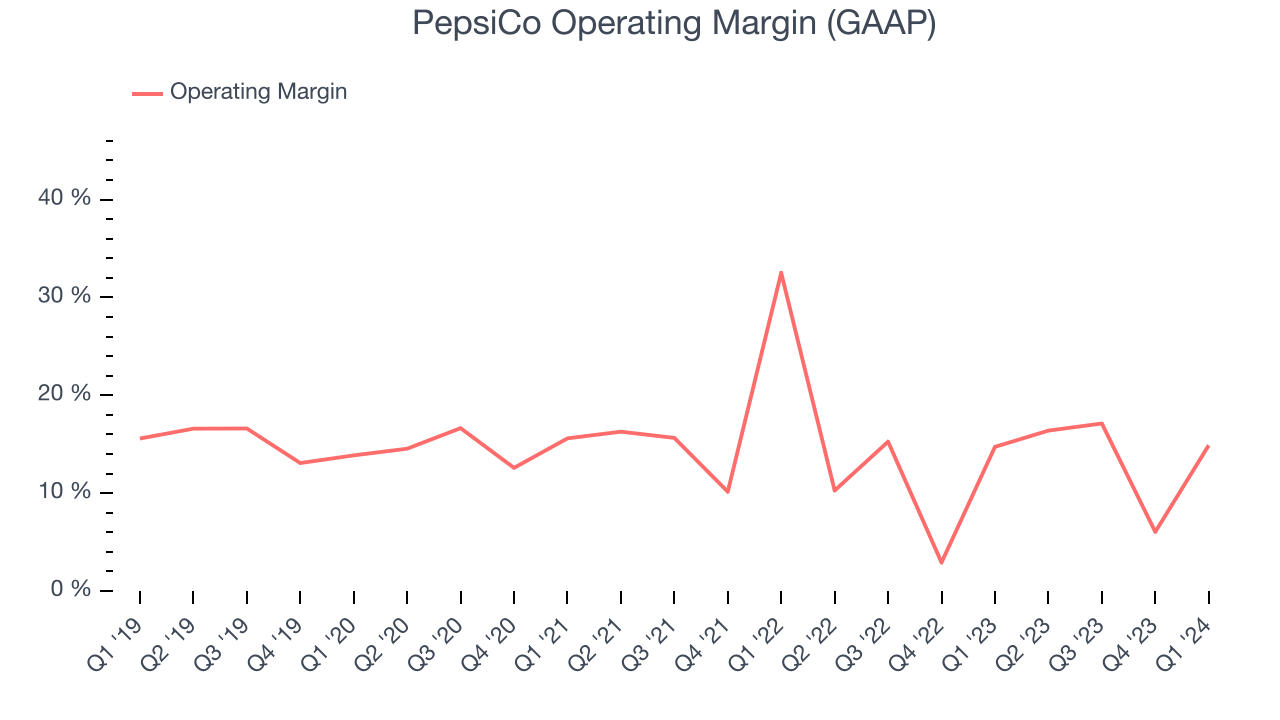 Zooming out, PepsiCo has done a decent job managing its expenses over the last eight quarters. The company has produced an average operating margin of 11.6%, higher than the broader consumer staples sector. On top of that, its margin has improved by 3.1 percentage points on average over the last year, a great sign for shareholders.
 EPS
These days, some companies issue new shares like there's no tomorrow. That's why we like to track earnings per share (EPS) because it accounts for shareholder dilution and share buybacks.
In Q1, PepsiCo reported EPS at $1.61, up from $1.50 in the same quarter a year ago. This print beat Wall Street's estimates by 6%.
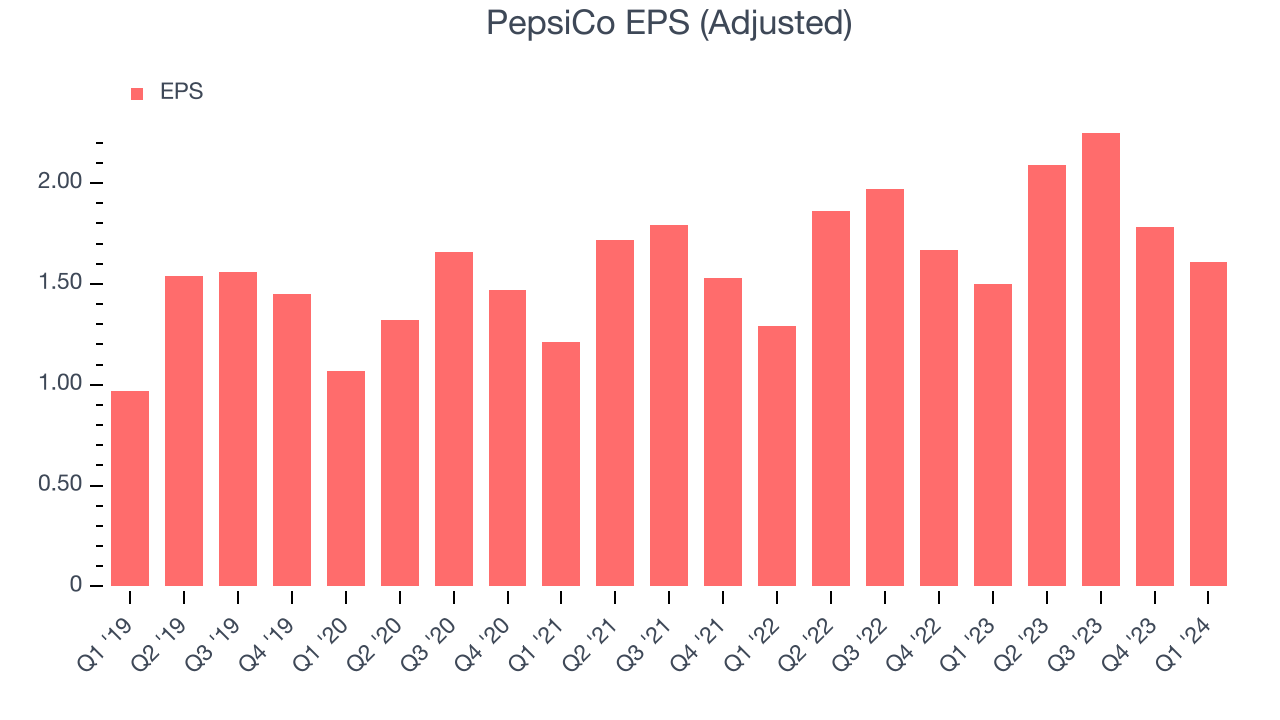
Between FY2021 and FY2024, PepsiCo's EPS grew 36.6%, translating into a solid 11% compounded annual growth rate.
Wall Street expects the company to continue growing earnings over the next 12 months, with analysts projecting an average 7.5% year-on-year increase in EPS.
Cash Is King
If you've followed StockStory for a while, you know we emphasize free cash flow. Why, you ask? We believe that in the end, cash is king, and you can't use accounting profits to pay the bills.
PepsiCo burned through $1.66 billion of cash in Q1, representing a negative 9.1% free cash flow margin. The company reduced its cash burn by 73.5% year on year.
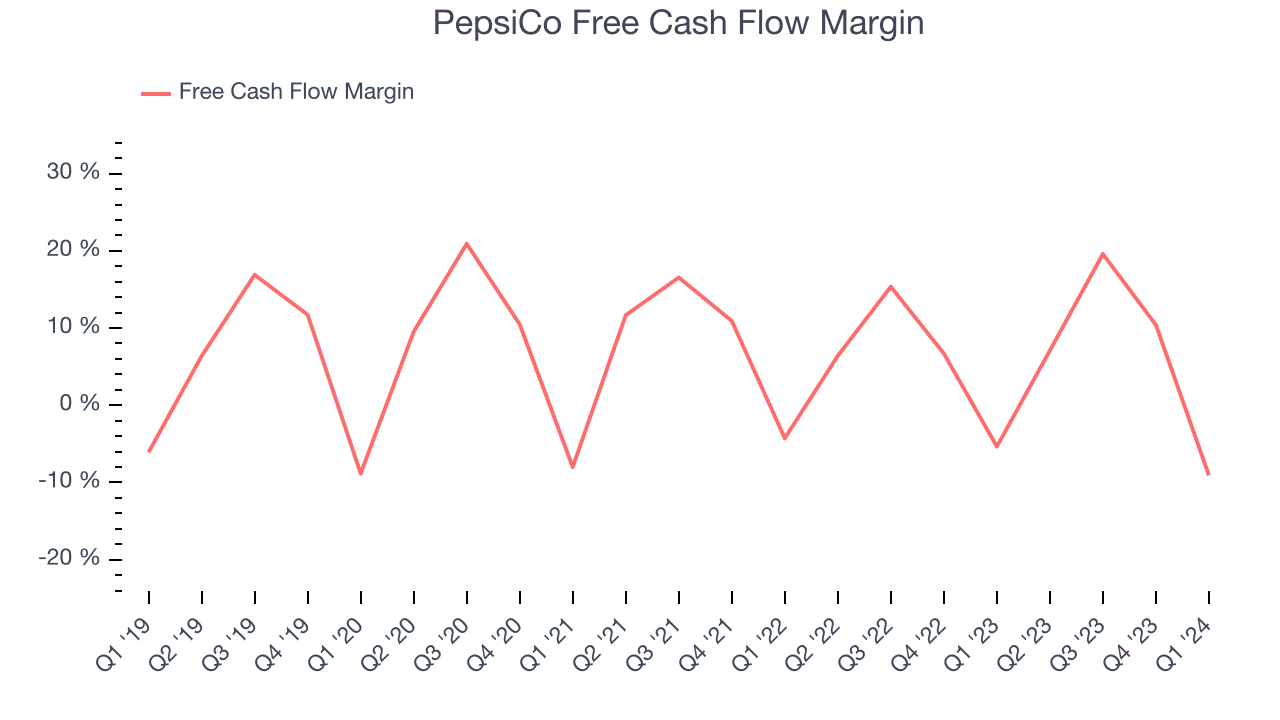
Over the last two years, PepsiCo has shown decent cash profitability, giving it some reinvestment opportunities. The company's free cash flow margin has averaged 7.2%, slightly better than the broader consumer staples sector. Furthermore, its margin has averaged year-on-year increases of 1.7 percentage points over the last 12 months. This likely pleases the company's investors.
Return on Invested Capital (ROIC)
EPS and free cash flow tell us whether a company was profitable while growing revenue. But was it capital-efficient? Enter ROIC, a metric showing how much operating profit a company generates relative to how much money the business raised (debt and equity).
PepsiCo's five-year average ROIC was 18.8%, higher than most consumer staples companies. Just as you’d like your investment dollars to generate returns, PepsiCo's invested capital has produced solid profits.
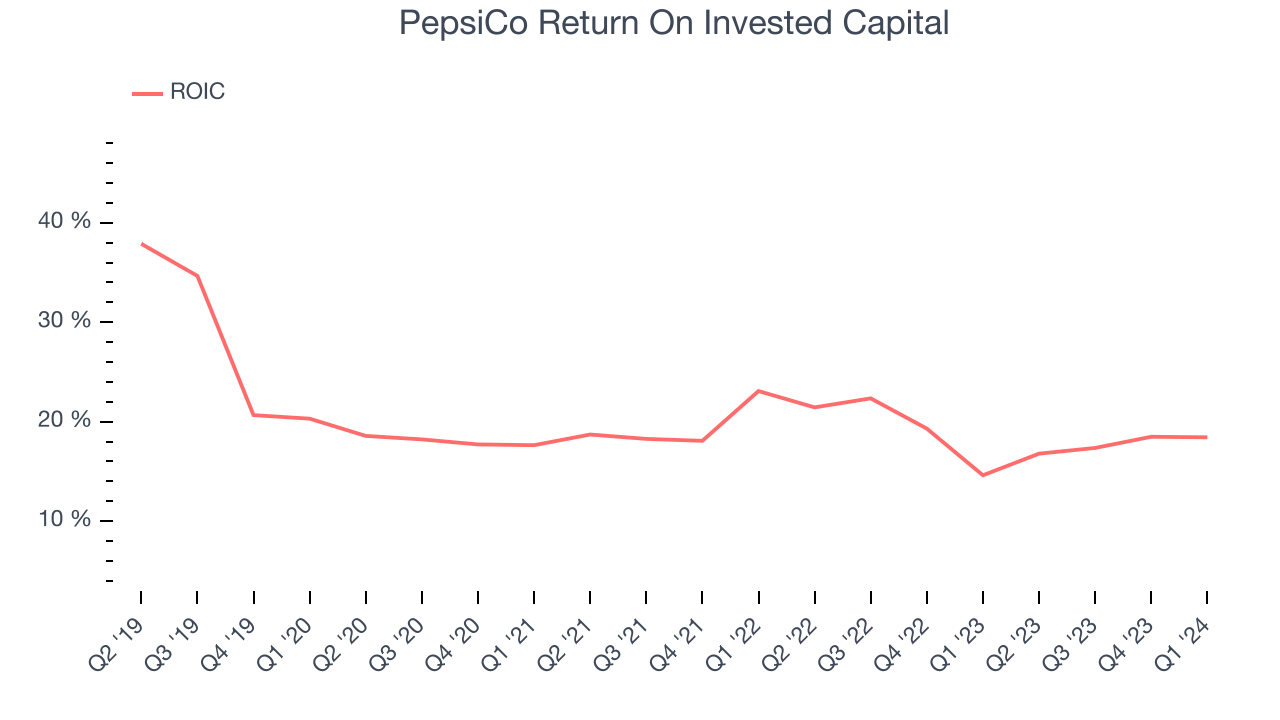
The trend in its ROIC, however, is often what surprises the market and drives the stock price. Unfortunately, PepsiCo's ROIC averaged 2.5 percentage point decreases over the last few years. The company has historically shown the ability to generate good returns, but they have gone the wrong way recently, making us a bit conscious.
Balance Sheet Risk
As long-term investors, the risk we care most about is the permanent loss of capital. This can happen when a company goes bankrupt or raises money from a disadvantaged position and is separate from short-term stock price volatility, which we are much less bothered by.
PepsiCo reported $8.35 billion of cash and $45.87 billion of debt on its balance sheet in the most recent quarter. As investors in high-quality companies, we primarily focus on two things: 1) that a company's debt level isn't too high and 2) that its interest payments are not excessively burdening the business.
With $16.79 billion of EBITDA over the last 12 months, we view PepsiCo's 2.2x net-debt-to-EBITDA ratio as safe. We also see its $858 million of annual interest expenses as appropriate. The company's profits give it plenty of breathing room, allowing it to continue investing in new initiatives.
Key Takeaways from PepsiCo's Q1 Results
We were impressed by how significantly PepsiCo blew past analysts' organic revenue growth expectations this quarter. We were also happy its EPS narrowly outperformed Wall Street's estimates. On the other hand, its operating margin missed analysts' expectations and its gross margin missed Wall Street's estimates. Looking ahead, guidance was maintained from previous, and specifically, the company's full year EPS guidance was in line with guidance. Zooming out, we think this was still a decent, albeit mixed, quarter, showing that the company is staying on track. The stock is flat after reporting and currently trades at $175.11 per share.
Is Now The Time?
PepsiCo may have had a favorable quarter, but investors should also consider its valuation and business qualities when assessing the investment opportunity.
We think PepsiCo is a solid business. First off, its revenue growth has been decent over the last three years. And while its shrinking sales volumes suggest it'll need to change its strategy to succeed, its scale gives it immense negotiating leverage with retailers. On top of that, its impressive gross margins are a wonderful starting point for the overall profitability of the business.
PepsiCo's price-to-earnings ratio based on the next 12 months is 21.2x. There are definitely things to like about PepsiCo, and looking at the consumer staples landscape right now, it seems to be trading at a reasonable price.
Wall Street analysts covering the company had a one-year price target of $186.73 per share right before these results (compared to the current share price of $175.11), implying they saw upside in buying PepsiCo in the short term.
To get the best start with StockStory, check out our most recent stock picks, and then sign up to our earnings alerts by adding companies to your watchlist here. We typically have the quarterly earnings results analyzed within seconds of the data being released, and especially for companies reporting pre-market, this often gives investors the chance to react to the results before the market has fully absorbed the information.