
Swimming pool distributor Pool (NASDAQ:POOL) fell short of analysts' expectations in Q1 CY2024, with revenue down 7.1% year on year to $1.12 billion. It made a GAAP profit of $2.04 per share, down from its profit of $2.58 per share in the same quarter last year.
Pool (POOL) Q1 CY2024 Highlights:
- Revenue: $1.12 billion vs analyst estimates of $1.13 billion (0.8% miss)
- EPS: $2.04 vs analyst estimates of $1.92 (6.2% beat)
- Full year EPS guidance raised (to reflect additional tax benefits rather than fundamentals): $13.69 at the midpoint vs analyst estimates of $13.31 billion (2.9% beat)
- Gross Margin (GAAP): 30.2%, down from 30.6% in the same quarter last year
- Free Cash Flow of $128.4 million, similar to the previous quarter
- Market Capitalization: $14.52 billion
Founded in 1993 and headquartered in Louisiana, Pool (NASDAQ:POOL) is one of the largest wholesale distributors of swimming pool supplies, equipment, and related leisure products.
Pool's products include swimming pool supplies, equipment, and related outdoor living products, encompassing everything from chemicals, replacement parts, and accessories to furniture, grills, and decorative accents.
Pool operates through a vast network of sales centers across North America, Europe, and Australia. This extensive geographic footprint allows the company to serve diverse customers, including swimming pool
Pool's business model emphasizes strong supplier relationships and efficient supply chain management. Acquisitions have also been a crucial component of its growth strategy. By acquiring smaller regional distributors and competitors, Pool has been able to expand its geographic footprint, enter new markets, and bring in additional product lines and customer bases.
Specialized Consumer Services
Some consumer discretionary companies don’t fall neatly into a category because their products or services are unique. Although their offerings may be niche, these companies have often found more efficient or technology-enabled ways of doing or selling something that has existed for a while. Technology can be a double-edged sword, though, as it may lower the barriers to entry for new competitors and allow them to do serve customers better.
Pool’s primary competitors include Leslie's (NASDAQ:LESL), Hayward Holdings (NYSE:HAYW), Pentair (NYSE:PNR), and Fluidra S.A. (BME:FDR).Sales Growth
A company’s long-term performance can give signals about its business quality. Any business can put up a good quarter or two, but many enduring ones muster years of growth. Pool's annualized revenue growth rate of 12.6% over the last five years was mediocre for a consumer discretionary business. 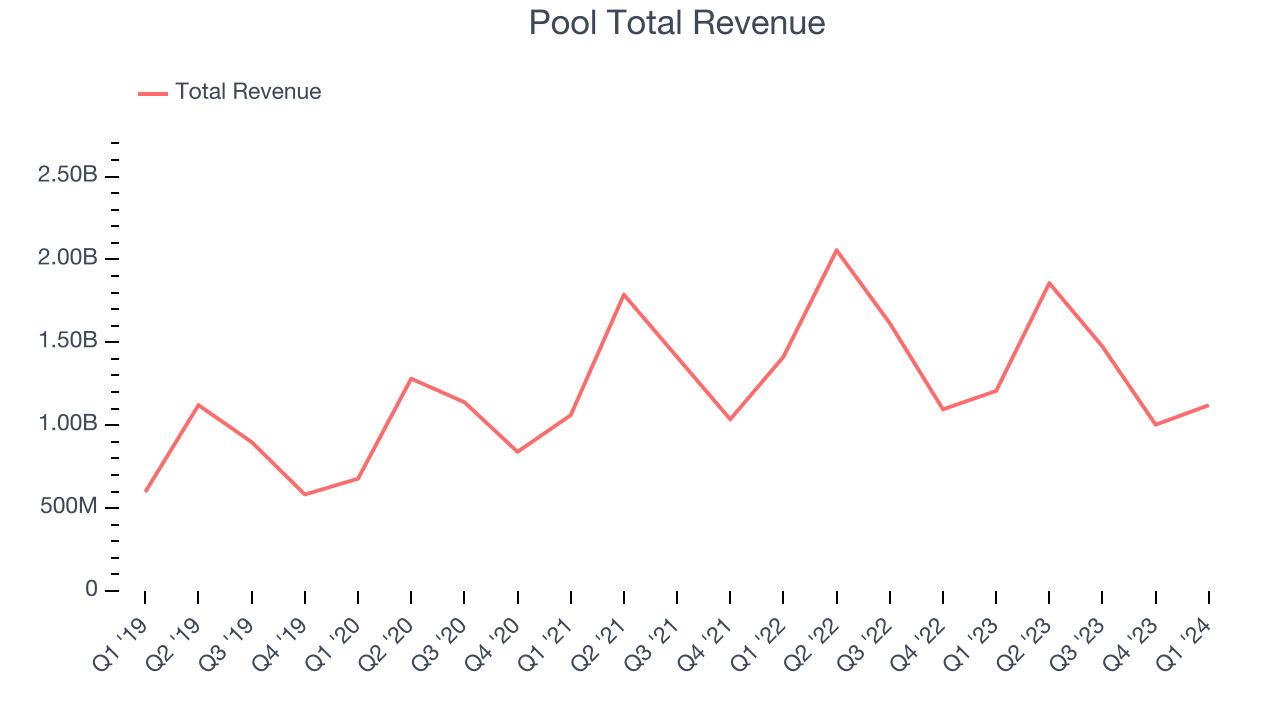 Within consumer discretionary, a long-term historical view may miss a company riding a successful new product or emerging trend. That's why we also follow short-term performance. Pool's recent history shows a reversal from its already weak five-year trend as its revenue has shown annualized declines of 1.7% over the last two years.
This quarter, Pool missed Wall Street's estimates and reported a rather uninspiring 7.1% year-on-year revenue decline, generating $1.12 billion of revenue. Looking ahead, Wall Street expects sales to grow 4.2% over the next 12 months, an acceleration from this quarter.
Operating Margin
Operating margin is an important measure of profitability. It’s the portion of revenue left after accounting for all core expenses–everything from the cost of goods sold to advertising and wages. Operating margin is also useful for comparing profitability across companies with different levels of debt and tax rates because it excludes interest and taxes.
Pool has managed its expenses well over the last two years. It's demonstrated solid profitability for a consumer discretionary business, producing an average operating margin of 14.4%.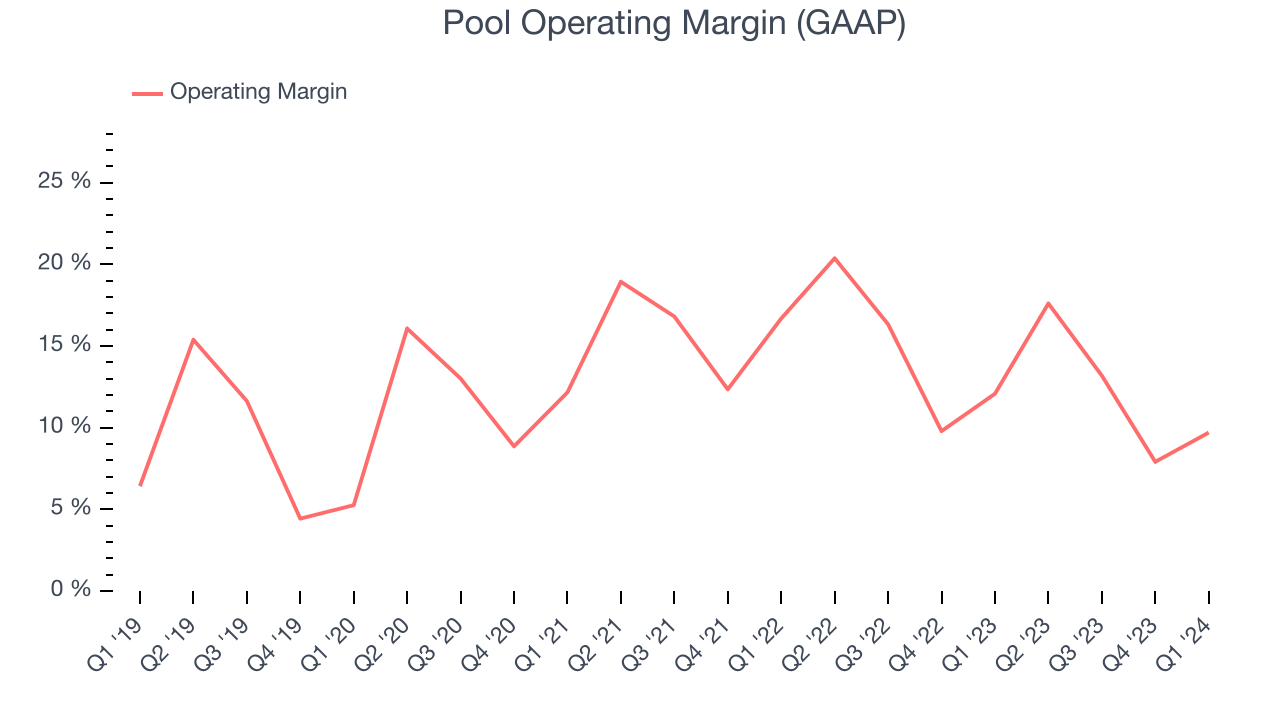
In Q1, Pool generated an operating profit margin of 9.7%, down 2.4 percentage points year on year.
Over the next 12 months, Wall Street expects Pool to maintain its LTM operating margin of 13%.EPS
We track long-term historical earnings per share (EPS) growth for the same reason as long-term revenue growth. Compared to revenue, however, EPS highlights whether a company's growth was profitable. 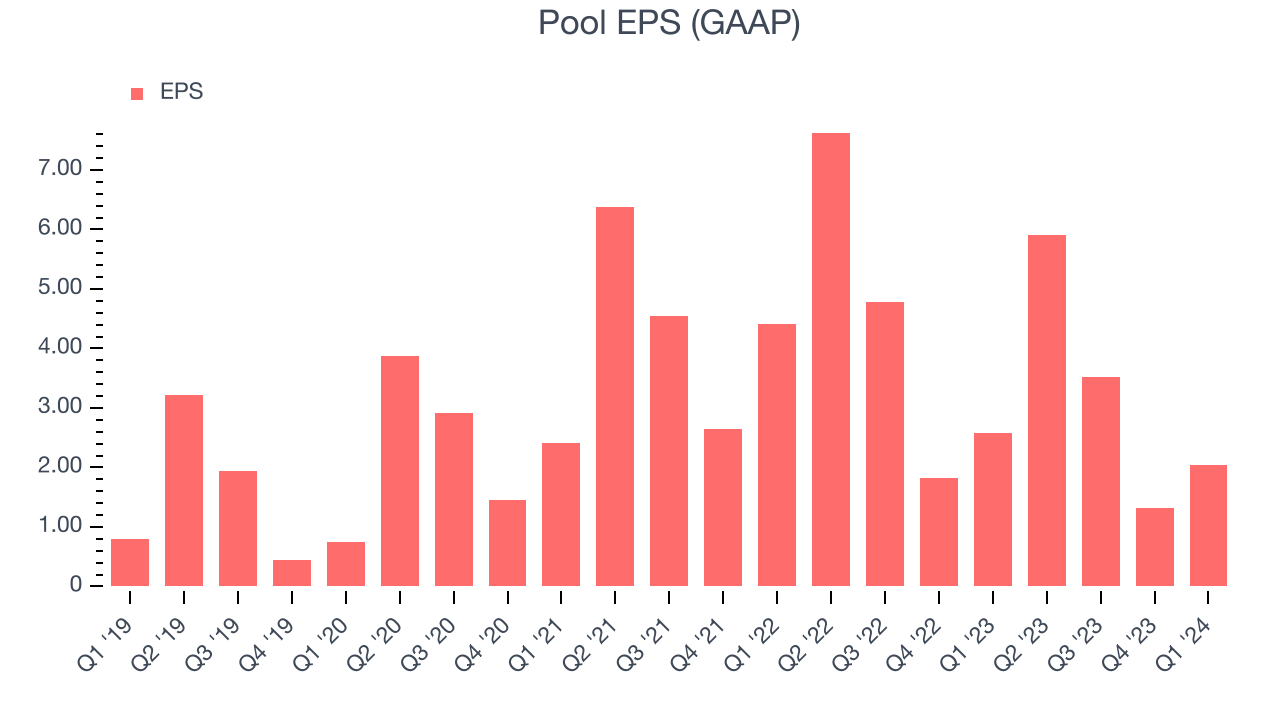
Over the last five years, Pool's EPS grew 126%, translating into a remarkable 17.7% compounded annual growth rate. This performance is higher than its 12.6% annualized revenue growth over the same period. There are a few reasons for this, and understanding why can shed light on its fundamentals.
While we mentioned earlier that Pool's operating margin declined this quarter, a five-year view shows its margin has expanded 3.3 percentage points while its share count has shrunk 5.5%. Improving profitability and share buybacks are positive signs as they juice EPS growth relative to revenue growth.In Q1, Pool reported EPS at $2.04, down from $2.58 in the same quarter last year. Despite falling year on year, this print beat analysts' estimates by 6.2%. Over the next 12 months, Wall Street expects Pool to grow its earnings. Analysts are projecting its LTM EPS of $12.78 to climb by 6.6% to $13.63.
Cash Is King
Although earnings are undoubtedly valuable for assessing company performance, we believe cash is king because you can't use accounting profits to pay the bills.
Over the last two years, Pool has shown solid cash profitability, giving it the flexibility to reinvest or return capital to investors. The company's free cash flow margin has averaged 14.1%, above the broader consumer discretionary sector.
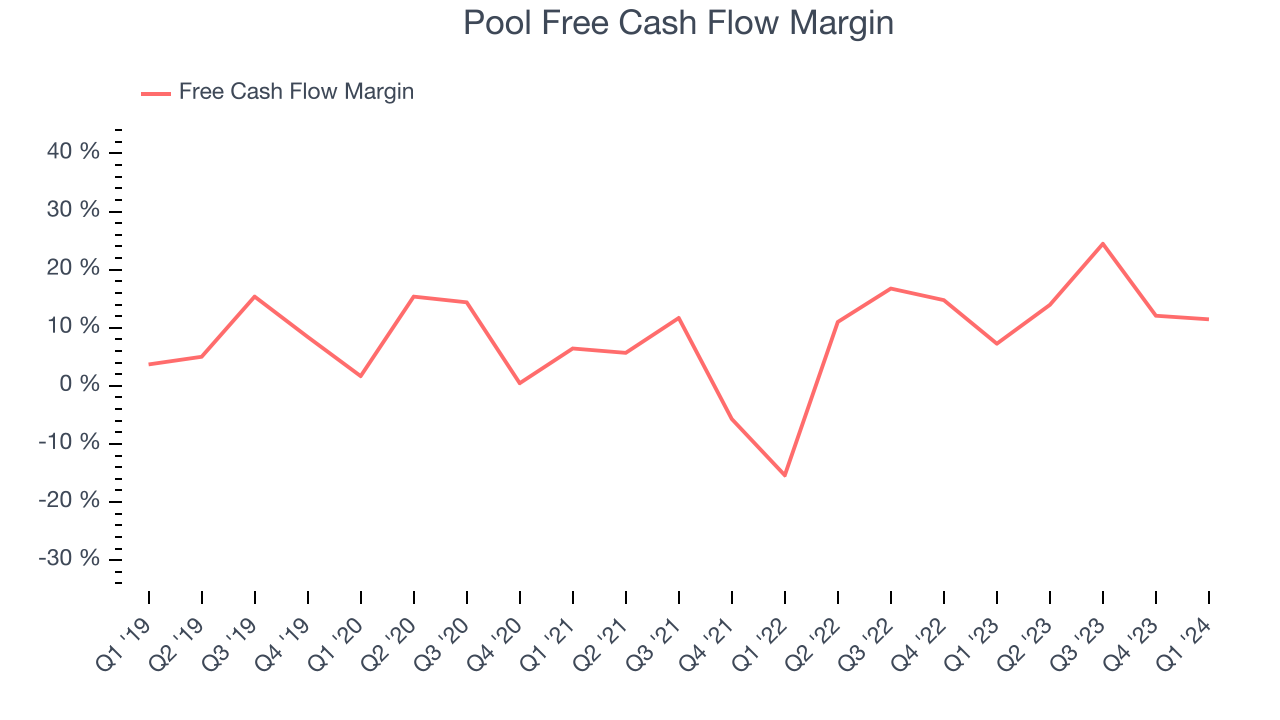
Pool's free cash flow came in at $128.4 million in Q1, equivalent to a 11.5% margin and up 46.5% year on year. Over the next year, analysts predict Pool's cash profitability will fall. Their consensus estimates imply its LTM free cash flow margin of 15.9% will decrease to 9%.
Return on Invested Capital (ROIC)
EPS and free cash flow tell us whether a company was profitable while growing revenue. But was it capital-efficient? A company’s ROIC explains this by showing how much operating profit a company makes compared to how much money the business raised (debt and equity).
Although Pool hasn't been the highest-quality company lately, it historically did a wonderful job investing in profitable business initiatives. Its five-year average return on invested capital was 32.1%, splendid for a consumer discretionary business.
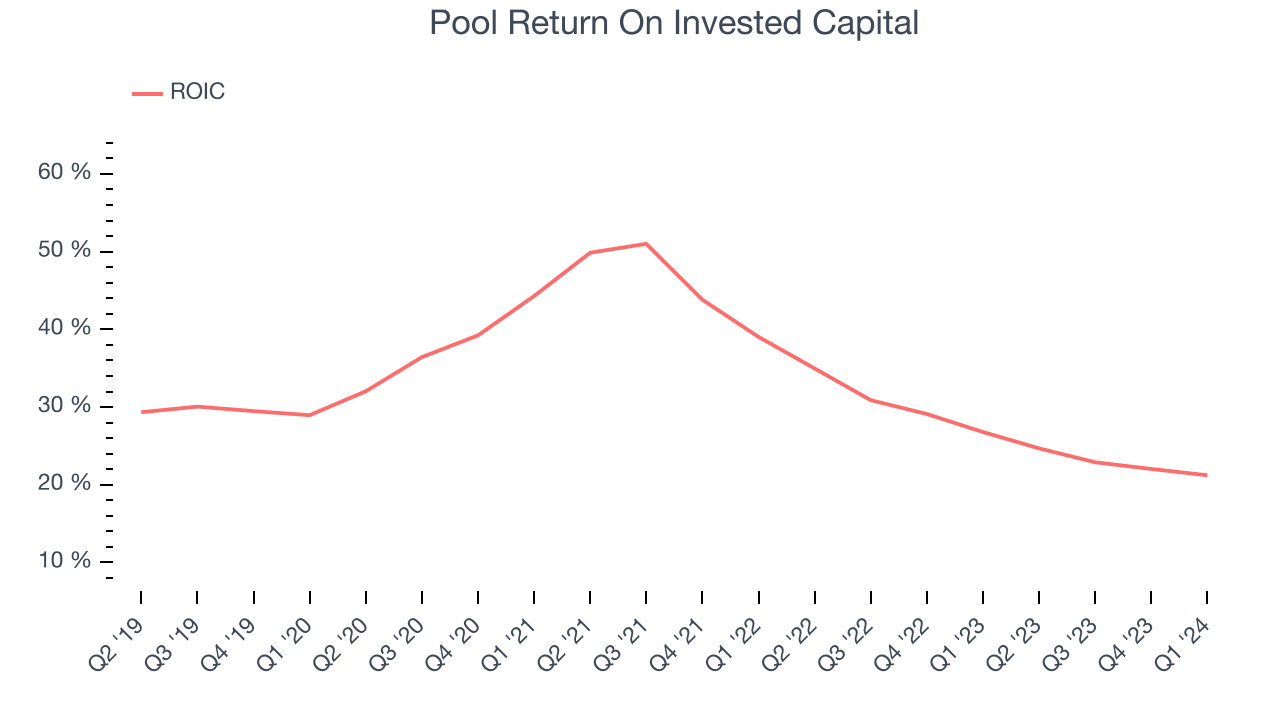
The trend in its ROIC, however, is often what surprises the market and drives the stock price. Unfortunately, Pool's ROIC averaged 12.6 percentage point decreases over the last few years. We like what management has done historically but are concerned its ROIC is declining, perhaps a symptom of waning business opportunities to invest profitably.
Balance Sheet Risk
Debt is a tool that can boost company returns but presents risks if used irresponsibly.
Pool reported $67.97 million of cash and $1.29 billion of debt on its balance sheet in the most recent quarter. As investors in high-quality companies, we primarily focus on two things: 1) that a company's debt level isn't too high and 2) that its interest payments are not excessively burdening the business.
With $771.3 million of EBITDA over the last 12 months, we view Pool's 1.6x net-debt-to-EBITDA ratio as safe. We also see its $29.98 million of annual interest expenses as appropriate. The company's profits give it plenty of breathing room, allowing it to continue investing in new initiatives.
Key Takeaways from Pool's Q1 Results
We enjoyed seeing Pool beat analysts' full-year earnings guidance expectations, although this guidance was raised to reflect expectations of additional tax credit benefits, not necessarily fundamentals. We were also glad its EPS outperformed Wall Street's estimates. On the other hand, its revenue unfortunately missed. Zooming out, we think this was still a decent, albeit mixed, quarter, showing that the company is staying on track. The stock is flat after reporting and currently trades at $377.39 per share.
Is Now The Time?
Pool may have had a favorable quarter, but investors should also consider its valuation and business qualities when assessing the investment opportunity.
We cheer for all companies serving consumers, but in the case of Pool, we'll be cheering from the sidelines. Its revenue growth has been a little slower over the last five years, and analysts expect growth to deteriorate from here. And while its stellar ROIC suggests it has been a well-run company historically, the downside is its organic sales performance has been disappointing. On top of that, its projected EPS for the next year is lacking.
Pool's price-to-earnings ratio based on the next 12 months is 27.8x. While we've no doubt one can find things to like about Pool, we think there are better opportunities elsewhere in the market. We don't see many reasons to get involved at the moment.
Wall Street analysts covering the company had a one-year price target of $396.15 per share right before these results (compared to the current share price of $377.39).
To get the best start with StockStory, check out our most recent stock picks, and then sign up for our earnings alerts by adding companies to your watchlist here. We typically have the quarterly earnings results analyzed within seconds of the data being released, and especially for companies reporting pre-market, this often gives investors the chance to react to the results before the market has fully absorbed the information.