
Fast-food pizza chain Papa John’s (NASDAQ:PZZA) missed analysts' expectations in Q1 CY2024, with revenue down 2.5% year on year to $513.9 million. It made a non-GAAP profit of $0.67 per share, down from its profit of $0.68 per share in the same quarter last year.
Papa John's (PZZA) Q1 CY2024 Highlights:
- Revenue: $513.9 million vs analyst estimates of $543.1 million (5.4% miss)
- EPS (non-GAAP): $0.67 vs analyst estimates of $0.56 (19.1% beat)
- Gross Margin (GAAP): 31.4%, in line with the same quarter last year
- Free Cash Flow was -$1.07 million, down from $40.4 million in the previous quarter
- Same-Store Sales were down 2% year on year (miss)
- Store Locations: 5,914 at quarter end, increasing by 189 over the last 12 months
- Market Capitalization: $1.88 billion
Founded by the eclectic John “Papa John” Schnatter, Papa John’s (NASDAQ:PZZA) is a globally recognized pizza delivery and carryout chain known for “better ingredients” and “better pizza”.
John started the company in 1984 when he converted a broom closet in his father's struggling Indiana tavern into a pizza-making station. To pay for the necessary equipment, he sold his 1971 Camaro for $1,600.
John eventually got his Camaro back for $250,000 in 2009, but that wasn’t the only asset that grew in value. From its humble beginnings, Papa John’s now boasts over 5,700 stores around the world and is one of the most popular pizza brands in the United States.
At the heart of Papa John's success lies its dedication to using fresh, high-quality ingredients in its wide range of menu items, which include creative specials like its Doritos Cool Ranch Papadias and Cinnamon Pull Aparts to traditional classics such as pepperoni pizza, cheesy breadsticks, and healthy salads.
Convenience is a key focus at the company, and like other national pizza chains, Papa John’s uses smaller carry-out-centric storefronts to fulfill its orders. Most customers order online or via its mobile app to better customize pizzas and avoid wait times while others opt for delivery either through Papa John’s directly or popular third-party platforms such as DoorDash, Seamless, or Uber Eats.
Traditional Fast Food
Traditional fast-food restaurants are renowned for their speed and convenience, boasting menus filled with familiar and budget-friendly items. Their reputations for on-the-go consumption make them favored destinations for individuals and families needing a quick meal. This class of restaurants, however, is fighting the perception that their meals are unhealthy and made with inferior ingredients, a battle that's especially relevant today given the consumers increasing focus on health and wellness.
Fast-food pizza competitors include public companies Domino’s (NYSE:DPZ) and Pizza Hut (owned by Yum! Brands, NYSE:YUM) as well as private company Little Caesars.Sales Growth
Papa John's is larger than most restaurant chains and benefits from economies of scale, giving it an edge over its smaller competitors.
As you can see below, the company's annualized revenue growth rate of 5.7% over the last five years was weak , but to its credit, it opened new restaurants and expanded its reach.
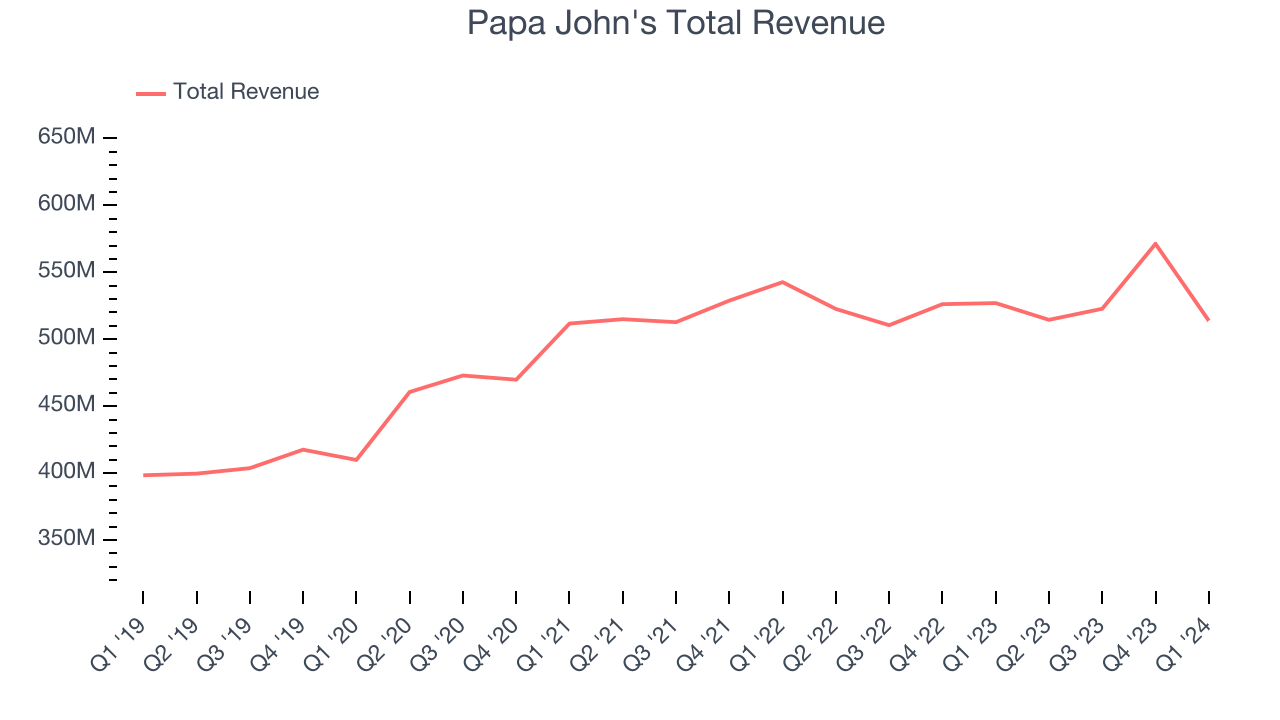
This quarter, Papa John's missed Wall Street's estimates and reported a rather uninspiring 2.5% year-on-year revenue decline, generating $513.9 million in revenue. Looking ahead, Wall Street expects sales to grow 3.8% over the next 12 months, an acceleration from this quarter.
Same-Store Sales
A company's same-store sales growth shows the year-on-year change in sales for its restaurants that have been open for at least a year, give or take. This is a key performance indicator because it measures organic growth and demand.
Papa John's demand has been shrinking over the last eight quarters, and on average, its same-store sales have declined by 0.9% year on year. This performance isn't ideal and the company should reconsider its growth strategy before opening new restaurants with its precious capital.
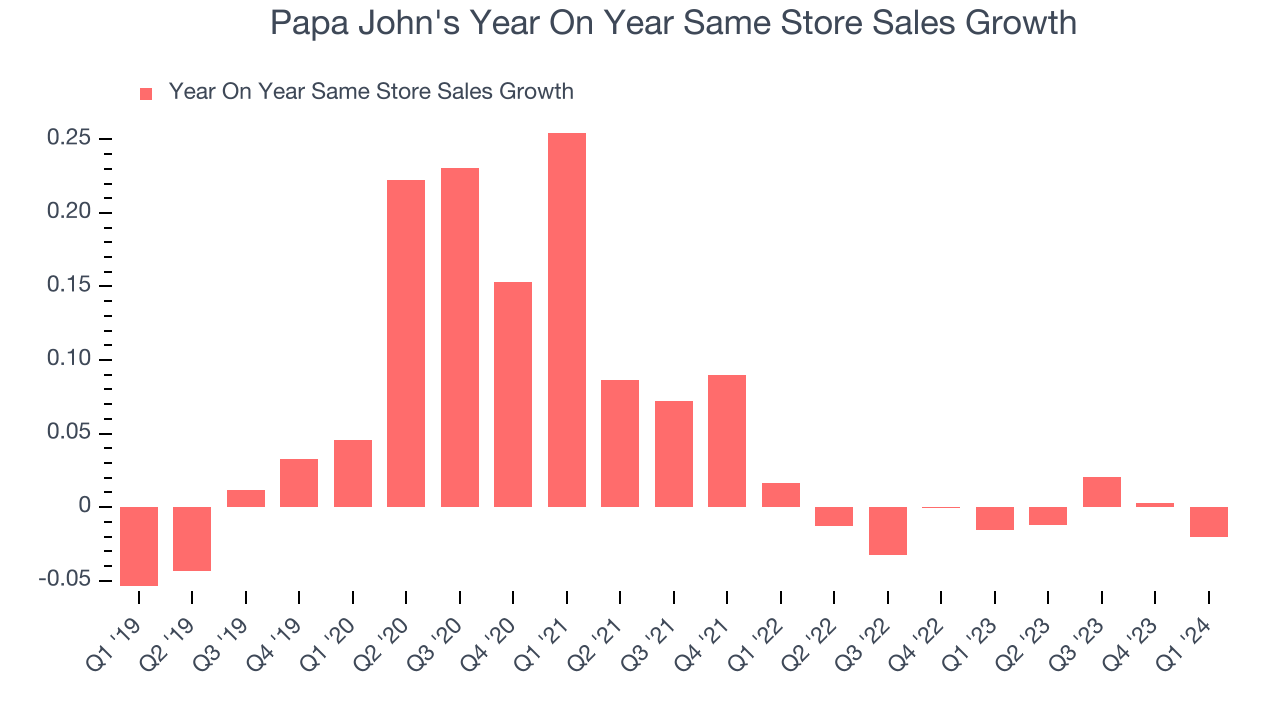
In the latest quarter, Papa John's same-store sales fell 2% year on year. This decrease was a further deceleration from the 1.5% year-on-year decline it posted 12 months ago. We hope the business can get back on track.
Number of Stores
A restaurant chain's total number of dining locations often determines how much revenue it can generate.
When a chain like Papa John's is opening new restaurants, it usually means it's investing for growth because there's healthy demand for its meals and there are markets where the concept has few or no locations. Since last year, Papa John's restaurant count increased by 189, or 3.3%, to 5,914 locations in the most recently reported quarter.
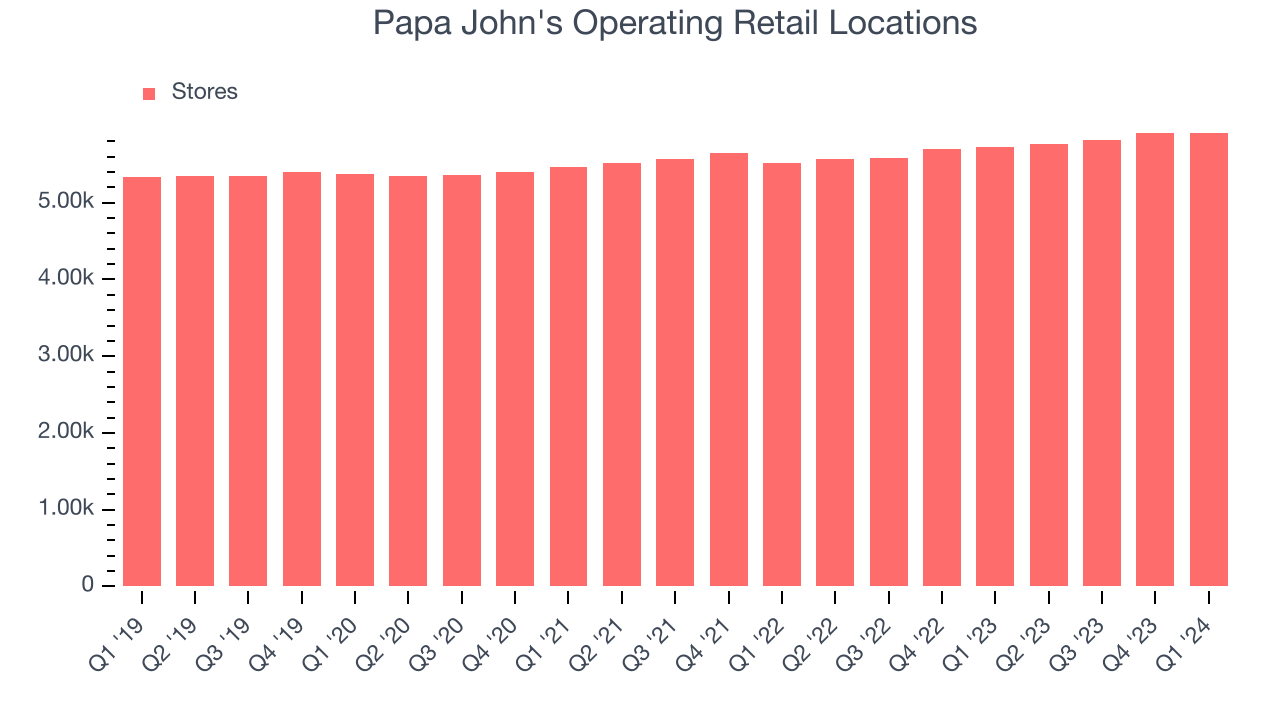
Taking a step back, Papa John's has opened new restaurants over the last eight quarters, averaging 2.5% annual increases in new locations. This growth outpaces the broader restaurant sector, but comparisons should be taken lightly as the industry is quite mature. Analyzing a restaurant's location growth is important because expansion means Papa John's has more opportunities to feed customers and generate sales.
Gross Margin & Pricing Power
Papa John's gross profit margin came in at 31.4% this quarter. in line with the same quarter last year. This means the company makes $0.31 for every $1 in revenue before accounting for its operating expenses.
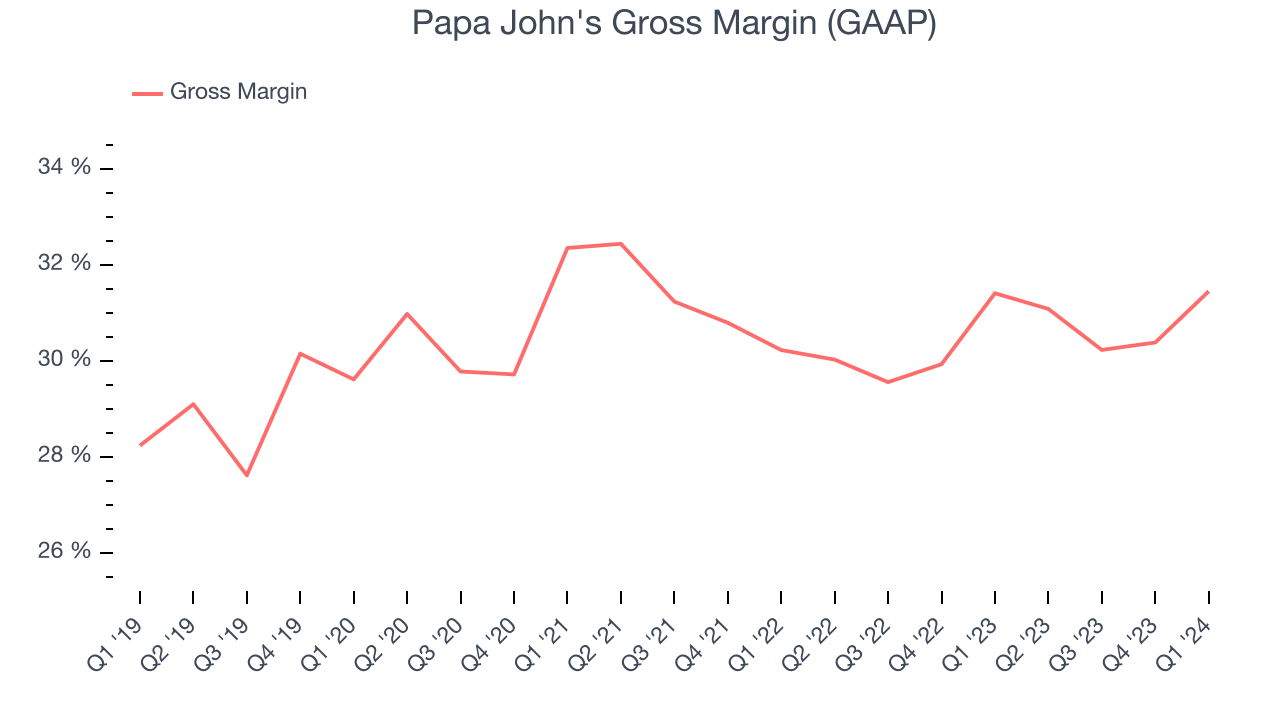
Papa John's unit economics are higher than the typical restaurant company, giving it the flexibility to invest in areas such as marketing and talent to reach more consumers. As you can see above, it's averaged a decent 30.5% gross margin over the last eight quarters. Its margin has also been trending up over the last 12 months, averaging 1.9% year-on-year increases each quarter. If this trend continues, it could suggest a less competitive environment where the company has better pricing power and more stable input costs (such as ingredients and transportation expenses).
Operating Margin
Operating margin is a key profitability metric for restaurants because it accounts for all expenses keeping the lights on, including wages, rent, advertising, and other administrative costs.
This quarter, Papa John's generated an operating profit margin of 6.6%, in line with the same quarter last year. This indicates the company's costs have been relatively stable.
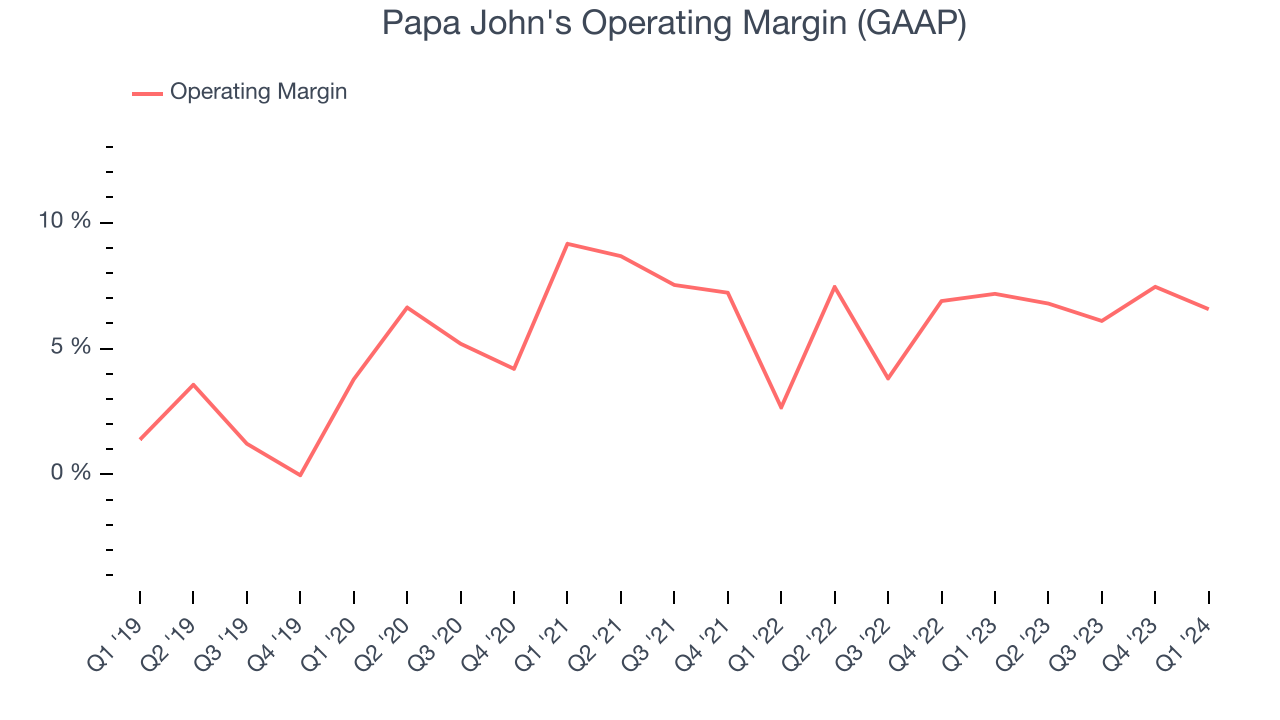 Zooming out, Papa John's was profitable over the last two years but held back by its large expense base. It's demonstrated mediocre profitability for a restaurant business, producing an average operating margin of 6.5%. Its margin has also seen few fluctuations, meaning it will take a big change to improve profitability.
EPS
Earnings growth is a critical metric to track, but for long-term shareholders, earnings per share (EPS) is more telling because it accounts for dilution and share repurchases.
In Q1, Papa John's reported EPS at $0.67, down from $0.68 in the same quarter a year ago. This print beat Wall Street's estimates by 19.1%.
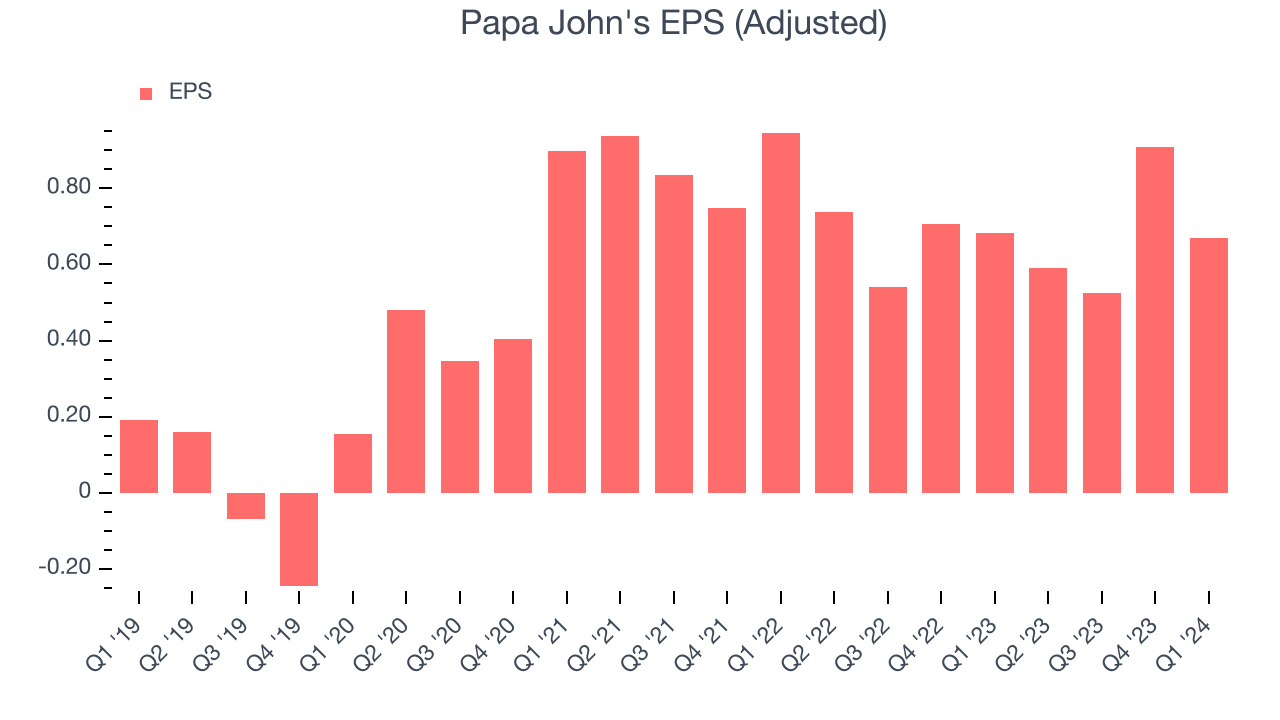
Wall Street expects the company to continue growing earnings over the next 12 months, with analysts projecting an average 3.1% year-on-year increase in EPS.
Cash Is King
If you've followed StockStory for a while, you know that we emphasize free cash flow. Why, you ask? We believe that in the end, cash is king, and you can't use accounting profits to pay the bills.
Papa John's broke even from a free cash flow perspective in Q1. The company's margin regressed this quarter as it was 4.5 percentage points lower than in the same period last year.
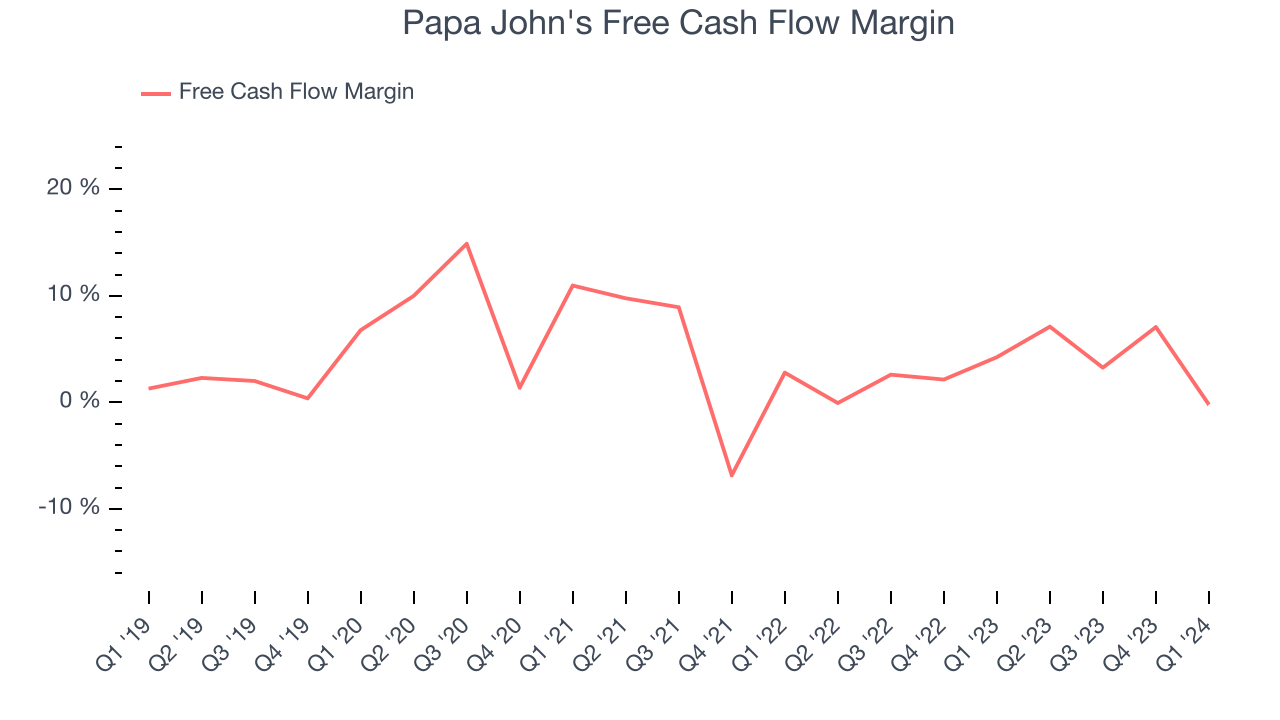
Over the last two years, Papa John's has shown decent cash profitability, giving it some reinvestment opportunities. The company's free cash flow margin has averaged 3.3%, slightly better than the broader restaurant sector. Furthermore, its margin has averaged year-on-year increases of 2.1 percentage points. This likely pleases the company's investors.
Return on Invested Capital (ROIC)
EPS and free cash flow tell us whether a company was profitable while growing revenue. But was it capital-efficient? Enter ROIC, a metric showing how much operating profit a company generates relative to how much money the business raised (debt and equity).
Although Papa John's hasn't been the highest-quality company lately, it historically did a wonderful job investing in profitable business initiatives. Its five-year average ROIC was 42.3%, splendid for a restaurant business.
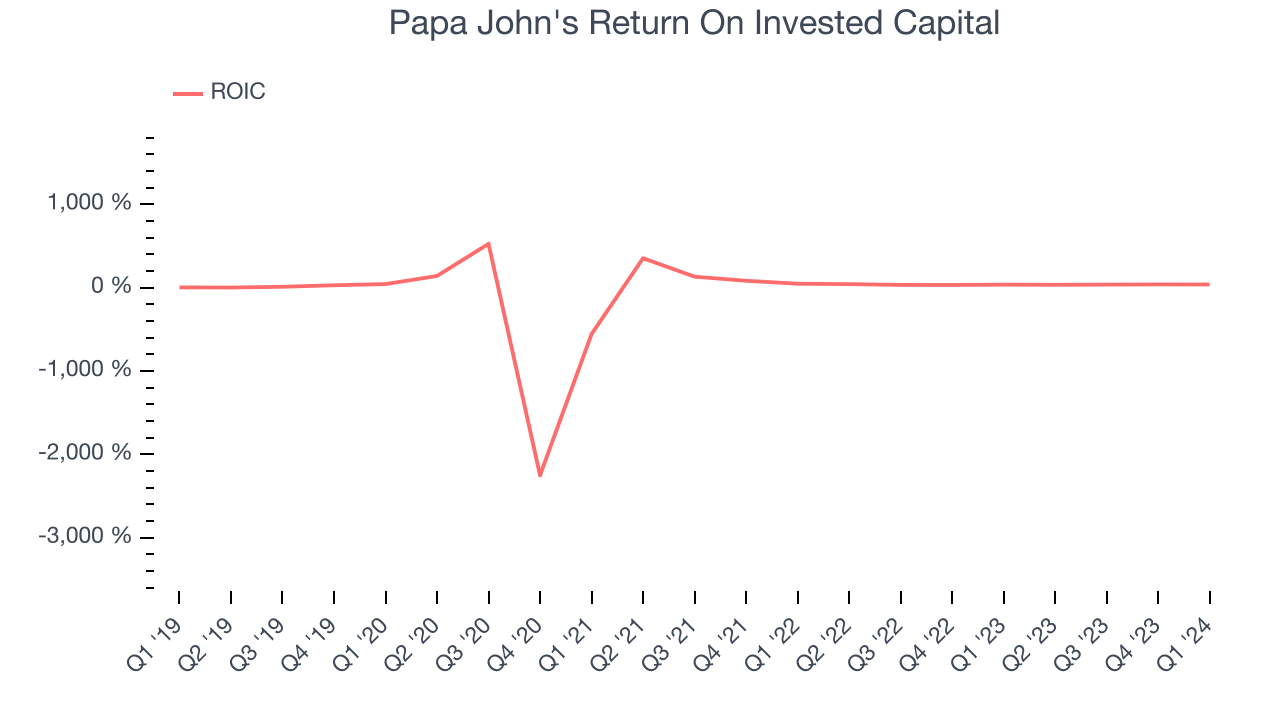
The trend in its ROIC, however, is often what surprises the market and drives the stock price. Unfortunately, Papa John's ROIC averaged 8 percentage point decreases over the last few years. We like what management has done historically but are concerned its ROIC is declining, perhaps a symptom of waning business opportunities to invest profitably.
Balance Sheet Risk
As long-term investors, the risk we care most about is the permanent loss of capital. This can happen when a company goes bankrupt or raises money from a disadvantaged position and is separate from short-term stock price volatility, which we are much less bothered by.
Papa John's reported $27.77 million of cash and $763.1 million of debt on its balance sheet in the most recent quarter. As investors in high-quality companies, we primarily focus on two things: 1) that a company's debt level isn't too high and 2) that its interest payments are not excessively burdening the business.
With $218.6 million of EBITDA over the last 12 months, we view Papa John's 3.4x net-debt-to-EBITDA ratio as safe. We also see its $45.51 million of annual interest expenses as appropriate. The company's profits give it plenty of breathing room, allowing it to continue investing in new initiatives.
Key Takeaways from Papa John's Q1 Results
Papa John's same-store sales and revenue unfortunately missed analysts' expectations. On the other hand, operating profit beat. Zooming out, we think this was a mixed quarter. The stock is flat after reporting and currently trades at $56.9 per share.
Is Now The Time?
Papa John's may have had a favorable quarter, but investors should also consider its valuation and business qualities when assessing the investment opportunity.
Papa John's isn't a bad business, but it probably wouldn't be one of our picks. Its revenue growth has been a little slower over the last five years, and analysts expect growth to deteriorate from here. And while its stellar ROIC suggests it has been a well-run company historically, the downside is its shrinking same-store sales suggests it'll need to change its strategy to succeed. On top of that, its projected EPS for the next year is lacking.
Papa John's price-to-earnings ratio based on the next 12 months is 20.6x. In the end, beauty is in the eye of the beholder. While Papa John's wouldn't be our first pick, if you like the business, the shares are trading at a pretty interesting price right now.
Wall Street analysts covering the company had a one-year price target of $78.14 per share right before these results (compared to the current share price of $56.90).
To get the best start with StockStory, check out our most recent stock picks, and then sign up to our earnings alerts by adding companies to your watchlist here. We typically have the quarterly earnings results analyzed within seconds of the data being released, and especially for companies reporting pre-market, this often gives investors the chance to react to the results before the market has fully absorbed the information.