
Fast-food pizza chain Papa John’s (NASDAQ:PZZA) fell short of analysts' expectations in Q4 FY2023, with revenue up 8.6% year on year to $571.3 million. It made a non-GAAP profit of $0.91 per share, improving from its profit of $0.71 per share in the same quarter last year.
Papa John's (PZZA) Q4 FY2023 Highlights:
- Revenue: $571.3 million vs analyst estimates of $578.2 million (1.2% miss)
- EPS (non-GAAP): $0.91 vs analyst estimates of $0.72 (26.6% beat)
- Free Cash Flow of $40.4 million, up 137% from the previous quarter
- Gross Margin (GAAP): 30.4%, up from 29.9% in the same quarter last year
- Same-Store Sales were up 0.1% year on year
- Store Locations: 5,906 at quarter end, increasing by 200 over the last 12 months
- Market Capitalization: $2.30 billion
Founded by the eclectic John “Papa John” Schnatter, Papa John’s (NASDAQ:PZZA) is a globally recognized pizza delivery and carryout chain known for “better ingredients” and “better pizza”.
John started the company in 1984 when he converted a broom closet in his father's struggling Indiana tavern into a pizza-making station. To pay for the necessary equipment, he sold his 1971 Camaro for $1,600.
John eventually got his Camaro back for $250,000 in 2009, but that wasn’t the only asset that grew in value. From its humble beginnings, Papa John’s now boasts over 5,700 stores around the world and is one of the most popular pizza brands in the United States.
At the heart of Papa John's success lies its dedication to using fresh, high-quality ingredients in its wide range of menu items, which include creative specials like its Doritos Cool Ranch Papadias and Cinnamon Pull Aparts to traditional classics such as pepperoni pizza, cheesy breadsticks, and healthy salads.
Convenience is a key focus at the company, and like other national pizza chains, Papa John’s uses smaller carry-out-centric storefronts to fulfill its orders. Most customers order online or via its mobile app to better customize pizzas and avoid wait times while others opt for delivery either through Papa John’s directly or popular third-party platforms such as DoorDash, Seamless, or Uber Eats.
Traditional Fast Food
Traditional fast-food restaurants are renowned for their speed and convenience, boasting menus filled with familiar and budget-friendly items. Their reputations for on-the-go consumption make them favored destinations for individuals and families needing a quick meal. This class of restaurants, however, is fighting the perception that their meals are unhealthy and made with inferior ingredients, a battle that's especially relevant today given the consumers increasing focus on health and wellness.
Fast-food pizza competitors include public companies Domino’s (NYSE:DPZ) and Pizza Hut (owned by Yum! Brands, NYSE:YUM) as well as private company Little Caesars.Sales Growth
Papa John's is larger than most restaurant chains and benefits from economies of scale, giving it an edge over its smaller competitors.
As you can see below, the company's annualized revenue growth rate of 7.2% over the last four years (we compare to 2019 to normalize for COVID-19 impacts) was decent as it opened new restaurants and expanded its reach.
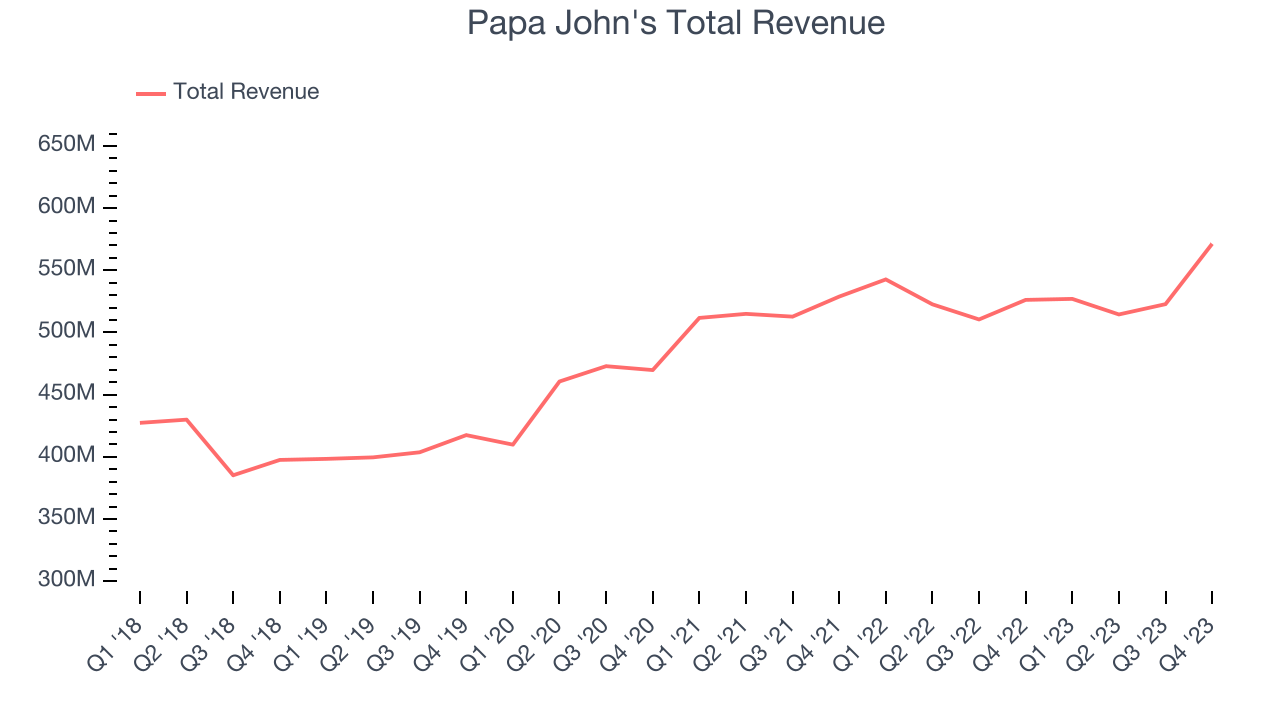
This quarter, Papa John's revenue grew 8.6% year on year to $571.3 million, missing Wall Street's expectations. Looking ahead, Wall Street expects sales to grow 3.8% over the next 12 months, a deceleration from this quarter.
Number of Stores
When a chain like Papa John's is opening new restaurants, it usually means it's investing for growth because there's healthy demand for its meals and there are markets where the concept has few or no locations. Since last year, Papa John's restaurant count increased by 200, or 3.5%, to 5,906 locations in the most recently reported quarter.
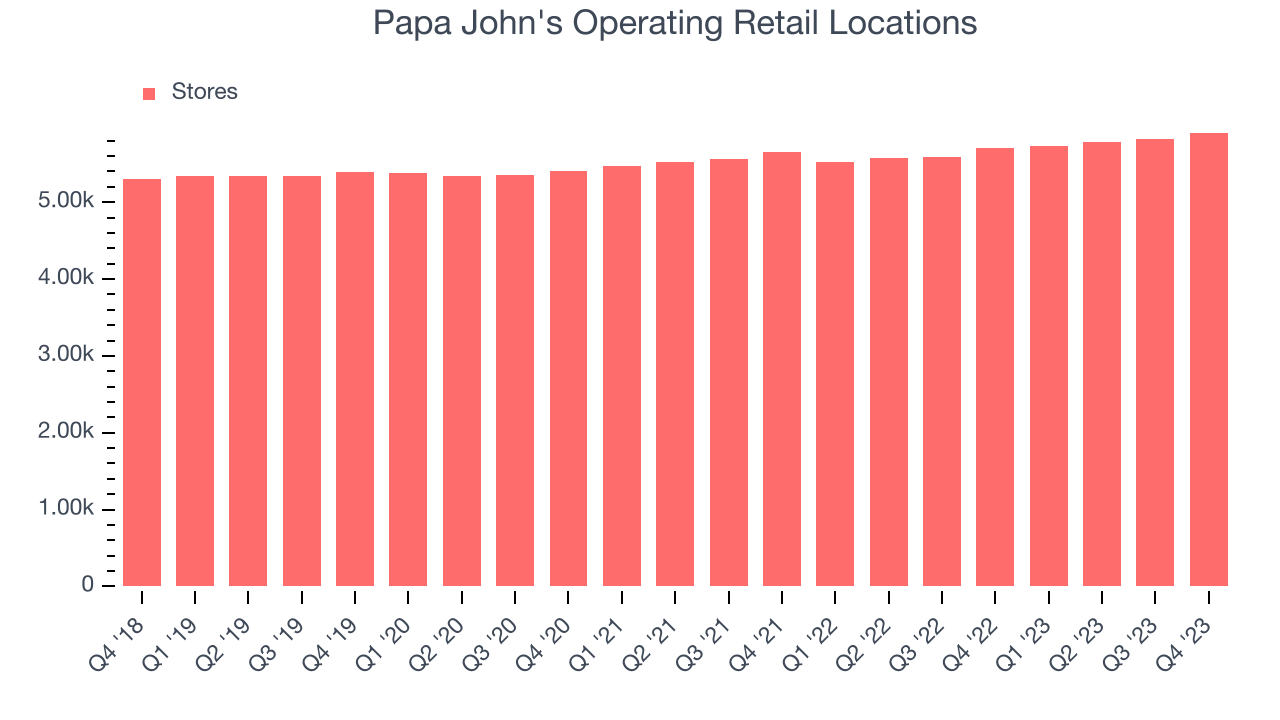
Over the last two years, Papa John's has opened new restaurants and averaged 2.3% annual growth in new locations, higher than other restaurant businesses. Comparisons, however, should be taken with a grain of salt as the industry is quite mature. Analyzing a restaurant's location growth is important because expansion means Papa John's has more opportunities to feed customers and generate sales.
Same-Store Sales
A company's same-store sales growth shows the year-on-year change in sales for its restaurants that have been open for at least a year, give or take. This is a key performance indicator because it measures organic growth and demand.
Papa John's demand has been shrinking over the last eight quarters, and on average, its same-store sales have declined by 0.4% year on year. This performance isn't ideal and the company should reconsider its growth strategy before opening new restaurants with its precious capital.
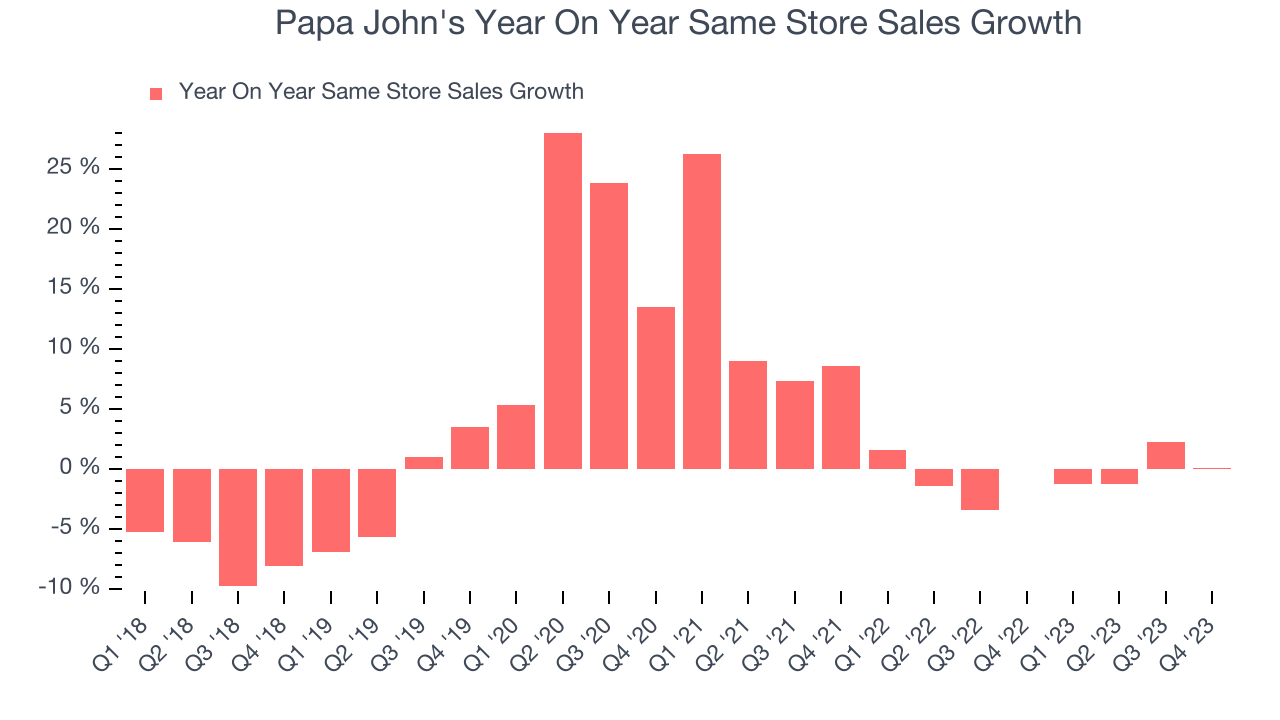
In the latest quarter, Papa John's year on year same-store sales were flat. This performance was more or less in line with the same quarter last year.
Gross Margin & Pricing Power
We prefer higher gross margins because they not only make it easier to generate more operating profits but also indicate pricing power and differentiation, whether it be the dining experience or quality and taste of food.
In Q4, Papa John's gross profit margin was 30.4%. in line with the same quarter last year. This means the company makes $0.30 for every $1 in revenue before accounting for its operating expenses. 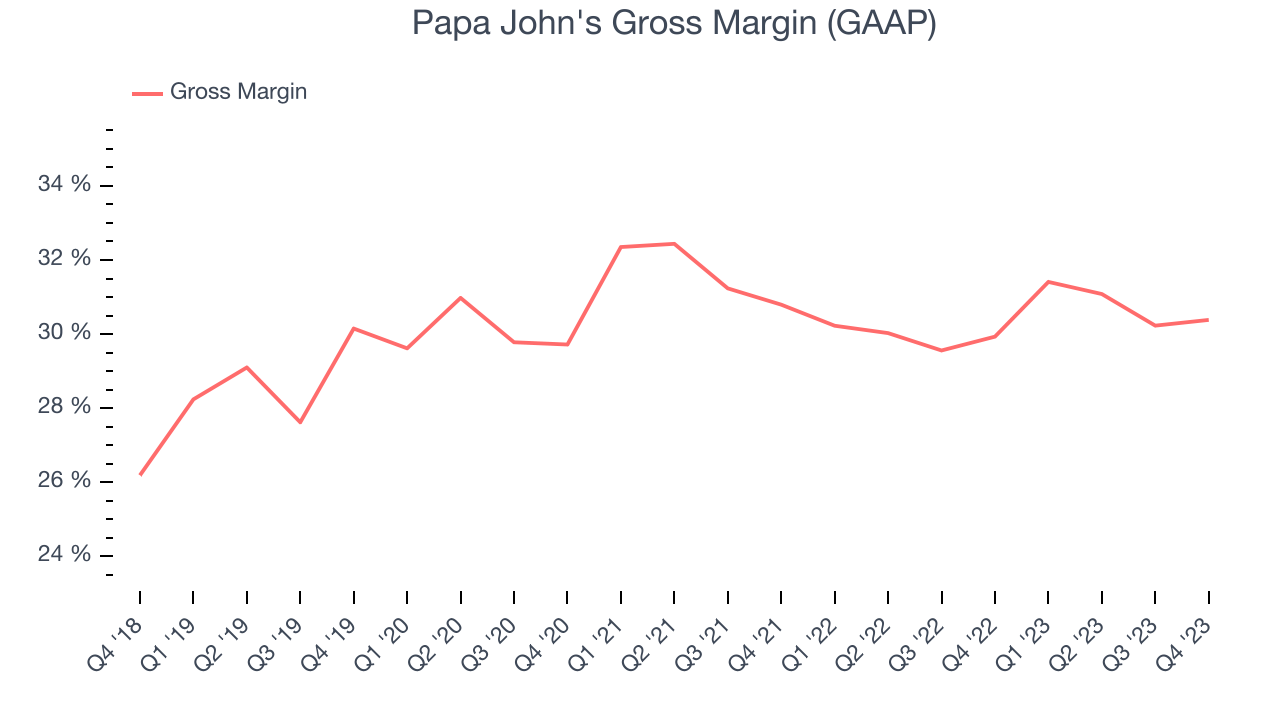
Papa John's unit economics are higher than the typical restaurant company, giving it the flexibility to invest in areas such as marketing and talent to reach more consumers. As you can see above, it's averaged a decent 30.4% gross margin over the last eight quarters. Its margin has also been trending up over the last 12 months, averaging 2.8% year-on-year increases each quarter. If this trend continues, it could suggest a less competitive environment where the company has better pricing power and more stable input costs (such as ingredients and transportation expenses).
Operating Margin
Operating margin is an important measure of profitability for restaurants as it accounts for all expenses keeping the lights on, including wages, rent, advertising, and other administrative costs.
In Q4, Papa John's generated an operating profit margin of 7.5%, in line with the same quarter last year. This indicates the company's costs have been relatively stable.
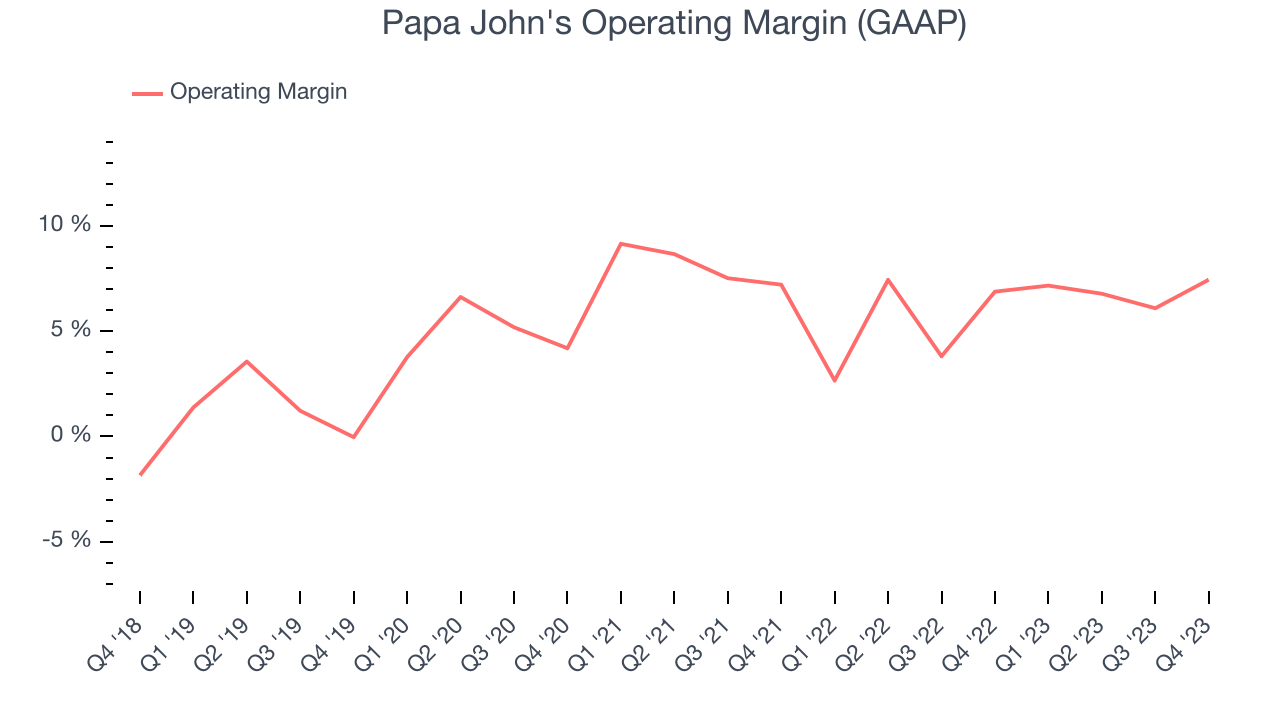 Zooming out, Papa John's was profitable over the last two years but held back by its large expense base. It's demonstrated mediocre profitability for a restaurant business, producing an average operating margin of 6%. However, Papa John's margin has improved, on average, by 1.7 percentage points each year, an encouraging sign for shareholders. The tide could be turning.
EPS
These days, some companies issue new shares like there's no tomorrow. That's why we like to track earnings per share (EPS) because it accounts for shareholder dilution and share buybacks.
In Q4, Papa John's reported EPS at $0.91, up from $0.71 in the same quarter a year ago. This print beat Wall Street's estimates by 26.6%.
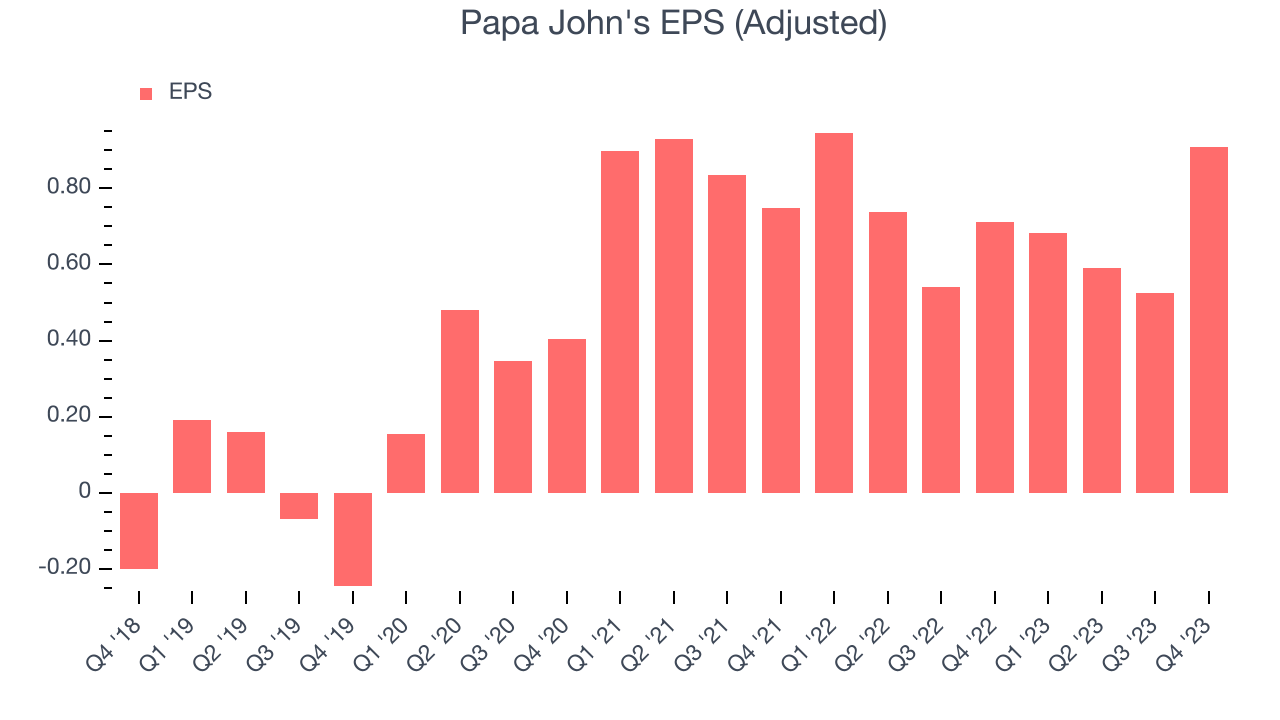
Between FY2019 and FY2023, Papa John's adjusted diluted EPS grew 7,852%, translating into an astounding 199% compounded annual growth rate. This growth is materially higher than its revenue growth over the same period, showing that Papa John's has excelled in managing its expenses.
Wall Street expects the company to continue growing earnings over the next 12 months, with analysts projecting an average 2.1% year-on-year increase in EPS.
Cash Is King
If you've followed StockStory for a while, you know that we emphasize free cash flow. Why, you ask? We believe that in the end, cash is king, and you can't use accounting profits to pay the bills.
Papa John's free cash flow came in at $40.4 million in Q4, up 258% year on year. This result represents a 7.1% margin.
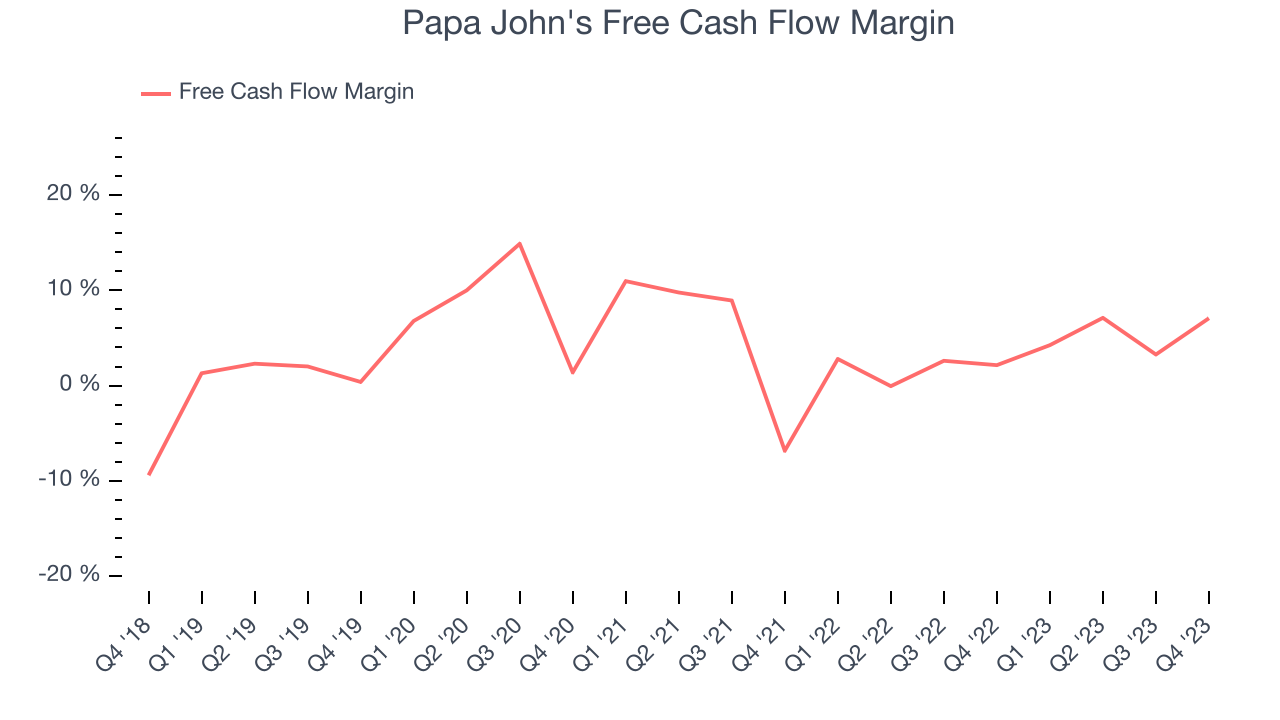
Over the last two years, Papa John's has shown decent cash profitability, giving it some reinvestment opportunities. The company's free cash flow margin has averaged 3.7%, slightly better than the broader restaurant sector. Furthermore, its margin has averaged year-on-year increases of 3.6 percentage points. This likely pleases the company's investors.
Return on Invested Capital (ROIC)
EPS and free cash flow tell us whether a company was profitable while growing revenue. But was it capital-efficient? A company’s ROIC explains this by showing how much operating profit a company makes compared to how much money the business raised (debt and equity).
Although Papa John's hasn't been the highest-quality company lately, it historically did a wonderful job investing in profitable business initiatives. Its five-year average ROIC was 47.3%, splendid for a restaurant business.
The trend in its ROIC, however, is often what surprises the market and drives the stock price. Unfortunately, Papa John's ROIC over the last two years averaged 19.3 percentage point decreases each year. We like what management has done historically but are concerned its ROIC is declining, perhaps a symptom of waning business opportunities to invest profitably.
Key Takeaways from Papa John's Q4 Results
We were impressed by how Papa John's beat analysts' gross margin expectations this quarter. We were also excited its EPS outperformed Wall Street's estimates. On the other hand, its revenue unfortunately missed analysts' expectations. No guidance was given in the earnings release. Overall, we think this was a really good quarter that should please shareholders. The stock is flat after reporting and currently trades at $69.8 per share.
Is Now The Time?
Papa John's may have had a favorable quarter, but investors should also consider its valuation and business qualities when assessing the investment opportunity.
Papa John's isn't a bad business, but it probably wouldn't be one of our picks. Although its revenue growth has been decent over the last four years, its shrinking same-store sales suggests it'll need to change its strategy to succeed. And while its stellar ROIC suggests it has been a well-run company historically, the downside is its projected EPS for the next year is lacking.
Papa John's price-to-earnings ratio based on the next 12 months is 25.4x. We can find things to like about Papa John's and there's no doubt it's a bit of a market darling, at least for some investors. But it seems there's a lot of optimism already priced in and we wonder if there are better opportunities elsewhere right now.
Wall Street analysts covering the company had a one-year price target of $81.07 per share right before these results (compared to the current share price of $69.80).
To get the best start with StockStory, check out our most recent stock picks, and then sign up to our earnings alerts by adding companies to your watchlist here. We typically have the quarterly earnings results analyzed within seconds of the data being released, and especially for companies reporting pre-market, this often gives investors the chance to react to the results before the market has fully absorbed the information.