
Household products company Reynolds (NASDAQ:REYN) reported Q1 CY2024 results beating Wall Street analysts' expectations, with revenue down 4.7% year on year to $833 million. The company expects next quarter's revenue to be around $887.5 million, in line with analysts' estimates. It made a non-GAAP profit of $0.23 per share, improving from its profit of $0.08 per share in the same quarter last year.
Reynolds (REYN) Q1 CY2024 Highlights:
- Revenue: $833 million vs analyst estimates of $815 million (2.2% beat)
- Adjusted EBITDA: $122 million vs analyst estimates of $118 million (3.1% beat)
- EPS (non-GAAP): $0.23 vs analyst expectations of $0.22 (in line)
- Revenue Guidance for Q2 CY2024 is $887.5 million at the midpoint, roughly in line with what analysts were expecting
- EPS (non-GAAP) Guidance for Q2 CY2024 is $0.44 at the midpoint, above analyst estimates of $0.37
- Gross Margin (GAAP): 24.1%, up from 17.7% in the same quarter last year
- Free Cash Flow of $70 million, down 63.9% from the previous quarter
- Organic Revenue was down 5% year on year
- Sales Volumes were down 3% year on year
- Market Capitalization: $5.97 billion
Best known for its aluminum foil, Reynolds (NASDAQ:REYN) is a household products company whose products focus on food storage, cooking, and waste.
The company and its famous foil trace their roots back to 1947 when a nephew of the Reynolds Tobacco Company founder established Reynolds Metals Company. From there, the company expanded its line of kitchen and cooking products to include parchment paper, wax paper, containers for food storage, and others. In 2010, Reynolds further expanded its portfolio with a strategic acquisition that added the Hefty brand of trash bags.
Reynolds targets middle-income consumers, especially those who cook at home for themselves or their family members. These customers are looking for proven brands that are competitive in price versus alternatives. Given Reynolds’ brand awareness, though, the company’s products don’t need to be the absolute cheapest. Many consumers are willing to pay a reasonable premium to buy established brands rather than lesser-known or private-label brands.
It’s quite easy to find Reynolds’ products for sale, and the company tends to dominate the section or aisle for food storage. Traditional brick-and-mortar retailers such as supermarkets, mass merchants, drug stores, and specialty stores are the most common sellers of the company’s products. Given Reynolds’ scale and traffic-driving brands, the company often has prominent placement on retailer shelves.
Household Products
Household products stocks are generally stable investments, as many of the industry's products are essential for a comfortable and functional living space. Recently, there's been a growing emphasis on eco-friendly and sustainable offerings, reflecting the evolving consumer preferences for environmentally conscious options. These trends can be double-edged swords that benefit companies who innovate quickly to take advantage of them and hurt companies that don't invest enough to meet consumers where they want to be with regards to trends.
Competitors that offer household products, especially in the areas of food preparation and storage, include Proctor & Gamble (NYSE:PG), Clorox (NYSE:CLX), and Kimberly-Clark (NYSE:KMB).Sales Growth
Reynolds is larger than most consumer staples companies and benefits from economies of scale, giving it an edge over its smaller competitors.
As you can see below, the company's annualized revenue growth rate of 4.1% over the last three years was weak as consumers bought less of its products. We'll explore what this means in the "Volume Growth" section.
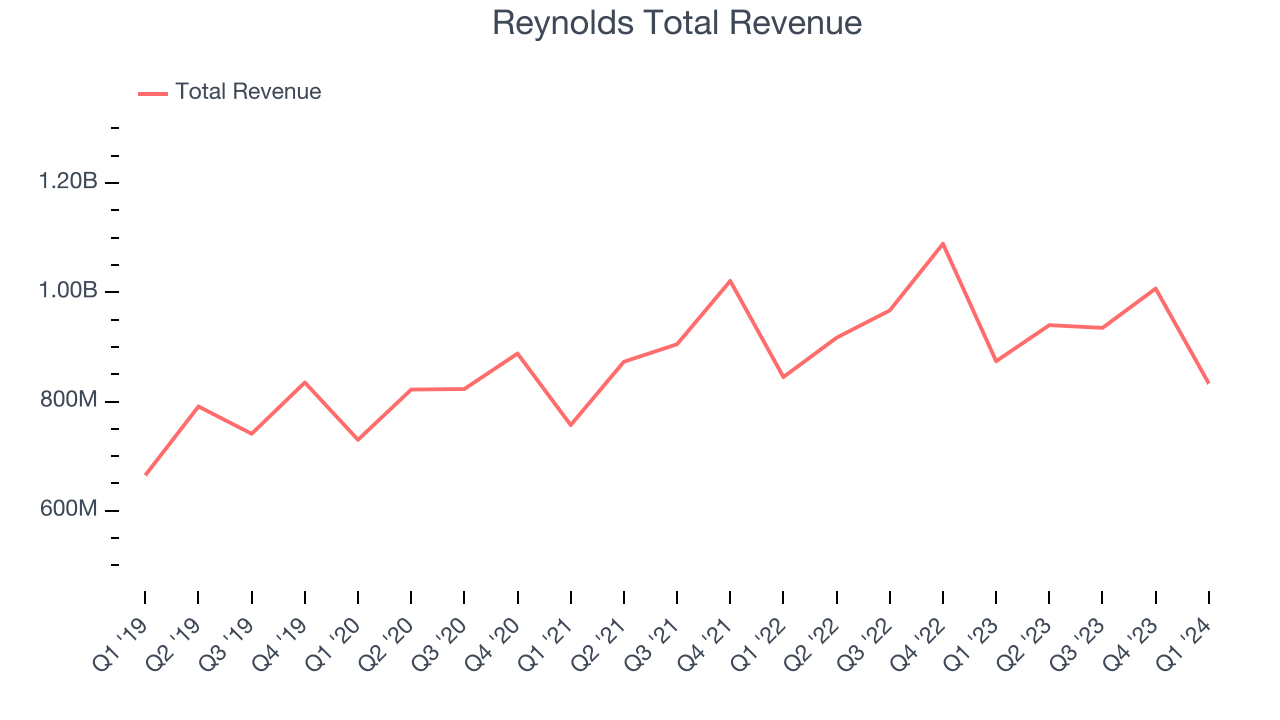
This quarter, Reynolds's revenue fell 4.7% year on year to $833 million but beat Wall Street's estimates by 2.2%. The company is guiding for a 5.6% year-on-year revenue decline next quarter to $887.5 million, a reversal from the 2.5% year-on-year increase it recorded in the same quarter last year. Looking ahead, Wall Street expects revenue to decline 2.7% over the next 12 months.
Volume Growth
Revenue growth can be broken down into changes in price and volume (the number of units sold). While both are important, volume is the lifeblood of a successful staples business as there’s a ceiling to what consumers will pay for everyday goods; they can always trade down to non-branded products if the branded versions are too expensive.
To analyze whether Reynolds generated its growth from changes in price or volume, we can compare its volume growth to its organic revenue growth, which excludes non-fundamental impacts on company financials like mergers and currency fluctuations.
Over the last two years, Reynolds's average quarterly sales volumes have shrunk by 4.5%. This decrease isn't ideal as the quantity demanded for consumer staples products is typically stable. Luckily, Reynolds was able to offset fewer customers purchasing its products by charging higher prices, enabling it to generate 1.1% average organic revenue growth. We hope the company can grow its volumes soon, however, as consistent price increases (on top of inflation) aren't sustainable over the long term unless the business is really really special.
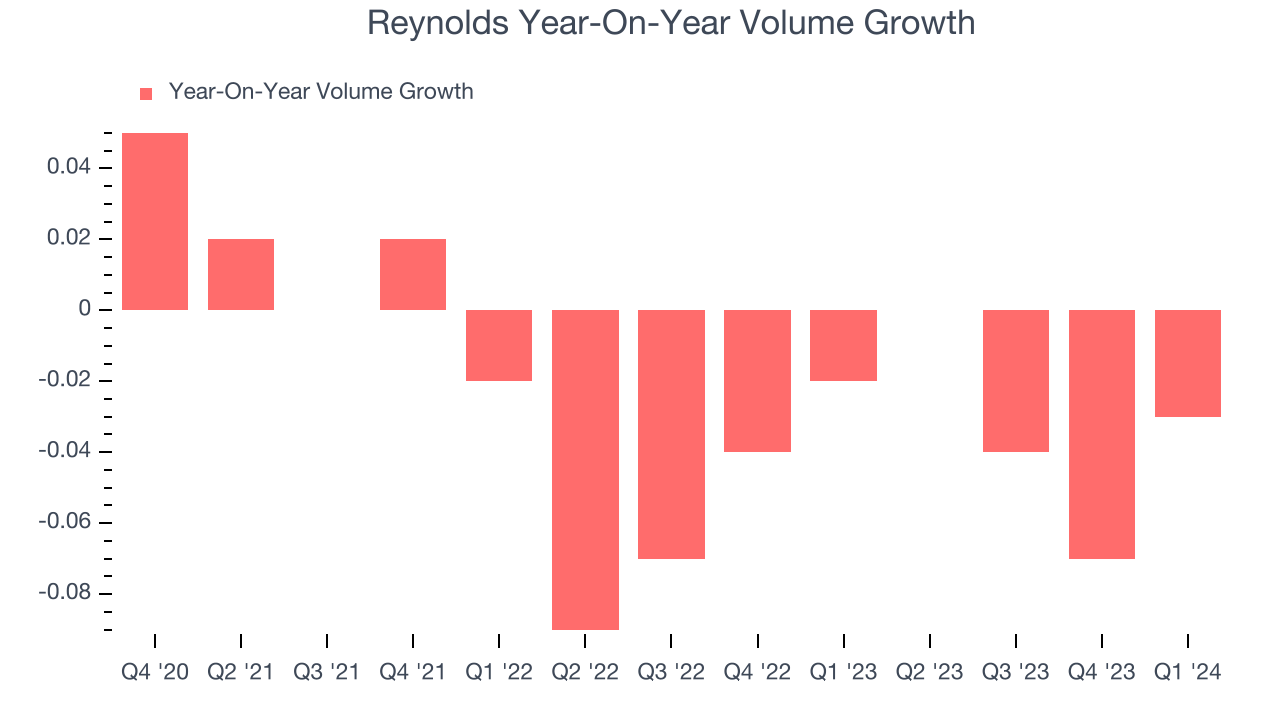
In Reynolds's Q1 2024, sales volumes dropped 3% year on year. This result was a further deceleration from the 2% year-on-year decline it posted 12 months ago, showing the business is struggling to push its products.
Gross Margin & Pricing Power
We prefer higher gross margins because they make it easier to generate more operating profits.
Reynolds's gross profit margin came in at 24.1% this quarter, up 6.4 percentage points year on year. That means for every $1 in revenue, a chunky $0.76 went towards paying for raw materials, production of goods, and distribution expenses.
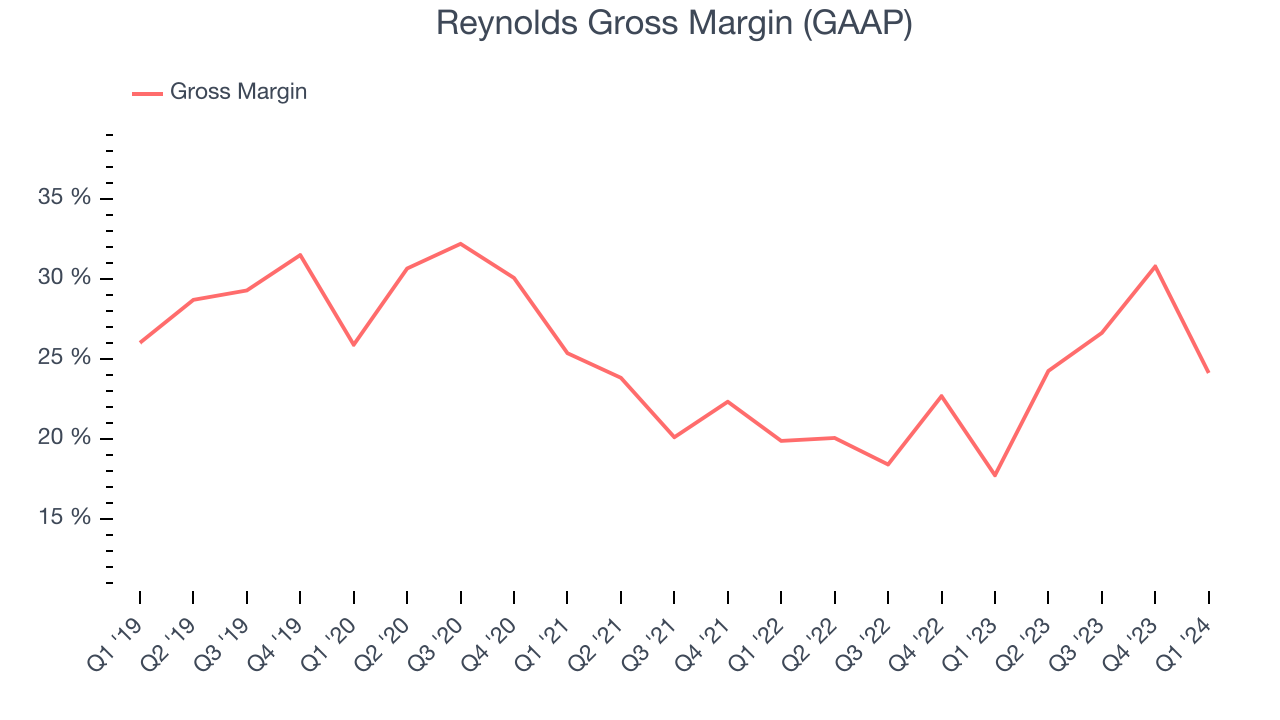
Reynolds has weak unit economics for a consumer staples company, making it difficult to reinvest in the business. As you can see above, it's averaged a 23.2% gross margin over the last eight quarters. Its margin, however, has been trending up over the last 12 months, averaging 34.3% year-on-year increases each quarter. If this trend continues, it could suggest a less competitive environment.
Operating Margin
Operating margin is a key profitability metric for companies because it accounts for all expenses enabling a business to operate smoothly, including marketing and advertising, IT systems, wages, and other administrative costs.
In Q1, Reynolds generated an operating profit margin of 10.8%, up 4.9 percentage points year on year. This increase was encouraging, and we can infer Reynolds had stronger pricing power and lower raw materials/transportation costs because its gross margin expanded more than its operating margin.
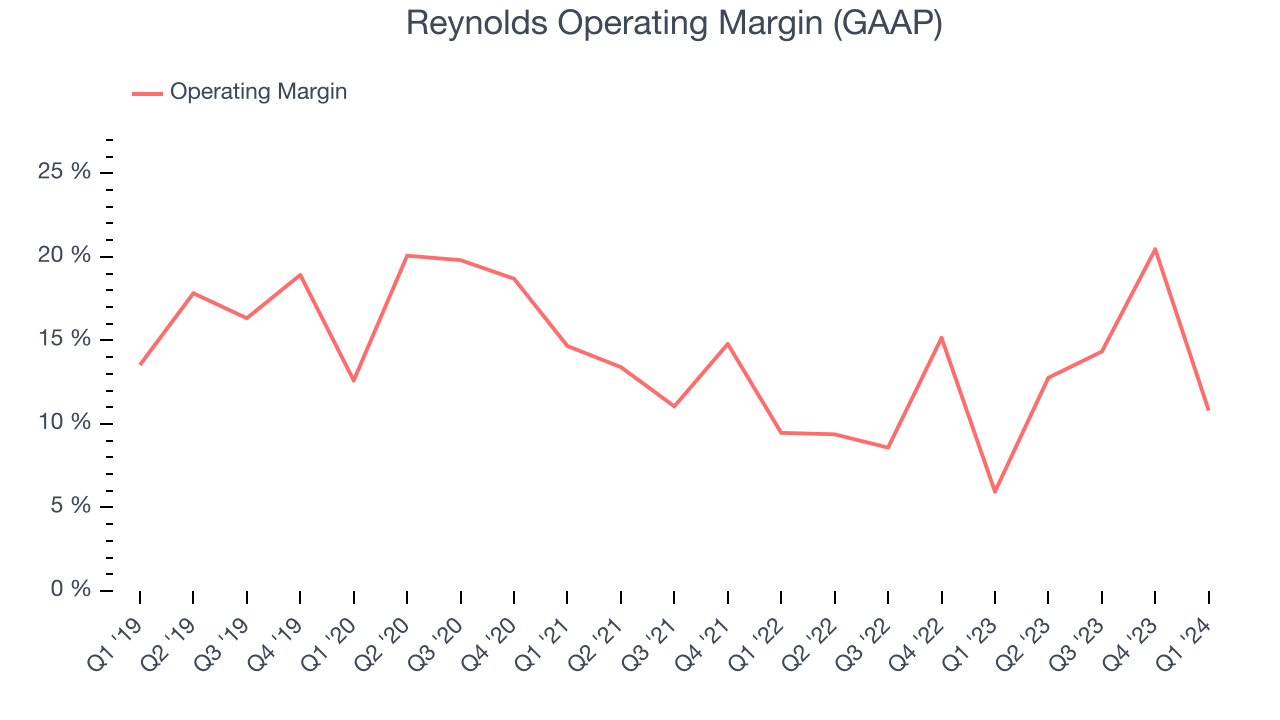 Zooming out, Reynolds has managed its expenses well over the last two years. It's demonstrated solid profitability for a consumer staples business, producing an average operating margin of 12.4%. On top of that, its margin has improved by 4.8 percentage points on average over the last year, a great sign for shareholders. The company's operating profitability was particularly impressive because of its low gross margin, which is mostly a factor of what it sells and takes tectonic shifts to move meaningfully. Companies have more control over their operating margins, and it signals strength if they're high when gross margins are low (like for Reynolds).
EPS
Earnings growth is a critical metric to track, but for long-term shareholders, earnings per share (EPS) is more telling because it accounts for dilution and share repurchases.
In Q1, Reynolds reported EPS at $0.23, up from $0.08 in the same quarter a year ago. This print beat Wall Street's estimates by 2.5%.
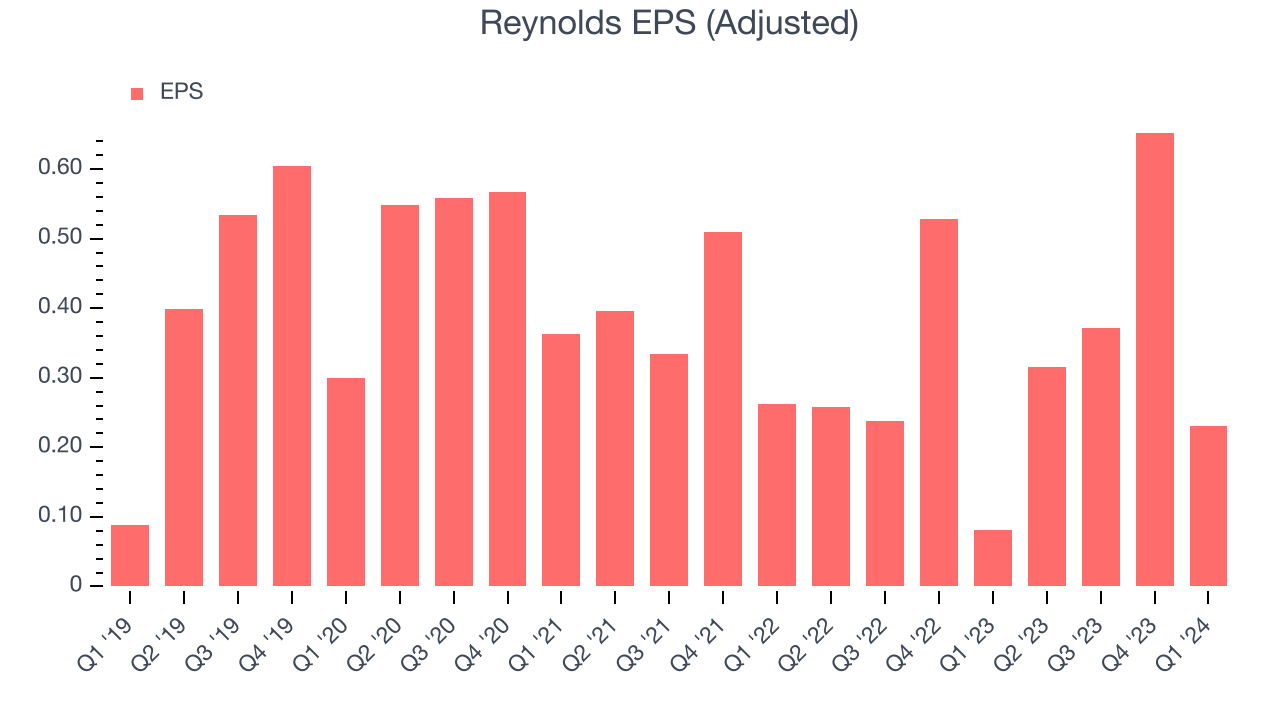
Between FY2021 and FY2024, Reynolds's EPS dropped 22.9%, translating into 8.3% annualized declines. We tend to steer our readers away from companies with falling EPS, especially in the consumer staples sector, where shrinking earnings could imply changing secular trends or consumer preferences. If there's no earnings growth, it's difficult to build confidence in a business's underlying fundamentals, leaving a low margin of safety around the company's valuation (making the stock susceptible to large downward swings).
On the bright side, Wall Street expects the company's earnings to grow over the next 12 months, with analysts projecting an average 4.7% year-on-year increase in EPS.
Cash Is King
If you've followed StockStory for a while, you know we emphasize free cash flow. Why, you ask? We believe that in the end, cash is king, and you can't use accounting profits to pay the bills.
Reynolds's free cash flow came in at $70 million in Q1, up 6.1% year on year. This result represents a 8.4% margin.
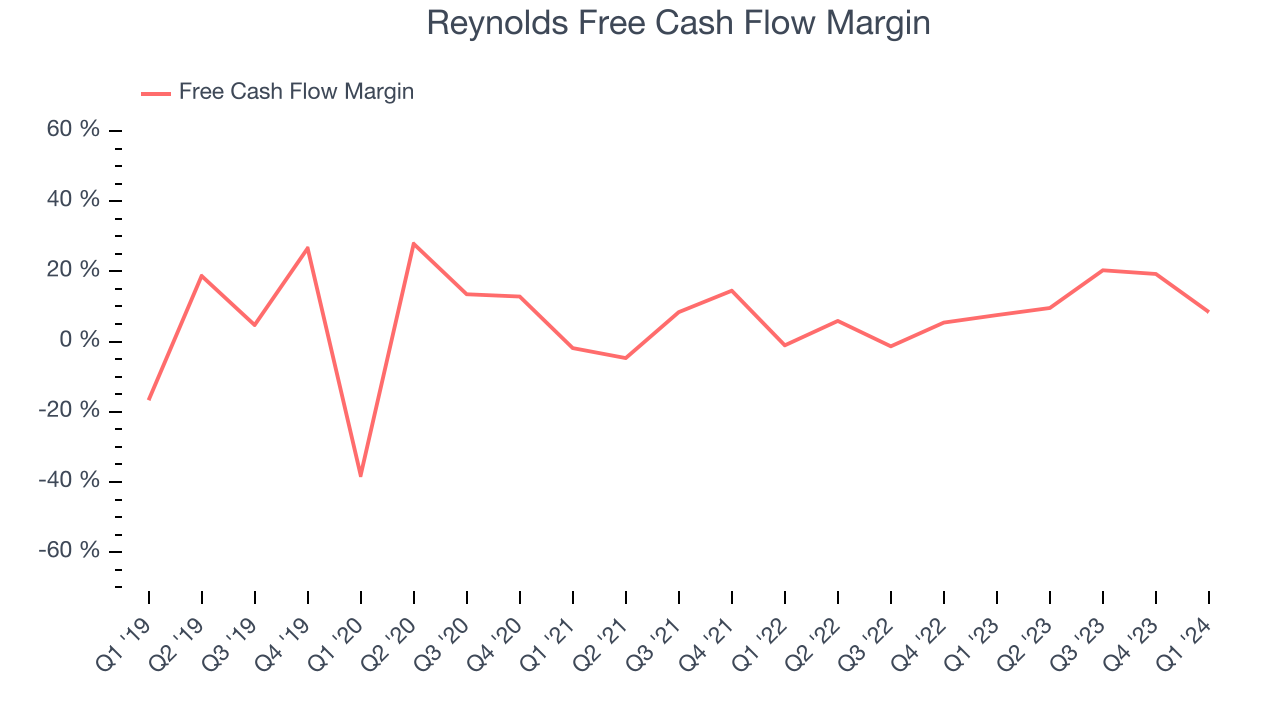
Over the last eight quarters, Reynolds has shown solid cash profitability, giving it the flexibility to reinvest or return capital to investors. The company's free cash flow margin has averaged 9.4%, above the broader consumer staples sector. Furthermore, its margin has averaged year-on-year increases of 10.3 percentage points over the last 12 months. Shareholders should be excited as this will certainly help Reynolds achieve its long-term strategic goals.
Return on Invested Capital (ROIC)
EPS and free cash flow tell us whether a company was profitable while growing revenue. But was it capital-efficient? A company’s ROIC explains this by showing how much operating profit a company makes compared to how much money the business raised (debt and equity).
Reynolds's five-year average ROIC was 12%, slightly better than the broader sector. Just as you’d like your investment dollars to generate returns, Reynolds's invested capital has produced decent profits.
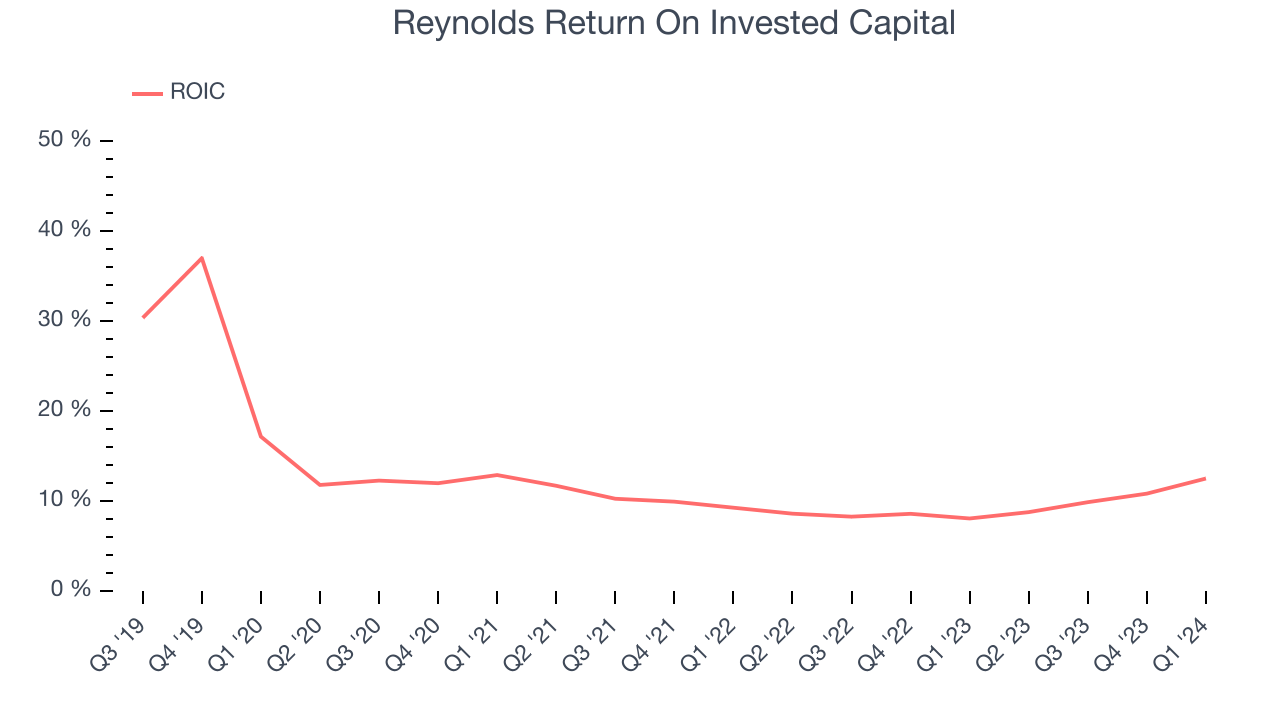
The trend in its ROIC, however, is often what surprises the market and drives the stock price. Unfortunately, Reynolds's ROIC averaged 4.7 percentage point decreases over the last few years. We like what management has done historically but are concerned its ROIC is declining, perhaps a symptom of waning business opportunities to invest profitably.
Balance Sheet Risk
As long-term investors, the risk we care most about is the permanent loss of capital. This can happen when a company goes bankrupt or raises money from a disadvantaged position and is separate from short-term stock price volatility, which we are much less bothered by.
Reynolds reported $135 million of cash and $1.92 billion of debt on its balance sheet in the most recent quarter. As investors in high-quality companies, we primarily focus on two things: 1) that a company's debt level isn't too high and 2) that its interest payments are not excessively burdening the business.
With $675 million of EBITDA over the last 12 months, we view Reynolds's 2.6x net-debt-to-EBITDA ratio as safe. We also see its $113 million of annual interest expenses as appropriate. The company's profits give it plenty of breathing room, allowing it to continue investing in new initiatives.
Key Takeaways from Reynolds's Q1 Results
We were impressed by Reynolds's optimistic earnings forecast for next quarter, which exceeded analysts' expectations. We were also excited its organic revenue growth and adjusted EBITDA both outperformed Wall Street's estimates. On the other hand, its full-year revenue guidance was underwhelming. Overall, we think this was a solid quarter. The stock is up 1.2% after reporting and currently trades at $28.77 per share.
Is Now The Time?
Reynolds may have had a favorable quarter, but investors should also consider its valuation and business qualities when assessing the investment opportunity.
We cheer for all companies serving consumers, but in the case of Reynolds, we'll be cheering from the sidelines. Its revenue growth has been a little slower over the last three years, and analysts expect growth to deteriorate from here. And while its strong free cash flow generation allows it to invest in growth initiatives while maintaining an ample cash cushion, the downside is its shrinking sales volumes suggest it'll need to change its strategy to succeed. On top of that, its declining EPS over the last three years makes it hard to trust.
Reynolds's price-to-earnings ratio based on the next 12 months is 17.3x. While there are some things to like about Reynolds and its valuation is reasonable, we think there are better opportunities elsewhere in the market right now.
Wall Street analysts covering the company had a one-year price target of $30.88 per share right before these results (compared to the current share price of $28.77).
To get the best start with StockStory, check out our most recent stock picks, and then sign up to our earnings alerts by adding companies to your watchlist here. We typically have the quarterly earnings results analyzed within seconds of the data being released, and especially for companies reporting pre-market, this often gives investors the chance to react to the results before the market has fully absorbed the information.