Burger restaurant chain Red Robin (NASDAQ:RRGB) reported results in line with analysts' expectations in Q3 FY2023, with revenue down 3.25% year on year to $277.6 million. The company's outlook for the full year was also close to analysts' estimates with revenue guided to $1.3 billion at the midpoint. Turning to EPS, Red Robin made a non-GAAP loss of $0.79 per share, improving from its loss of $1.03 per share in the same quarter last year.
Is now the time to buy Red Robin? Find out by accessing our full research report, it's free.
Red Robin (RRGB) Q3 FY2023 Highlights:
- Revenue: $277.6 million vs analyst estimates of $275.7 million (small beat)
- EPS (non-GAAP): -$0.79 vs analyst estimates of -$0.85
- The company reconfirmed its revenue guidance for the full year of $1.3 billion at the midpoint
- Gross Margin (GAAP): 12.5%, down from 14% in the same quarter last year
- Same-Store Sales were down 3.4% year on year
- Store Locations: 500 at quarter end, decreasing by 20 over the last 12 months
G.J. Hart, Red Robin’s President and Chief Executive Officer said, "We have made tremendous progress in 2023, first investing in people and hospitality and recently launching quality upgrades to ingredients and offerings across our menu. The enhancements we are making across all touch points continue to resonate with our guests resulting in increases in satisfaction, and we expect will ultimately drive increased traffic counts.”
Known for its bottomless steak fries, Red Robin (NASDAQ:RRGB) is a chain of casual restaurants specializing in burgers and general American fare.
Sit-Down Dining
Sit-down restaurants offer a complete dining experience with table service. These establishments span various cuisines and are renowned for their warm hospitality and welcoming ambiance, making them perfect for family gatherings, special occasions, or simply unwinding. Their extensive menus range from appetizers to indulgent desserts and wines and cocktails. This space is extremely fragmented and competition includes everything from publicly-traded companies owning multiple chains to single-location mom-and-pop restaurants.
Sales Growth
Red Robin is larger than most restaurant chains and benefits from economies of scale, giving it an edge over its smaller competitors.
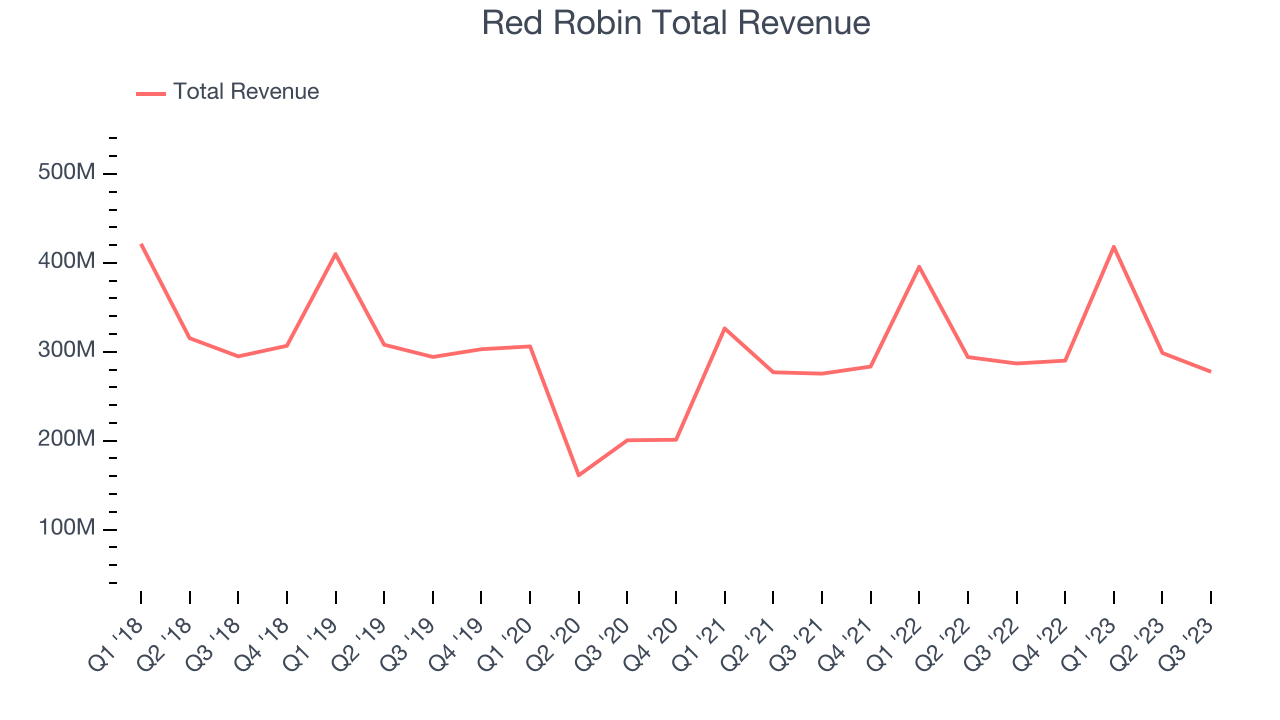
As you can see below, the company's annualized revenue growth rate over the last four years (we compare to 2019 to normalize for COVID-19 impacts) was flat, or negative 0.66%, as it closed restaurants.

This quarter, Red Robin reported a rather uninspiring 3.25% year-on-year revenue decline, in line with Wall Street's estimates.
The pandemic fundamentally changed several consumer habits. There is a founder-led company that is massively benefiting from this shift. The business has grown astonishingly fast, with 40%+ free cash flow margins. Its fundamentals are undoubtedly best-in-class. Still, the total addressable market is so big that the company has room to grow many times in size. You can find it on our platform for free.
Number of Stores
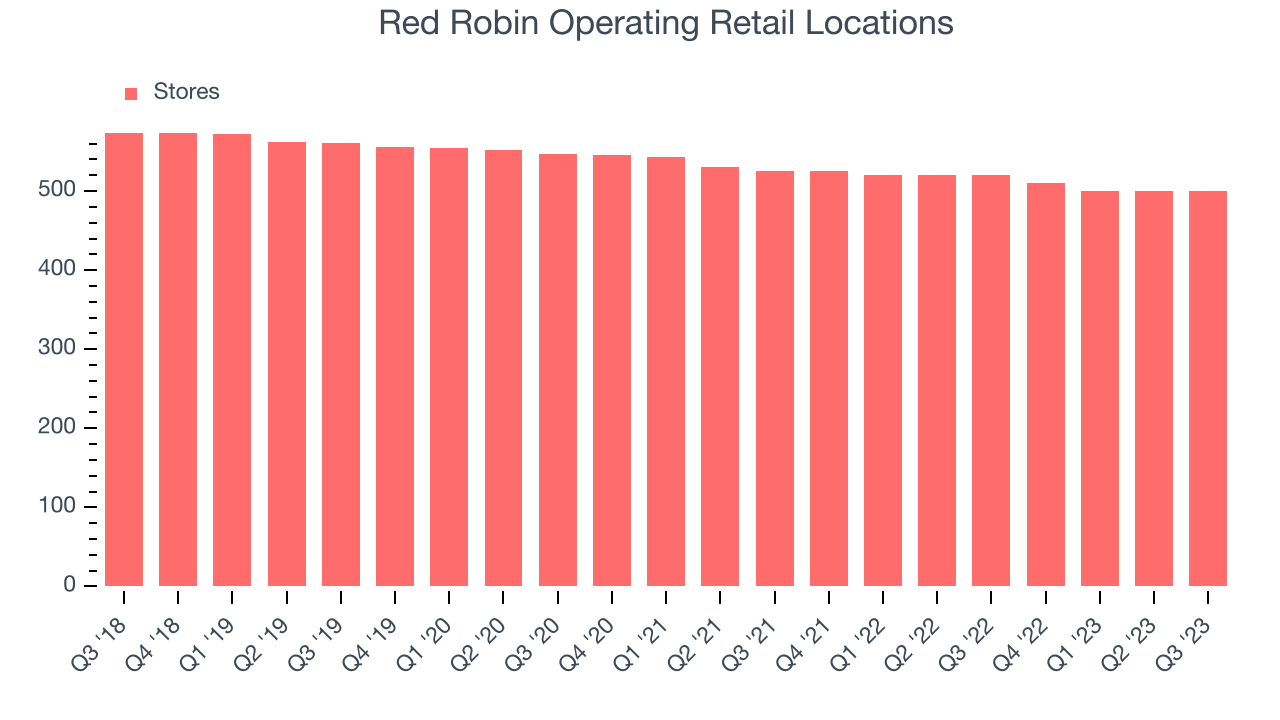
When a chain like Red Robin is shuttering restaurants, it usually means that demand for its meals is waning, and the company is responding by closing underperforming locations to improve profitability. Since last year, Red Robin's restaurant count shrank by 20, or 3.85%, to 500 total locations in the most recently reported quarter.

Taking a step back, Red Robin has generally closed its restaurants over the last two years, averaging 3.19% annual declines in locations. A smaller restaurant base means Red Robin must rely on higher foot traffic, larger order sizes, or price increases at existing restaurants to fuel revenue growth.
Same-Store Sales
Same-store sales growth is an important metric that tracks organic growth and demand for a restaurant's established locations.
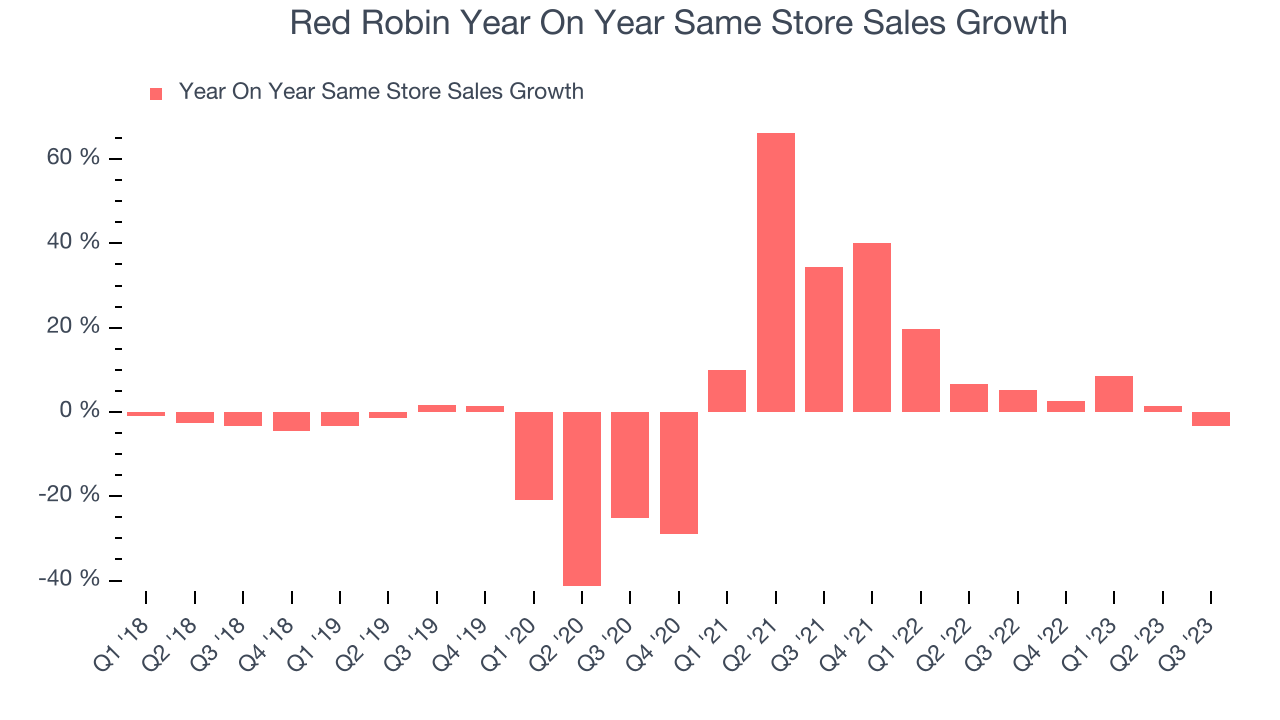
Red Robin's demand has outpaced the broader restaurant sector over the last eight quarters. On average, the company has grown its same-store sales by a robust 10.1% year on year. Given its declining physical footprint base over the same period, this performance stems from increased foot traffic at existing restaurants, which is sometimes a side effect of reducing the total number of locations.

In the latest quarter, Red Robin's same-store sales fell 3.4% year on year. This decline was a reversal from the 5.3% year-on-year increase it posted 12 months ago. A one quarter hiccup isn't material for the long-term prospects of a business, but we'll keep a close eye on the company.
Key Takeaways from Red Robin's Q3 Results
With a market capitalization of $128.9 million and more than $60.8 million in cash on hand, Red Robin can continue prioritizing growth.
It was good to see Red Robin slightly beat analysts' revenue expectations this quarter, driven by better-than-expected same-store sales growth. We were also happy its EPS narrowly outperformed Wall Street's estimates. On the other hand, its gross margin and adjusted EBITDA missed analysts' expectations. Overall, this was a mediocre quarter for Red Robin. The stock is up 2.49% after reporting and currently trades at $8.22 per share.
Red Robin may have had a tough quarter, but does that actually create an opportunity to invest right now? When making that decision, it's important to consider its valuation, business qualities, as well as what has happened in the latest quarter. We cover that in our actionable full research report which you can read here, it's free.
One way to find opportunities in the market is to watch for generational shifts in the economy. Almost every company is slowly finding itself becoming a technology company and facing cybersecurity risks and as a result, the demand for cloud-native cybersecurity is skyrocketing. This company is leading a massive technological shift in the industry and with revenue growth of 50% year on year and best-in-class SaaS metrics it should definitely be on your radar.
Join Paid Stock Investor Research
Help us make StockStory more helpful to investors like yourself. Join our paid user research session and receive a $50 Amazon gift card for your opinions. Sign up here.
The author has no position in any of the stocks mentioned in this report.
