
Burger restaurant chain Red Robin (NASDAQ:RRGB) reported Q4 FY2023 results topping analysts' expectations, with revenue up 6.5% year on year to $309 million. On the other hand, the company's full-year revenue guidance of $1.26 billion at the midpoint came in 1.5% below analysts' estimates. It made a non-GAAP loss of $0.66 per share, improving from its loss of $1.35 per share in the same quarter last year.
Red Robin (RRGB) Q4 FY2023 Highlights:
- Revenue: $309 million vs analyst estimates of $305 million (1.3% beat)
- EPS (non-GAAP): -$0.66 vs analyst estimates of -$0.46
- Management's revenue guidance for the upcoming financial year 2024 is $1.26 billion at the midpoint, missing analyst estimates by 1.5% and implying -3.1% growth (vs 2.6% in FY2023)
- Gross Margin (GAAP): 14.5%, down from 14.9% in the same quarter last year
- Same-Store Sales were down 2.7% year on year (miss vs. expectations of down 0.8% year on year)
- Market Capitalization: $136.2 million
Known for its bottomless steak fries, Red Robin (NASDAQ:RRGB) is a chain of casual restaurants specializing in burgers and general American fare.
Initially started as a tavern called Sam’s, Red Robin Gourmet Burgers was founded in 1969 in Seattle, Washington. Today, the chain boasts a vast, customizable burger menu that includes everything from classic cheeseburgers to the daring Banzai burger featuring a Teriyaki-glazed patty topped with sweet grilled pineapple. For those who don’t love burgers, Red Robin also offers chicken entrees, salads, and kids’ meals such as corn dogs.
The core Red Robin customer is the everyday American family looking to celebrate a birthday, a little league victory, or a job promotion. With its reasonable prices for a sit-down restaurant, it can also serve as the destination for a family’s Thursday night dinner as well.
When you walk into a Red Robin, you'll typically find a spacious, lively setup. On average, these establishments cover anywhere from 4,000 to 5,500 square feet. Red Robin locations have ample seating, often using a mix of booths, tables, and a bar area, allowing for both intimate dinners and larger gatherings. To complete the look, there are typically bright colors (especially Red Robin’s signature red, warm woods, and playful memorabilia.
Sit-Down Dining
Sit-down restaurants offer a complete dining experience with table service. These establishments span various cuisines and are renowned for their warm hospitality and welcoming ambiance, making them perfect for family gatherings, special occasions, or simply unwinding. Their extensive menus range from appetizers to indulgent desserts and wines and cocktails. This space is extremely fragmented and competition includes everything from publicly-traded companies owning multiple chains to single-location mom-and-pop restaurants.
Competitors offering burgers and American fare in a sit-down restaurant format include Chili’s owner Brinker International (NYSE:EAT), Applebee’s owner Dine Brands (NYSE:DIN), Texas Roadhouse (NASDAQ:TXRH), and The Cheesecake Factory (NASDAQ:CAKE).Sales Growth
Red Robin is larger than most restaurant chains and benefits from economies of scale, giving it an edge over its smaller competitors.
As you can see below, the company's revenue was flat over the last four years (we compare to 2019 to normalize for COVID-19 impacts) as it closed restaurants.
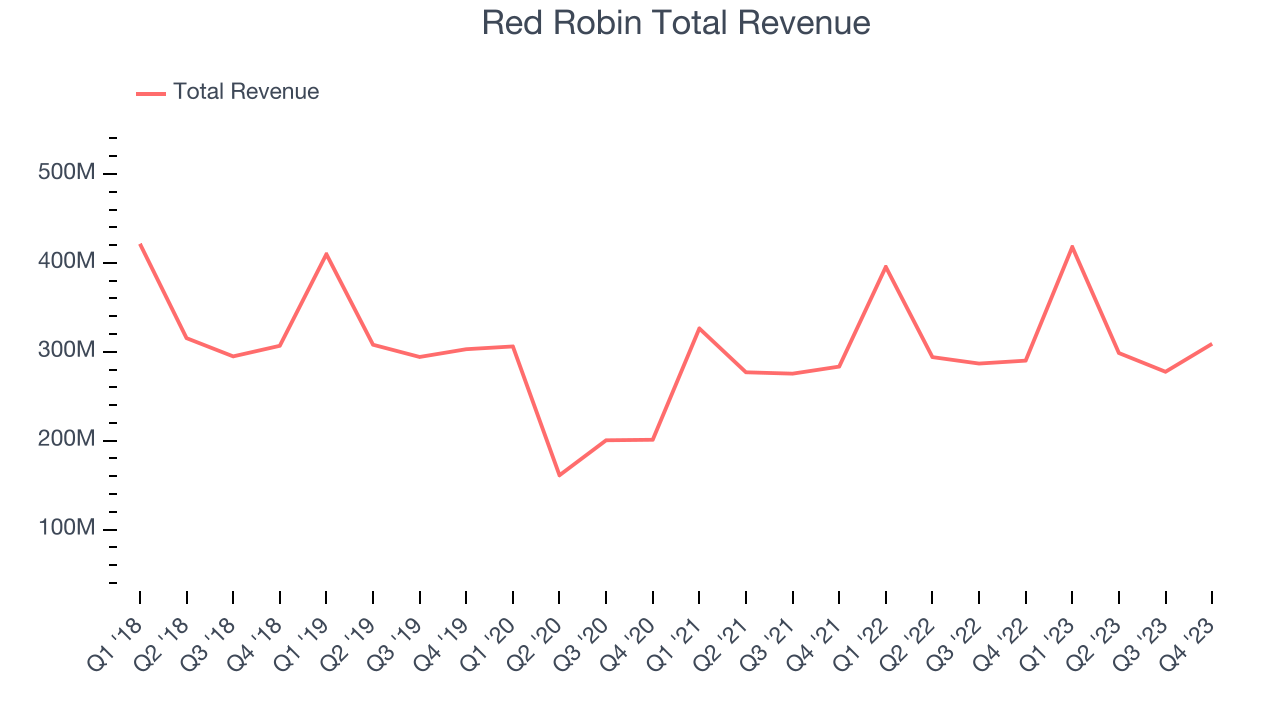
This quarter, Red Robin reported solid year-on-year revenue growth of 6.5%, and its $309 million in revenue outperformed Wall Street's estimates by 1.3%. Looking ahead, Wall Street expects revenue to decline 1.4% over the next 12 months, a deceleration from this quarter.
Same-Store Sales
Red Robin has been one of the most successful restaurants over the last two years thanks to skyrocketing demand within its existing locations. On average, the company has posted impressive year-on-year same-store sales growth of 14.8%. Given its declining physical footprint base over the same period, this performance stems from increased foot traffic at existing restaurants, which is sometimes a side effect of reducing the total number of locations.
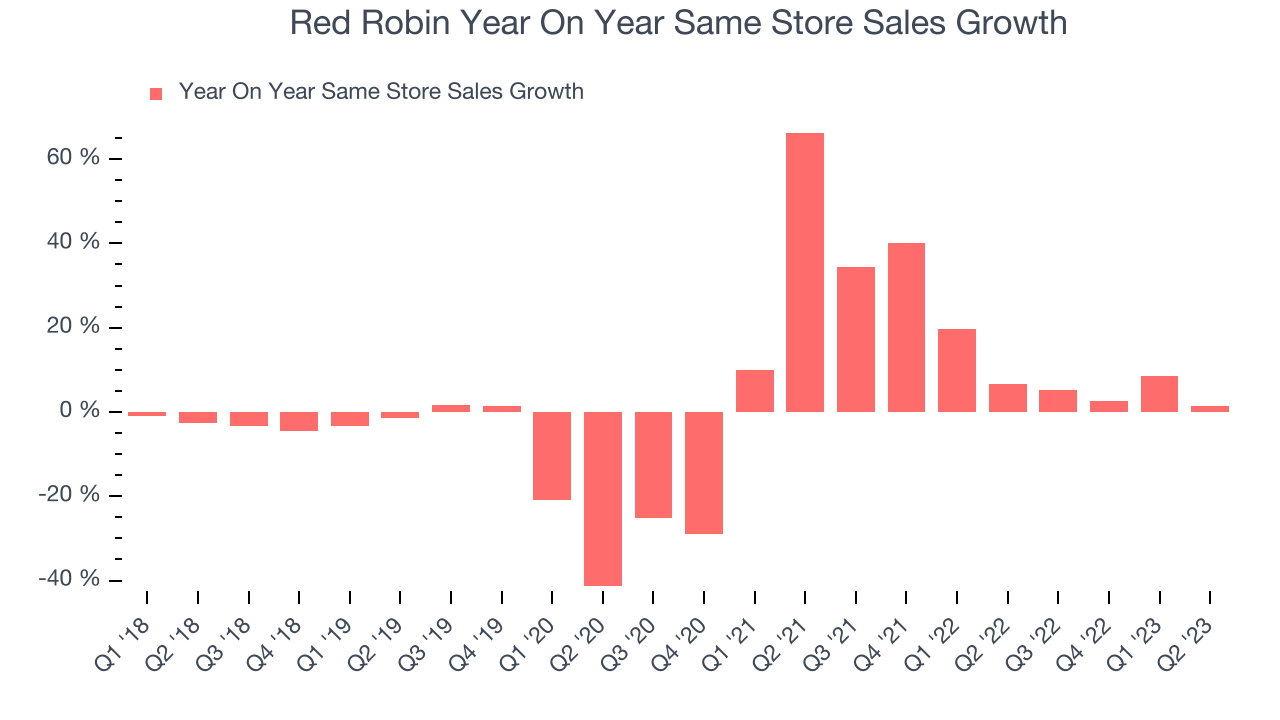
In the latest quarter, Red Robin's same-store sales rose 1.5% year on year. By the company's standards, this growth was a meaningful deceleration from the 6.7% year-on-year increase it posted 12 months ago. One quarter fluctuations aren't material for the long-term prospects of a business, but we'll watch Red Robin closely to see if it can reaccelerate growth.
Same-Store Sales
Red Robin's demand within its existing restaurants has generally risen over the last two years but lagged behind the broader sector. On average, the company's same-store sales have grown by 4.8% year on year. Given its declining physical footprint over the same period, this performance stems from increased foot traffic at existing restaurants, which is sometimes a side effect of reducing the total number of locations.
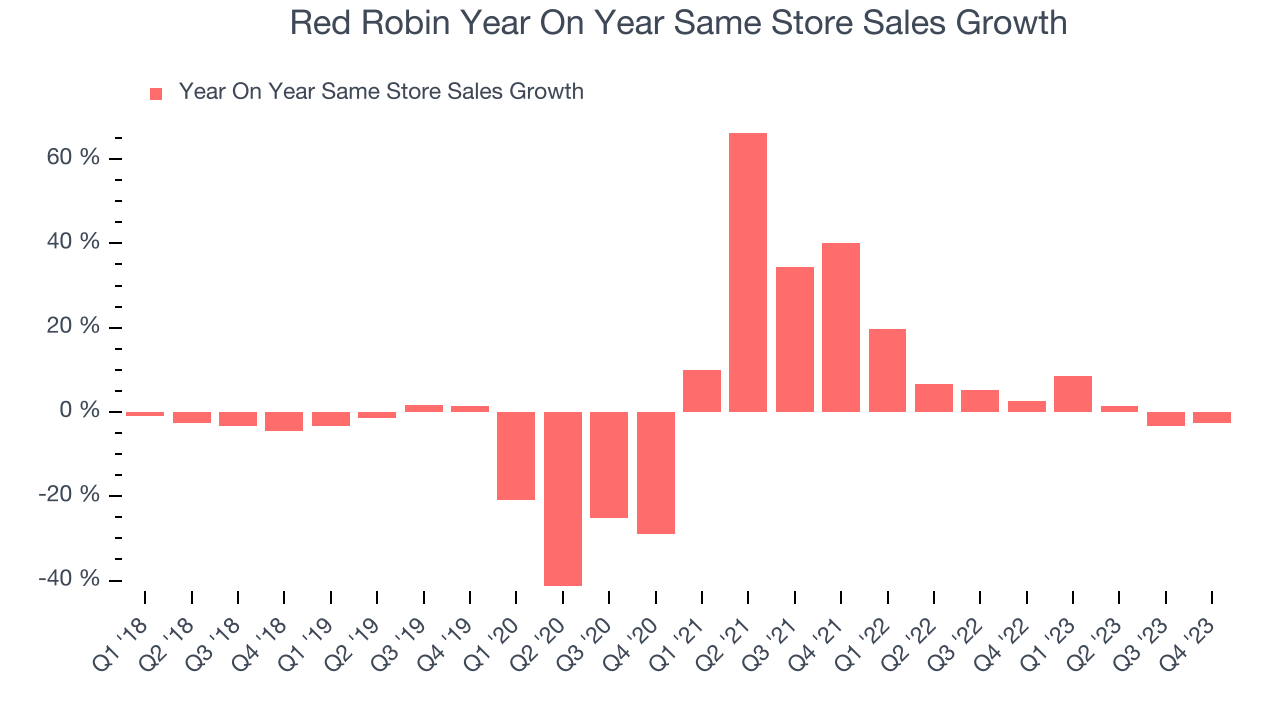
In the latest quarter, Red Robin's same-store sales fell 2.7% year on year. This decline was a reversal from the 2.5% year-on-year increase it posted 12 months ago. We'll be keeping a close eye on the company to see if this turns into a longer-term trend.
Gross Margin & Pricing Power
We prefer higher gross margins because they make it easier to generate more operating profits.
Red Robin's gross profit margin came in at 14.5% this quarter. in line with the same quarter last year. This means the company makes $0.15 for every $1 in revenue before accounting for its operating expenses. 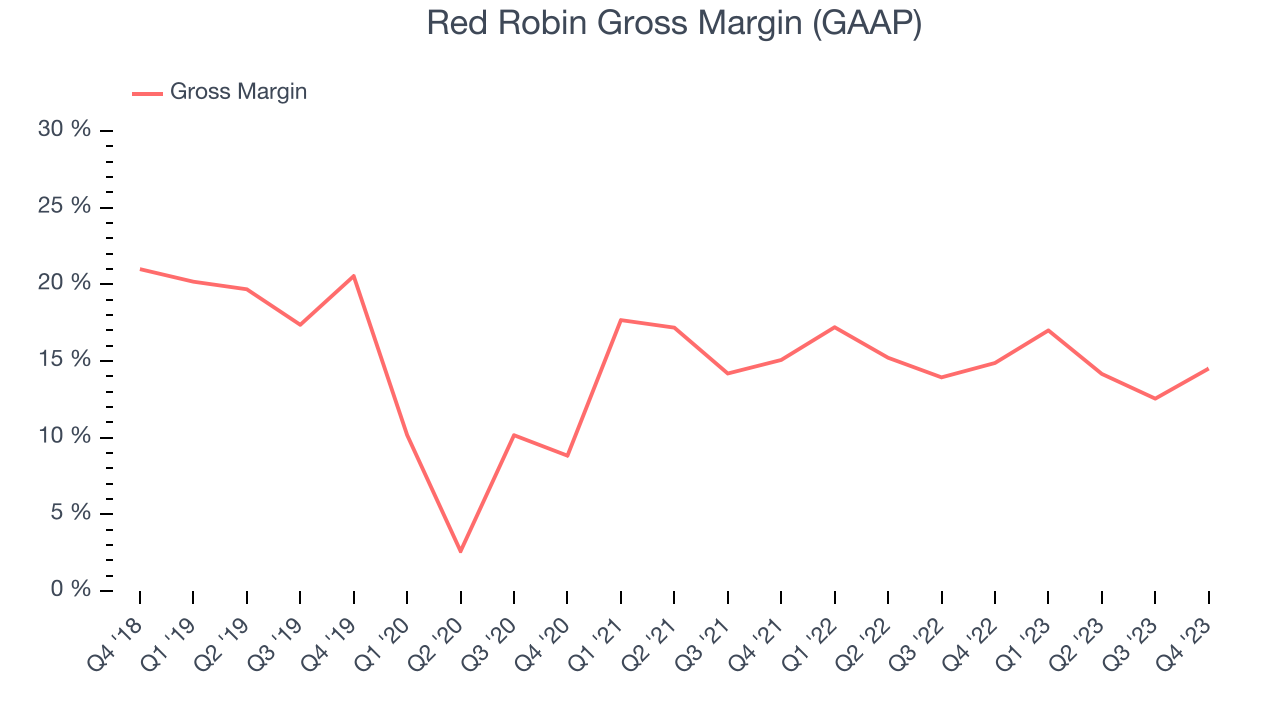
Red Robin has poor unit economics for a restaurant company, leaving it with little room for error if things go awry. As you can see above, it's averaged a 15.1% gross margin over the last two years. Its margin has also been trending down over the last year, averaging 5.1% year-on-year decreases each quarter. If this trend continues, it could suggest a more competitive environment where Red Robin has diminishing pricing power and less favorable input costs (such as ingredients and transportation expenses).
Operating Margin
Operating margin is an important measure of profitability for restaurants as it accounts for all expenses keeping the lights on, including wages, rent, advertising, and other administrative costs.
In Q4, Red Robin generated an operating profit margin of negative 2.6%, up 11 percentage points year on year. This increase was encouraging, and since the company's gross margin actually decreased, we can assume the rise was driven by a magnificent improvement in cost controls or leverage on fixed costs.
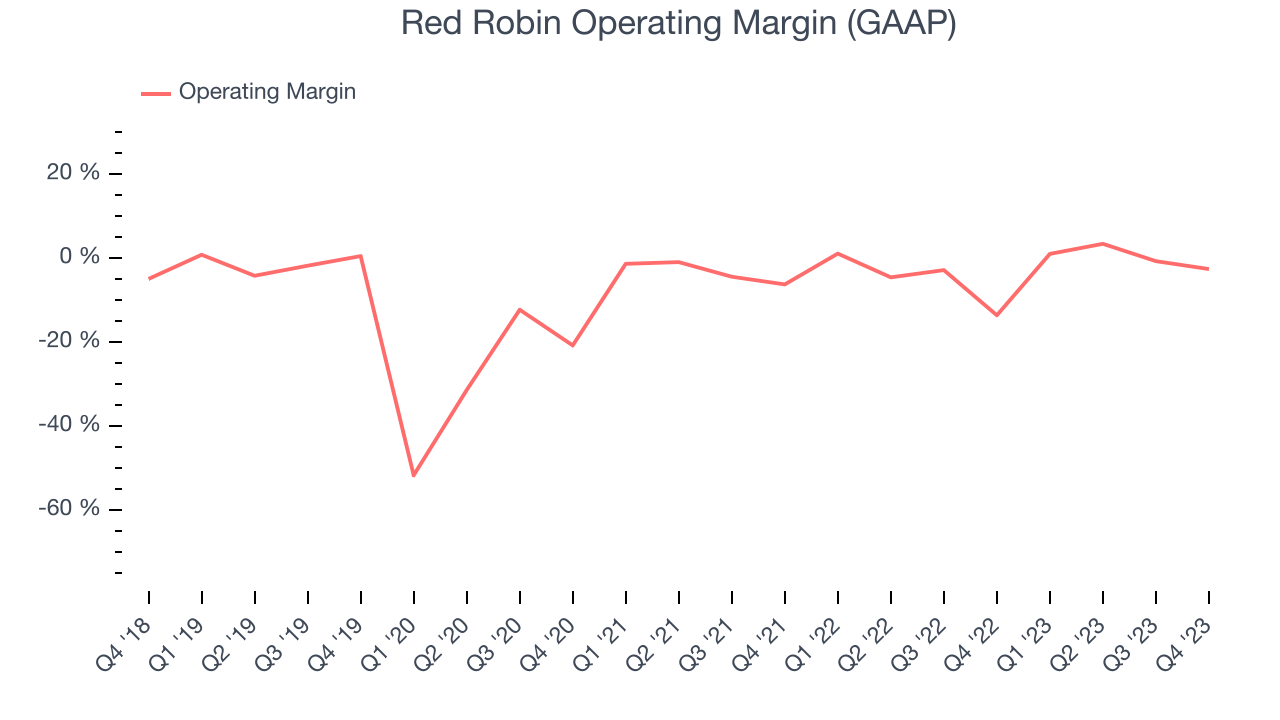 The restaurant business is tough to succeed in because of its unpredictability, whether it be employees not showing up for work, sudden changes in consumer preferences, or the cost of ingredients rising thanks to supply shortages. Unfortunately, Red Robin has been a victim of these challenges over the last two years, and its high expenses have contributed to an average operating margin of negative 2%. However, Red Robin's margin has improved, on average, by 4.8 percentage points each year, an encouraging sign for shareholders. The tide could be turning.
Operating Margin
Operating margin is a key profitability metric for restaurants because it accounts for all expenses that keep the lights on, including wages, rent, advertising, and other administrative costs.
In Q2, Red Robin generated an operating profit margin of negative 0.12%, up 1.7 percentage points year on year. This increase was encouraging, and since the company's gross margin actually decreased, we can assume the rise was driven by a magnificent improvement in cost controls or leverage on fixed costs.
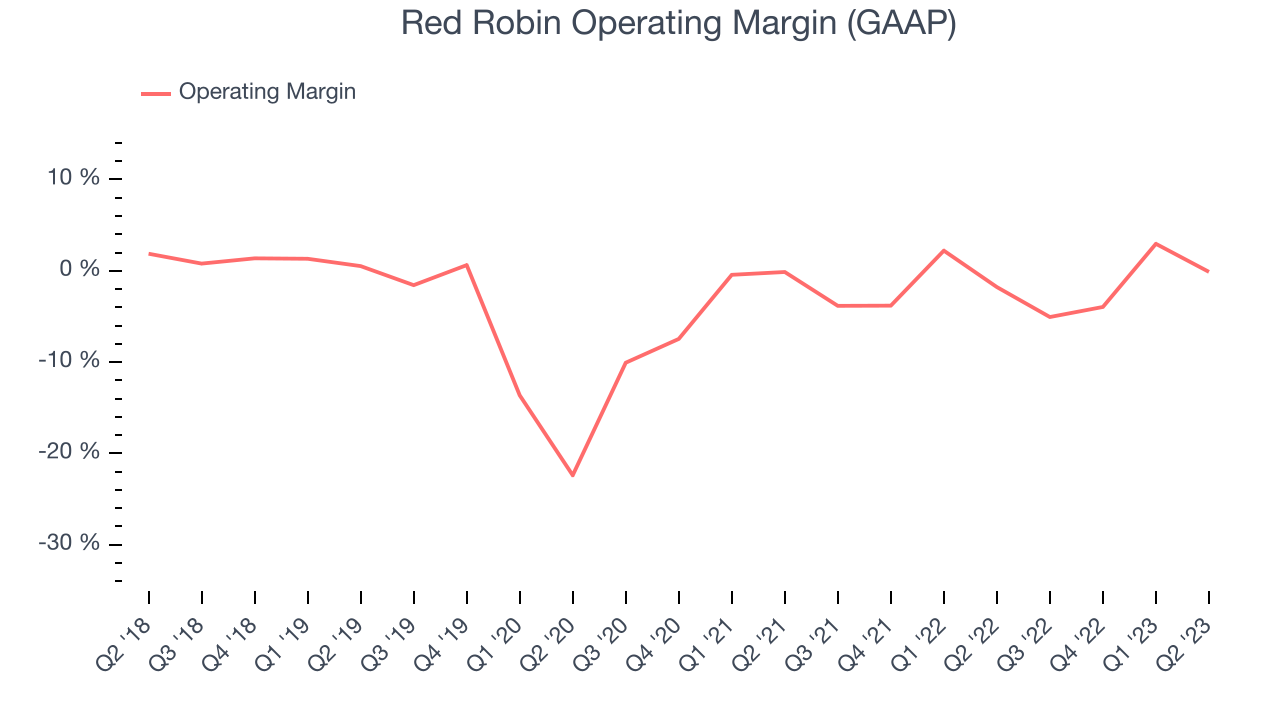
The restaurant business is tough to succeed in because of its unpredictability, whether it be employees not showing up for work, sudden changes in consumer preferences, or the cost of ingredients skyrocketing thanks to supply shortages. Red Robin has been a victim of these challenges over the last two years, and its high expenses have contributed to an average operating margin of negative 1.68%. On top of that, Red Robin's margin has remained more or less the same during the same time, showing that the company needs to change something about its operating practices.
EPS
These days, some companies issue new shares like there's no tomorrow. That's why we like to track earnings per share (EPS) because it accounts for shareholder dilution and share buybacks.
In Q4, Red Robin reported EPS at negative $0.66, up from negative $1.35 in the same quarter a year ago. This print unfortunately missed Wall Street's estimates, but we care more about long-term EPS growth rather than short-term movements.
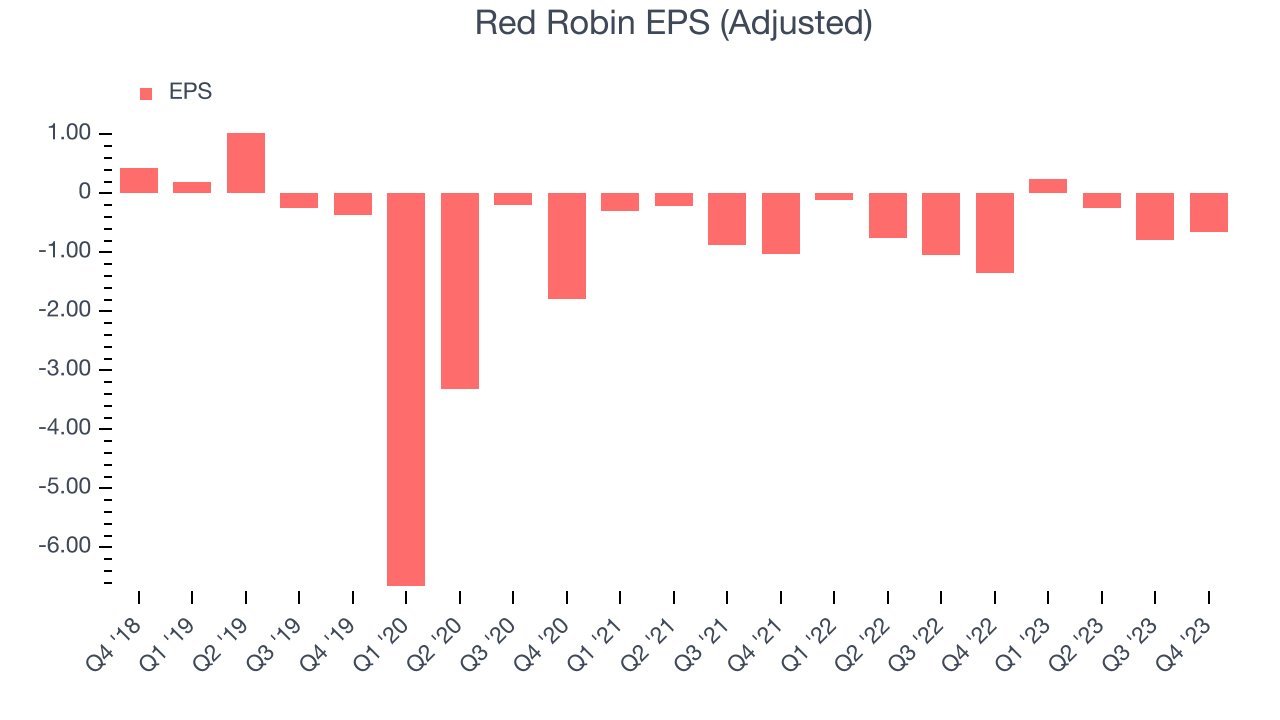
Between FY2019 and FY2023, Red Robin's adjusted diluted EPS dropped 90.3%, translating into 44.2% annualized declines. We tend to steer our readers away from companies with falling EPS, especially restaurants, which are arguably some of the hardest businesses to manage because of constantly changing consumer tastes, input costs, and labor dynamics. If there's no earnings growth, it's difficult to build confidence in a company's underlying fundamentals, leaving a low margin of safety around its valuation (making the stock susceptible to large downward swings).
On the bright side, Wall Street expects the company's earnings to grow over the next 12 months, with analysts projecting an average 53% year-on-year increase in EPS.
Return on Invested Capital (ROIC)
EPS and free cash flow tell us whether a company was profitable while growing revenue. But was it capital-efficient? A company’s ROIC explains this by showing how much operating profit a company makes compared to how much money the business raised (debt and equity).
Red Robin's five-year average ROIC was negative 8.9%, meaning management lost money while trying to expand the business. Its returns were among the worst in the restaurant sector.
The trend in its ROIC, however, is often what surprises the market and drives the stock price. Over the last two years, Red Robin's ROIC averaged 11.7 percentage point increases each year. This is a good sign and we hope the company can continue to improving.
Key Takeaways from Red Robin's Q4 Results
We liked how revenue outperformed Wall Street's estimates. On the other hand, its EPS missed and its full-year revenue guidance was below Wall Street's estimates. Overall, this was a mediocre quarter for Red Robin. The company is down 11% on the results and currently trades at $7.65 per share.
Is Now The Time?
When considering an investment in Red Robin, investors should take into account its valuation and business qualities as well as what's happened in the latest quarter.
We cheer for all companies serving consumers, but in the case of Red Robin, we'll be cheering from the sidelines. Its revenue has declined over the last four years, and analysts expect growth to deteriorate from here. And while its projected EPS for the next year implies the company's fundamentals will improve, the downside is its declining EPS over the last four years makes it hard to trust. On top of that, its relatively low ROIC suggests it has struggled to grow profits historically.
While we've no doubt one can find things to like about Red Robin, we think there are better opportunities elsewhere in the market. We don't see many reasons to get involved at the moment.
Wall Street analysts covering the company had a one-year price target of $16.50 per share right before these results (compared to the current share price of $7.65).
To get the best start with StockStory, check out our most recent stock picks, and then sign up to our earnings alerts by adding companies to your watchlist here. We typically have the quarterly earnings results analyzed within seconds of the data being released, and especially for companies reporting pre-market, this often gives investors the chance to react to the results before the market has fully absorbed the information.
Is Now The Time?
When considering an investment in Red Robin, investors should take into account its valuation and business qualities as well as what's happened in the latest quarter.
We cheer for everyone who's improving the lives of others, but in the case of Red Robin, we'll be cheering from the sidelines. And while its wonderful same-store sales growth has been among the best in the restaurant sector, the downside is that its relatively low ROIC suggests suboptimal profitability prospects. On top of that, its operating margins reveal poor profitability compared to other restaurants.
Red Robin's price-to-earnings ratio based on the next 12 months is -6.6x. While we think the price is reasonable and there are some things to like about Red Robin, at the moment, we think there might be better opportunities elsewhere in the market.
To get the best start with StockStory, check out our most recent stock picks and then sign up to our earnings alerts by adding companies to your watchlist here. We typically have the quarterly earnings results analyzed within seconds of the data being released, and especially for companies reporting pre-market, this often gives investors the chance to react to the results before the market has fully absorbed the information.