
Casino resort and entertainment company Red Rock Resorts (NASDAQ:RRR) reported results in line with analysts' expectations in Q1 CY2024, with revenue up 12.7% year on year to $488.9 million. It made a GAAP profit of $0.68 per share, improving from its profit of $0.43 per share in the same quarter last year.
Red Rock Resorts (RRR) Q1 CY2024 Highlights:
- Revenue: $488.9 million vs analyst estimates of $490.7 million (small miss)
- EPS: $0.68 vs analyst estimates of $0.65 (4% beat)
- Gross Margin (GAAP): 62.9%, down from 64.7% in the same quarter last year
- Market Capitalization: $3.21 billion
Founded in 1976, Red Rock Resorts (NASDAQ:RRR) operates a range of casino resorts and entertainment properties, primarily in the Las Vegas metropolitan area.
Red Rock Resorts was founded by Frank Fertitta Jr. with the vision of providing a gaming and hospitality experience tailored to Las Vegas locals. Beginning with The Casino, later renamed Palace Station, the company aimed to provide a comfortable, community-focused alternative to the tourist-centric establishments of the Strip. This approach marked a shift in the local gaming and hospitality landscape, catering to residents and tourists.
The company’s operations span various properties, from local casinos to upscale resorts like Red Rock Casino and Green Valley Ranch Resort Spa & Casino. These establishments offer a mix of gaming, accommodations, dining, and entertainment. Red Rock Resorts has successfully bridged the gap between local preferences and tourist attractions, providing varied leisure experiences in the Las Vegas area.
Revenue for Red Rock Resorts comes from gaming, hotel services, dining, and entertainment. Its business model focuses on delivering an all-encompassing entertainment experience that resonates with both locals and tourists.
Casino Operator
Casino operators enjoy limited competition because gambling is a highly regulated industry. These companies can also enjoy healthy margins and profits. Have you ever heard the phrase ‘the house always wins’? Regulation cuts both ways, however, and casinos may face stroke-of-the-pen risk that suddenly limits what they can or can't do and where they can do it. Furthermore, digitization is changing the game, pun intended. Whether it’s online poker or sports betting on your smartphone, innovation is forcing these players to adapt to changing consumer preferences, such as being able to wager anywhere on demand.
Competitors in the gaming and hospitality sector include Boyd Gaming (NYSE:BYD), Golden Entertainment (NASDAQ:GDEN), and MGM Resorts (NYSE:MGM).Sales Growth
Examining a company's long-term performance can provide clues about its business quality. Any business can put up a good quarter or two, but the best consistently grow over the long haul. Red Rock Resorts's revenue was flat over the last five years. 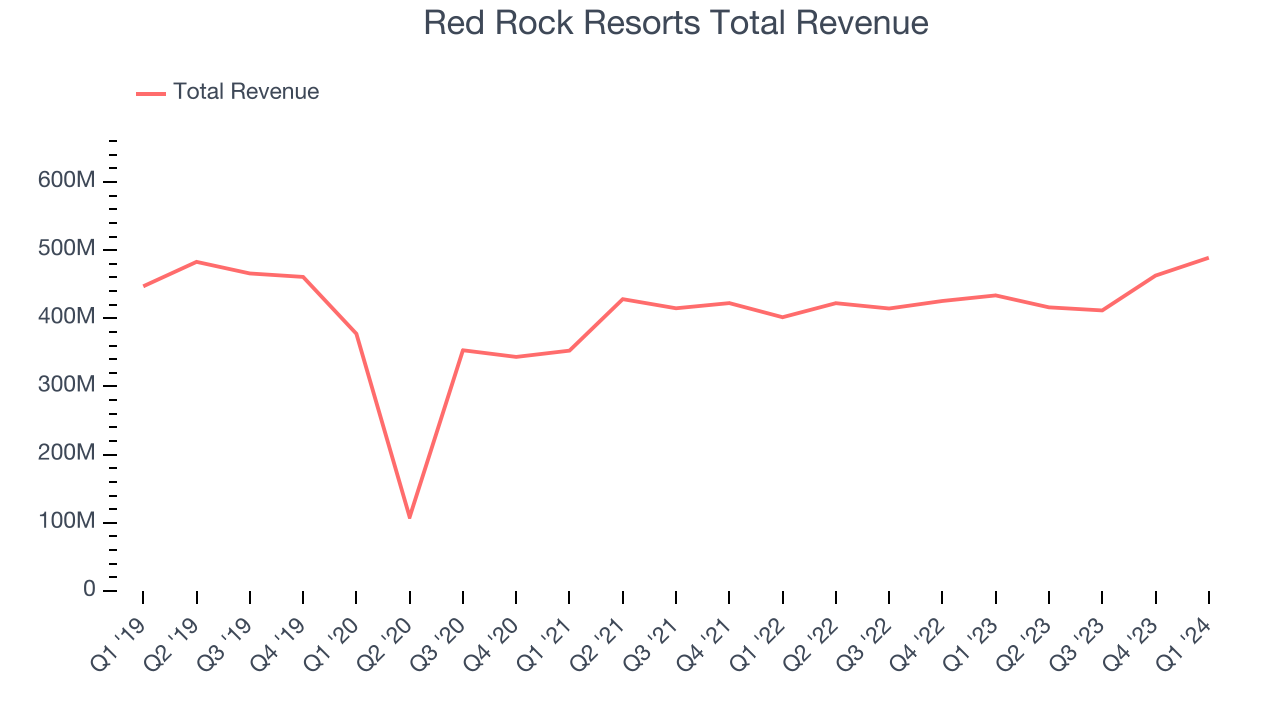 Within consumer discretionary, a long-term historical view may miss a company riding a successful new product or emerging trend. That's why we also follow short-term performance. Red Rock Resorts's annualized revenue growth of 3.3% over the last two years is above its five-year trend, suggesting some bright spots.
We can better understand the company's revenue dynamics by analyzing its three most important segments: Casino, Dining, and Hotel, which are 64.8%, 19.1%, and 10.8% of revenue. Over the last two years, Red Rock Resorts's Casino revenue (Blackjack, Poker) was flat while its Dining (food and beverage) and Hotel (overnight stays) revenues averaged 11.5% and 10.1% year-on-year growth.
This quarter, Red Rock Resorts's year-on-year revenue growth clocked in at 12.7%, and its $488.9 million of revenue was line with Wall Street's estimates. Looking ahead, Wall Street expects sales to grow 9.9% over the next 12 months, a deceleration from this quarter.
Operating Margin
Operating margin is an important measure of profitability. It’s the portion of revenue left after accounting for all core expenses–everything from the cost of goods sold to advertising and wages. Operating margin is also useful for comparing profitability across companies with different levels of debt and tax rates because it excludes interest and taxes.
Red Rock Resorts has been a well-oiled machine over the last two years. It's demonstrated elite profitability for a consumer discretionary business, boasting an average operating margin of 33.1%.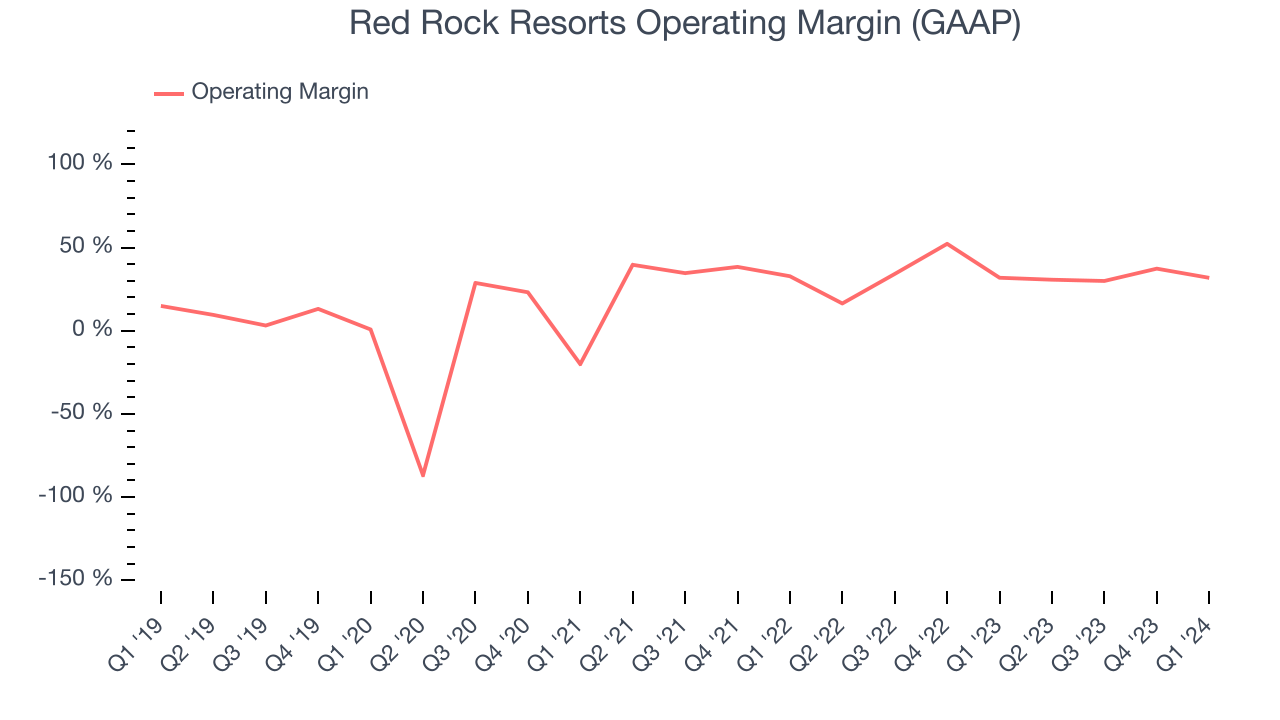
In Q1, Red Rock Resorts generated an operating profit margin of 31.8%, in line with the same quarter last year. This indicates the company's costs have been relatively stable.
Over the next 12 months, Wall Street expects Red Rock Resorts to maintain its LTM operating margin of 32.5%.EPS
Analyzing long-term revenue trends tells us about a company's historical growth, but the long-term change in its earnings per share (EPS) points to the profitability and efficiency of that growth–for example, a company could inflate its sales through excessive spending on advertising and promotions. 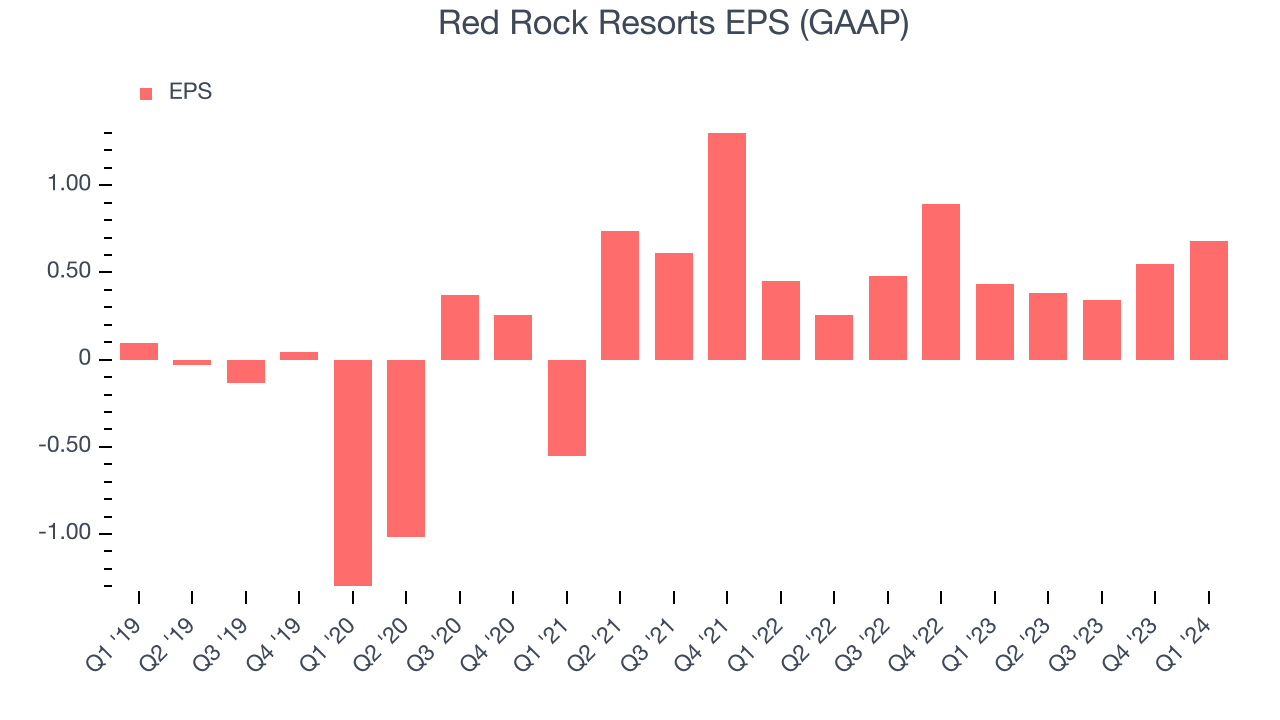
Over the last five years, Red Rock Resorts's EPS grew 94%, translating into a solid 14.2% compounded annual growth rate. This performance is materially higher than its flat revenue over the same period. There are a few reasons for this, and understanding why can shed light on its fundamentals.
While we mentioned earlier that Red Rock Resorts's operating margin was flat this quarter, a five-year view shows its margin has expanded 16.9 percentage points while its share count has shrunk 11.1%. Improving profitability and share buybacks are positive signs as they juice EPS growth relative to revenue growth.In Q1, Red Rock Resorts reported EPS at $0.68, up from $0.43 in the same quarter last year. This print beat analysts' estimates by 4%. Over the next 12 months, Wall Street expects Red Rock Resorts to grow its earnings. Analysts are projecting its LTM EPS of $1.95 to climb by 25.5% to $2.45.
Return on Invested Capital (ROIC)
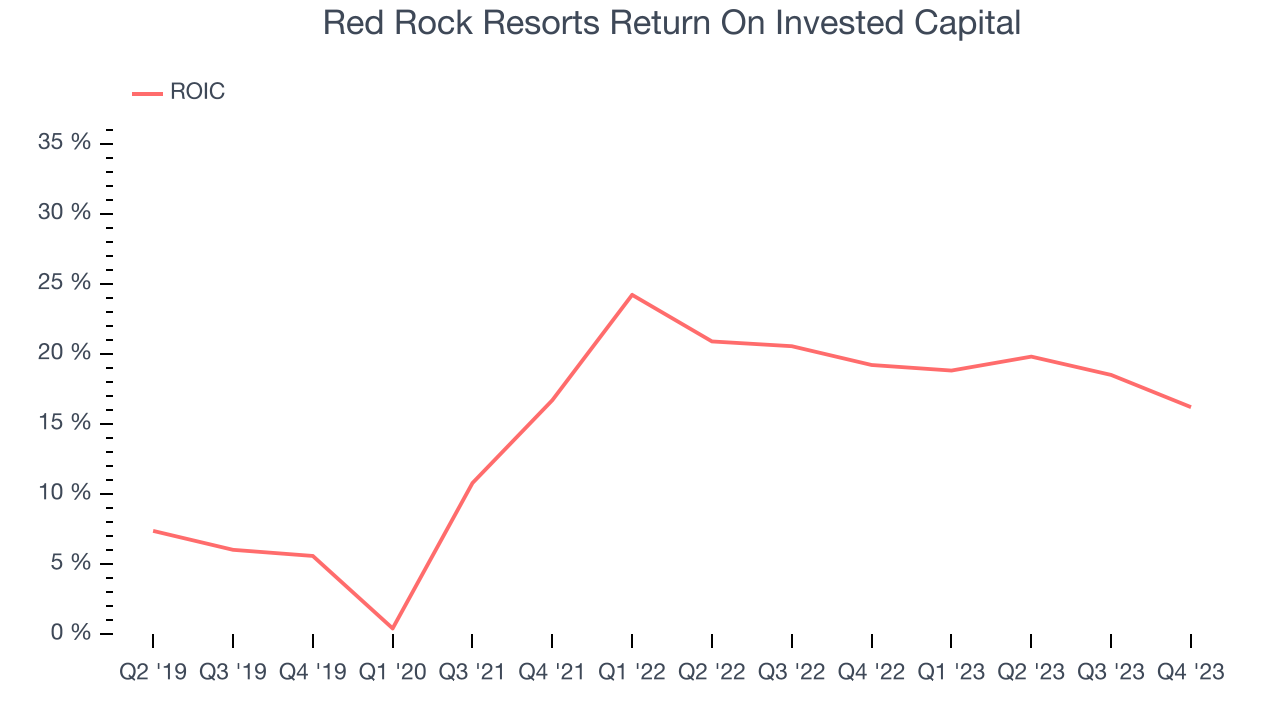
EPS and free cash flow tell us whether a company was profitable while growing revenue. But was it capital-efficient? A company’s ROIC explains this by showing how much operating profit a company makes compared to how much money the business raised (debt and equity).
Red Rock Resorts's five-year average return on invested capital was 14.5%, somewhat low compared to the best consumer discretionary companies that pump out 25%+. Its returns suggest it historically did a subpar job investing in profitable business initiatives.
Key Takeaways from Red Rock Resorts's Q1 Results
It was good to see Red Rock Resorts beat analysts' Dining revenue expectations this quarter. We were also happy its EPS narrowly outperformed Wall Street's estimates. On the other hand, its total revenue and operating margin missed. Overall, the results could have been better. The company is down 5.8% on the results and currently trades at $51.2 per share.
Is Now The Time?
When considering an investment in Red Rock Resorts, investors should take into account its valuation and business qualities as well as what's happened in the latest quarter.
We cheer for all companies serving consumers, but in the case of Red Rock Resorts, we'll be cheering from the sidelines. Its revenue growth has been weak over the last five years, but at least growth is expected to increase in the short term. And while its impressive operating margins show it has a highly efficient business model, unfortunately, its cash burn raises the question of whether it can sustainably maintain growth.
Red Rock Resorts's price-to-earnings ratio based on the next 12 months is 26.8x. While there are some things to like about Red Rock Resorts and its valuation is reasonable, we think there are better opportunities elsewhere in the market right now.
Wall Street analysts covering the company had a one-year price target of $63.50 per share right before these results (compared to the current share price of $51.20).
To get the best start with StockStory, check out our most recent stock picks, and then sign up for our earnings alerts by adding companies to your watchlist here. We typically have the quarterly earnings results analyzed within seconds of the data being released, and especially for companies reporting pre-market, this often gives investors the chance to react to the results before the market has fully absorbed the information.