
Television broadcasting and media company Sinclair (NASDAQ:SBGI) fell short of analysts' expectations in Q1 CY2024, with revenue up 3.2% year on year to $798 million. On the other hand, next quarter's revenue guidance of $833 million came in slightly above analysts' estimates. It made a GAAP profit of $0.35 per share, down from its profit of $2.65 per share in the same quarter last year.
Sinclair (SBGI) Q1 CY2024 Highlights:
- Revenue: $798 million vs analyst estimates of $802.4 million (small miss)
- EPS: $0.35 vs analyst estimates of -$0.25 ($0.60 beat)
- Revenue Guidance for Q2 CY2024 is $833 million at the midpoint, above analyst estimates of $825 million (adjusted EBITDA guidance for Q2 also ahead)
- Market Capitalization: $879.9 million
Founded in 1971, Sinclair (NASDAQ:SBGI) is an American media company operating numerous television stations and providing multi-platform broadcasting services.
Sinclair started with a single TV station in Baltimore and has grown to focus on local broadcasting, aiming to provide communities with regional news, sports, and entertainment programming.
Today, the company owns and operates an extensive network of television stations in the U.S. and engages in digital media, broadening its scope to include various media services. Its operations address the demand for localized content, fulfilling a key role in community information and entertainment.
Sinclair’s revenues come from advertising sales, content distribution fees, and digital media. Its business model leverages its network of local stations for targeted advertising, appealing to advertisers seeking regional markets.
Broadcasting
Broadcasting companies have been facing secular headwinds in the form of consumers abandoning traditional television and radio in favor of streaming services. As a result, many broadcasting companies have evolved by forming distribution agreements with major streaming platforms so they can get in on part of the action, but will these subscription revenues be as high quality and high margin as their legacy revenues? Only time will tell which of these broadcasters will survive the sea changes of technological advancement and fragmenting consumer attention.
Competitors in the television broadcasting and media industry include Nexstar Media (NASDAQ:NXST), Gray Television (NYSE:GTN), and TEGNA (NYSE:TGNA).Sales Growth
A company’s long-term performance can give signals about its business quality. Even a bad business can shine for one or two quarters, but a top-tier one may grow for years. Sinclair's revenue was flat over the last five years. 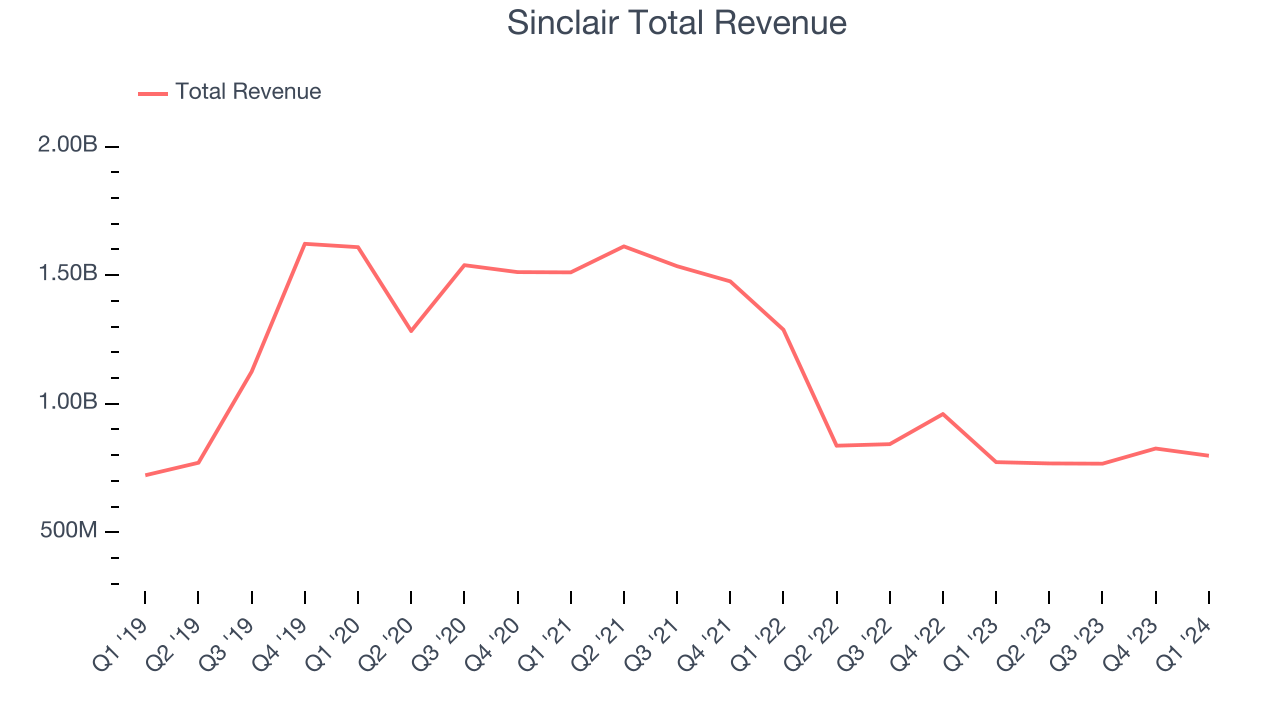 Within consumer discretionary, a long-term historical view may miss a company riding a successful new product or emerging trend. That's why we also follow short-term performance. Sinclair's recent history shows a reversal from its five-year trend as its revenue has shown annualized declines of 26.9% over the last two years.
This quarter, Sinclair's revenue grew 3.2% year on year to $798 million, falling short of Wall Street's estimates. The company is guiding for revenue to rise 8.5% year on year to $833 million next quarter, improving from the 8.2% year-on-year decrease it recorded in the same quarter last year. Looking ahead, Wall Street expects sales to grow 13.5% over the next 12 months, an acceleration from this quarter.
Operating Margin
Operating margin is a key measure of profitability. Think of it as net income–the bottom line–excluding the impact of taxes and interest on debt, which are less connected to business fundamentals.
Sinclair was profitable over the last two years but held back by its large expense base. Its average operating margin of 3.4% has been paltry for a consumer discretionary business.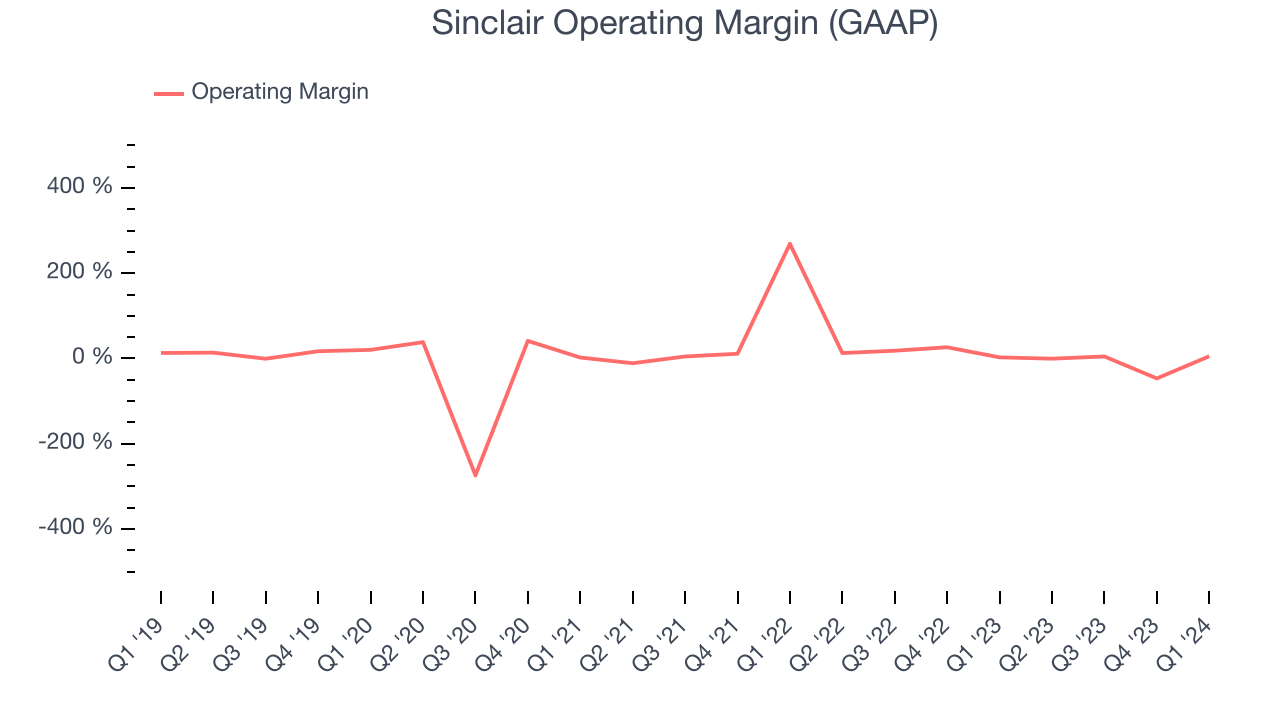
In Q1, Sinclair generated an operating profit margin of 5.3%, up 2.5 percentage points year on year.
Over the next 12 months, Wall Street expects Sinclair to become profitable. Analysts are expecting the company’s LTM operating margin of negative 9.8% to rise to positive 15.2%.EPS
Analyzing long-term revenue trends tells us about a company's historical growth, but the long-term change in its earnings per share (EPS) points to the profitability and efficiency of that growth–for example, a company could inflate its sales through excessive spending on advertising and promotions. 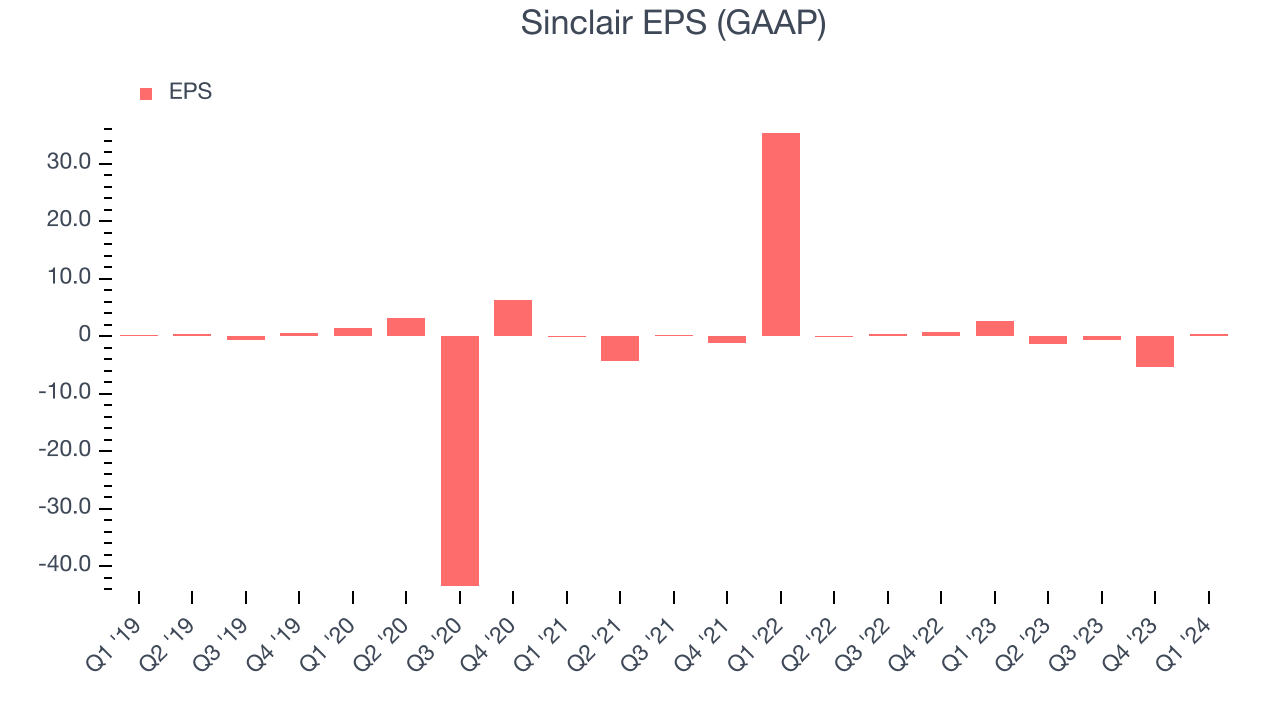
Over the last five years, Sinclair's EPS dropped 321%, translating into 33.3% annualized declines. Thankfully, Sinclair has bucked its trend as of late, growing its EPS over the last three years. We'll see if the company's growth is sustainable.
In Q1, Sinclair reported EPS at $0.35, down from $2.65 in the same quarter last year. Despite falling year on year, this print easily cleared analysts' estimates. Over the next 12 months, Wall Street is optimistic. Analysts are projecting Sinclair's LTM EPS of negative $7.12 to flip to positive $2.96.
Return on Invested Capital (ROIC)
EPS and free cash flow tell us whether a company was profitable while growing revenue. But was it capital-efficient? Enter ROIC, a metric showing how much operating profit a company generates relative to how much money the business raised (debt and equity).
Sinclair's five-year average return on invested capital was 8.3%, somewhat low compared to the best consumer discretionary companies that pump out 25%+. Its returns suggest it historically did a subpar job investing in profitable business initiatives.
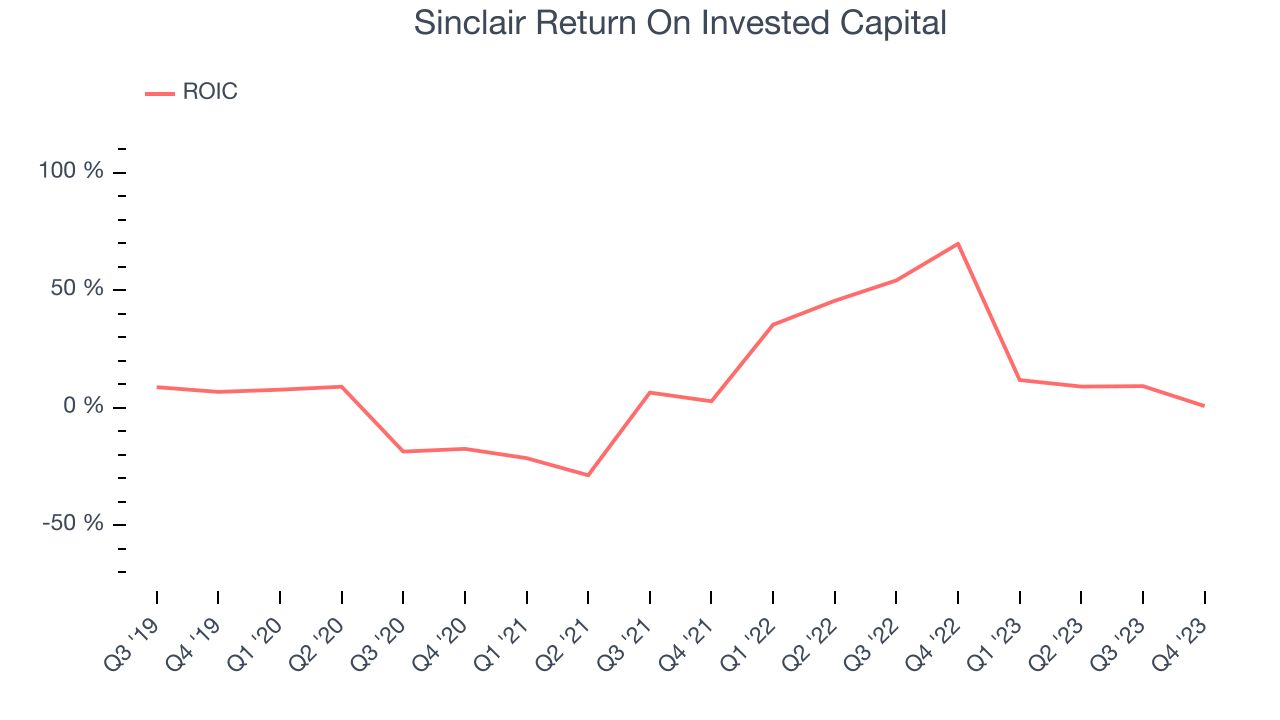
The trend in its ROIC, however, is often what surprises the market and drives the stock price. Over the last few years, Sinclair's ROIC has significantly increased. This is a good sign, and we hope the company can continue improving.
Balance Sheet Risk
As long-term investors, the risk we care most about is the permanent loss of capital. This can happen when a company goes bankrupt or raises money from a disadvantaged position and is separate from short-term stock price volatility, which we are much less bothered by.
Sinclair reported $0 of cash and $0 of debt on its balance sheet in the most recent quarter. As investors in high-quality companies, we primarily focus on two things: 1) that a company's debt level isn't too high and 2) that its interest payments are not excessively burdening the business.
With $565 million of EBITDA over the last 12 months, we view Sinclair's 0.0x net-debt-to-EBITDA ratio as safe. We also see its $307 million of annual interest expenses as appropriate. The company's profits give it plenty of breathing room, allowing it to continue investing in new initiatives.
Key Takeaways from Sinclair's Q1 Results
We were impressed by how significantly Sinclair blew past analysts' EPS expectations this quarter. We were also glad next quarter's revenue and adjusted EBITDA guidance came in higher than Wall Street's estimates. Zooming out, we think this was a solid quarter, showing that the company is staying on track. The stock is up 6.7% after reporting and currently trades at $14.15 per share.
Is Now The Time?
Sinclair may have had a favorable quarter, but investors should also consider its valuation and business qualities when assessing the investment opportunity.
We cheer for all companies serving consumers, but in the case of Sinclair, we'll be cheering from the sidelines. Its revenue growth has been weak over the last five years, but at least growth is expected to increase in the short term. And while its projected EPS for the next year implies the company's fundamentals will improve, the downside is its declining EPS over the last five years makes it hard to trust. On top of that, its relatively low ROIC suggests it has historically struggled to find compelling business opportunities.
Sinclair's price-to-earnings ratio based on the next 12 months is 4.9x. While there are some things to like about Sinclair and its valuation is reasonable, we think there are better opportunities elsewhere in the market right now.
Wall Street analysts covering the company had a one-year price target of $16.09 per share right before these results (compared to the current share price of $14.15).
To get the best start with StockStory, check out our most recent stock picks, and then sign up for our earnings alerts by adding companies to your watchlist here. We typically have the quarterly earnings results analyzed within seconds of the data being released, and especially for companies reporting pre-market, this often gives investors the chance to react to the results before the market has fully absorbed the information.