
Coffeehouse chain Starbucks (NASDAQ:SBUX) missed analysts' expectations in Q1 CY2024, with revenue down 1.8% year on year to $8.56 billion. It made a non-GAAP profit of $0.68 per share, down from its profit of $0.74 per share in the same quarter last year.
Starbucks (SBUX) Q1 CY2024 Highlights:
- Revenue: $8.56 billion vs analyst estimates of $9.16 billion (6.5% miss)
- EPS (non-GAAP): $0.68 vs analyst expectations of $0.80 (15.2% miss)
- Gross Margin (GAAP): 25.6%, down from 26.2% in the same quarter last year
- Free Cash Flow of $629.9 million, down 64.8% from the previous quarter
- Same-Store Sales were down 4% year on year
- Store Locations: 38,951 at quarter end, increasing by 2,317 over the last 12 months
- Market Capitalization: $100 billion
Started by three friends in Seattle’s historic Pike Place Market, Starbucks (NASDAQ:SBUX) is a globally-renowned coffeehouse chain that offers a wide selection of high-quality coffee, beverages, and food items.
Specifically, the company was founded when Jerry Baldwin, Zev Siegl, and Gordon Bowker opened a humble coffee shop in 1971. Their goal was to create a unique, intimate coffeehouse experience where customers could savor freshly brewed coffee while connecting with their communities.
Starbucks’ growth trajectory hit an inflection point in 1982 when it hired Howard Schultz as its director of retail operations and marketing. Schultz played a pivotal role in the company’s expansion and broadened its offerings to include iced beverages, teas, seasonal specialties, food items, and merchandise, catering to a diverse range of tastes and preferences.
Today, Starbucks differentiates itself in a crowded field by focusing on quality, consistency, and customer experience. Each Starbucks store is designed to create a warm and inviting atmosphere, with cozy seating areas and high-speed Wi-Fi, encouraging customers to stay in the store for however long they wish.
Starbucks was also quick to recognize the power of technology. The company’s mobile app allows customers to pre-order items (enabling them to get in and out of the store in less than 30 seconds), pay through their smartphones, customize beverages, and earn compelling rewards.
Traditional Fast Food
Traditional fast-food restaurants are renowned for their speed and convenience, boasting menus filled with familiar and budget-friendly items. Their reputations for on-the-go consumption make them favored destinations for individuals and families needing a quick meal. This class of restaurants, however, is fighting the perception that their meals are unhealthy and made with inferior ingredients, a battle that's especially relevant today given the consumers increasing focus on health and wellness.
Some competitors that sell caffeinated beverages and small bites include private company Dunkin’ as well as public companies Dutch Bros (NYSE:BROS), McDonald’s (NYSE:MCD), and Tim Hortons (owned by Restaurant Brands, NYSE:QSR).Sales Growth
Starbucks is one of the most widely recognized restaurant chains in the world and benefits from brand equity, giving it customer loyalty and more influence over purchasing decisions.
As you can see below, the company's annualized revenue growth rate of 7.4% over the last five years was decent as it opened new restaurants and grew sales at existing, established dining locations.
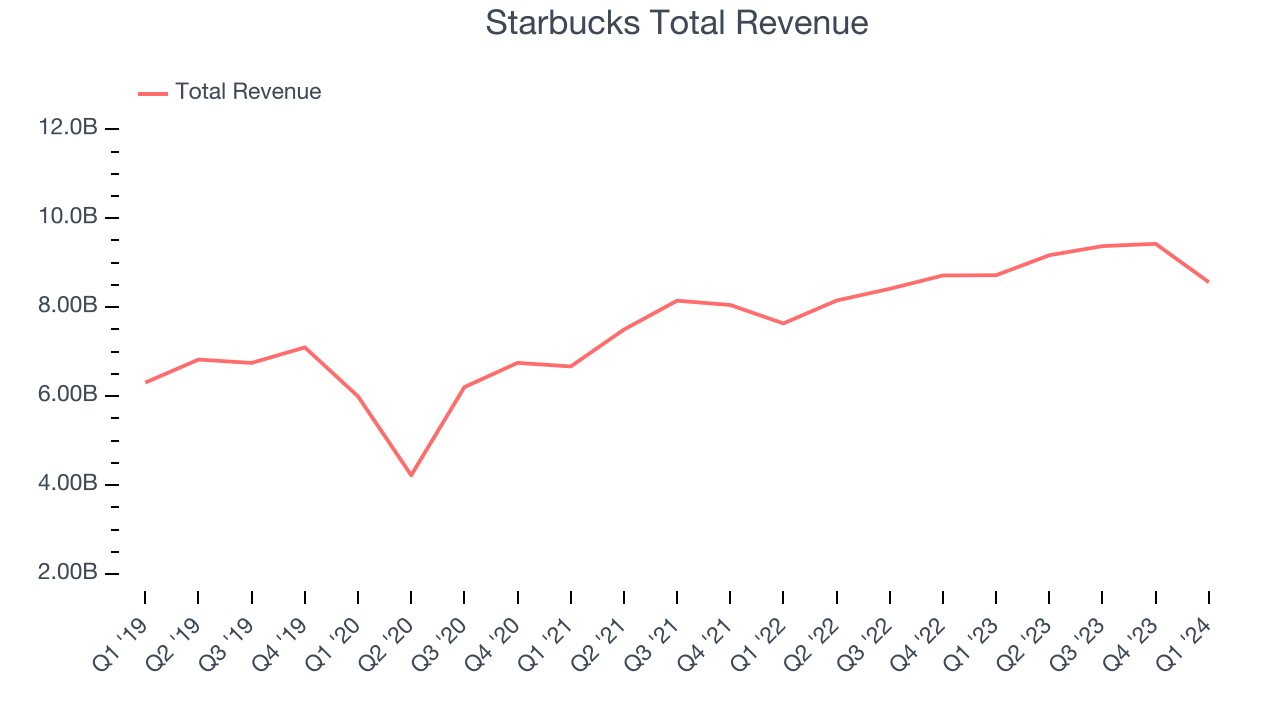
This quarter, Starbucks missed Wall Street's estimates and reported a rather uninspiring 1.8% year-on-year revenue decline, generating $8.56 billion in revenue. Looking ahead, Wall Street expects sales to grow 10.7% over the next 12 months, an acceleration from this quarter.
Same-Store Sales
A company's same-store sales growth shows the year-on-year change in sales for its restaurants that have been open for at least a year, give or take. This is a key performance indicator because it measures organic growth and demand.
Starbucks's demand within its existing restaurants has generally risen over the last two years but lagged behind the broader sector. On average, the company's same-store sales have grown by 5.6% year on year. With positive same-store sales growth amid an increasing number of restaurants, Starbucks is reaching more diners and growing sales.
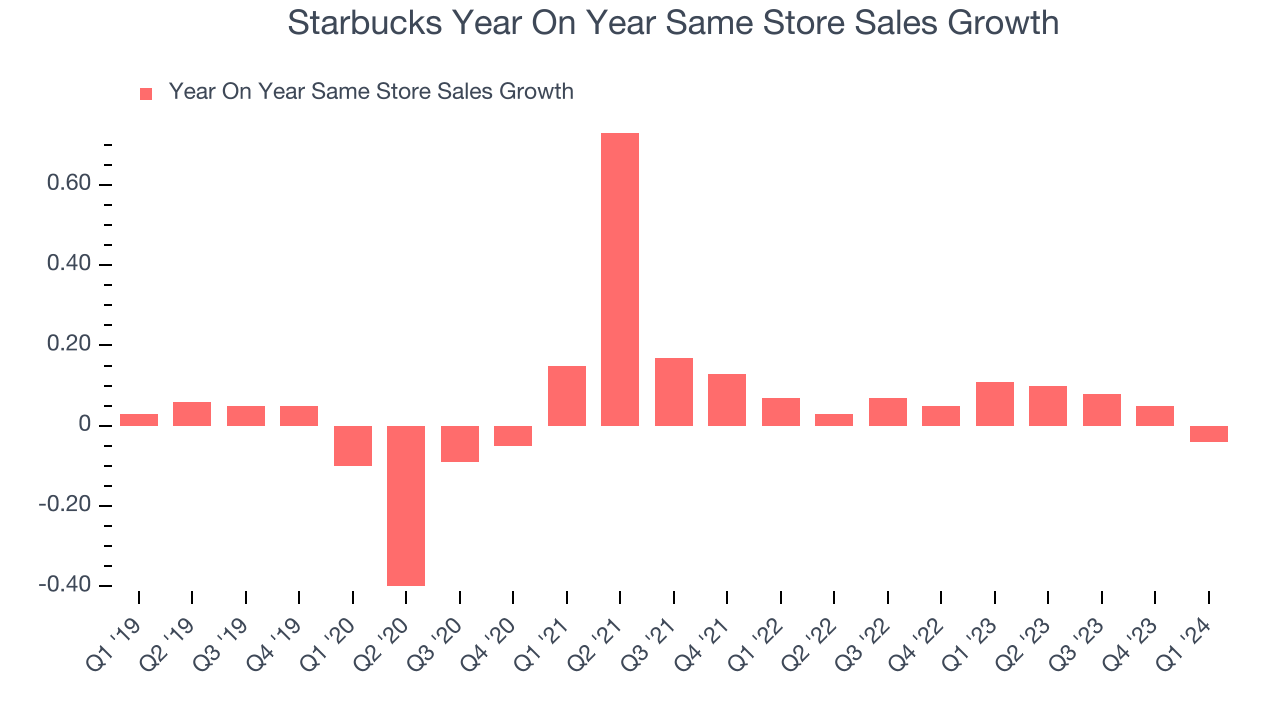
In the latest quarter, Starbucks's same-store sales fell 4% year on year. This decline was a reversal from the 11% year-on-year increase it posted 12 months ago. We'll be keeping a close eye on the company to see if this turns into a longer-term trend.
Number of Stores
The number of dining locations a restaurant chain operates is a major determinant of how much it can sell and how quickly company-level sales can grow.
When a chain like Starbucks is opening new restaurants, it usually means it's investing for growth because there's healthy demand for its meals and there are markets where the concept has few or no locations. Starbucks's restaurant count increased by 2,317, or 6.3%, over the last 12 months to 38,951 locations in the most recently reported quarter.

Taking a step back, Starbucks has rapidly opened new restaurants over the last eight quarters, averaging 6% annual increases in new locations. This growth is much higher than other restaurant businesses. Analyzing a restaurant's location growth is important because expansion means Starbucks has more opportunities to feed customers and generate sales.
Gross Margin & Pricing Power
Starbucks's gross profit margin came in at 25.6% this quarter. in line with the same quarter last year. This means the company makes $0.27 for every $1 in revenue before accounting for its operating expenses.
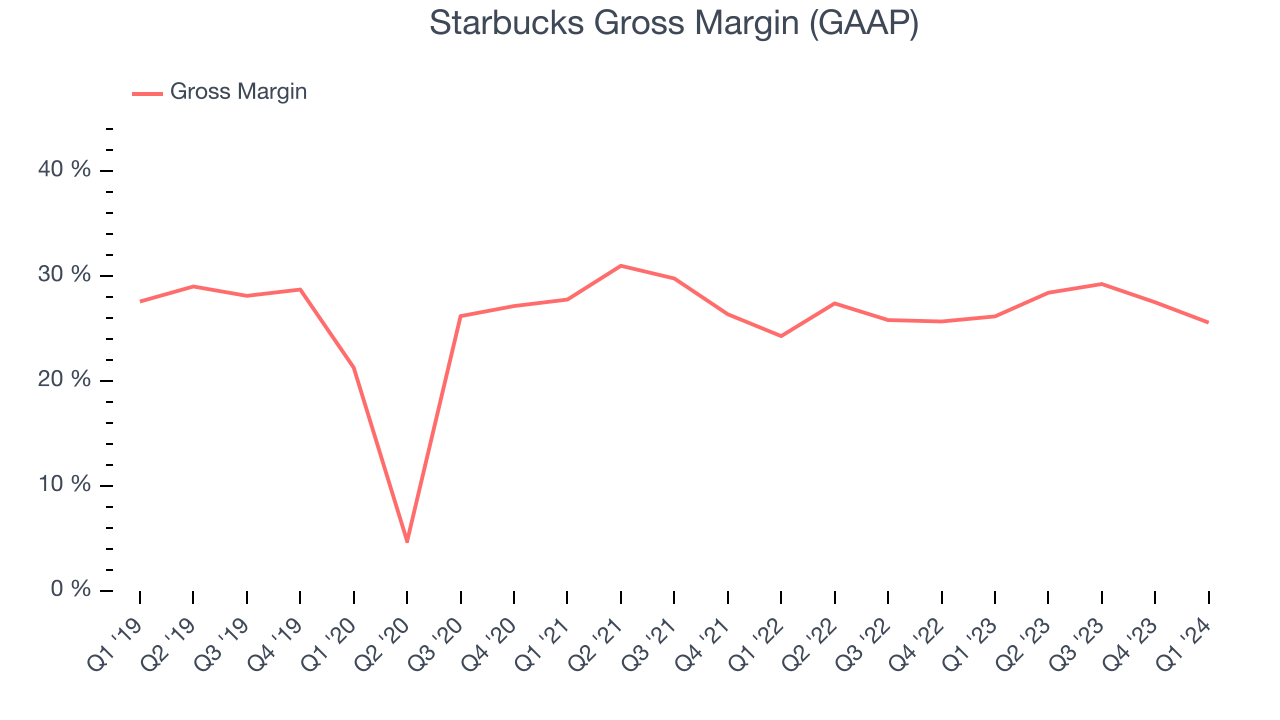
Starbucks's unit economics are higher than the typical restaurant company, giving it the flexibility to invest in areas such as marketing and talent to reach more consumers. As you can see above, it's averaged a decent 27% gross margin over the last eight quarters. Its margin has also been trending up over the last 12 months, averaging 5.5% year-on-year increases each quarter. If this trend continues, it could suggest a less competitive environment where the company has better pricing power and more stable input costs (such as ingredients and transportation expenses).
Operating Margin
Operating margin is an important measure of profitability for restaurants as it accounts for all expenses keeping the lights on, including wages, rent, advertising, and other administrative costs.
In Q1, Starbucks generated an operating profit margin of 12.8%, down 2.4 percentage points year on year. Because Starbucks's operating margin decreased more than its gross margin, we can infer the company was less efficient with its expenses or had lower leverage on its fixed costs.
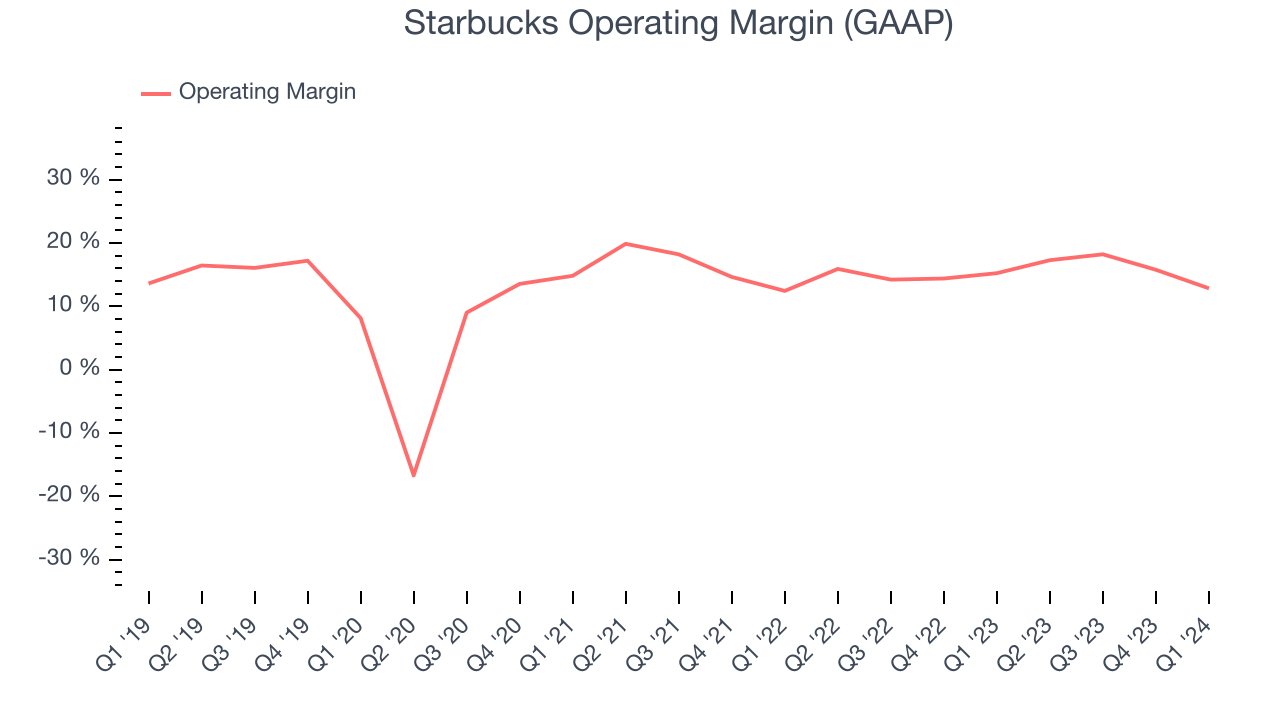 Zooming out, Starbucks has managed its expenses well over the last two years. It's demonstrated solid profitability for a restaurant business, producing an average operating margin of 15.5%. On top of that, its margin has improved, on average, by 1.2 percentage points each year, showing the company is strengthening its fundamentals.
 EPS
These days, some companies issue new shares like there's no tomorrow. That's why we like to track earnings per share (EPS) because it accounts for shareholder dilution and share buybacks.
In Q1, Starbucks reported EPS at $0.68, down from $0.74 in the same quarter a year ago. This print unfortunately missed Wall Street's estimates, but we care more about long-term EPS growth rather than short-term movements.
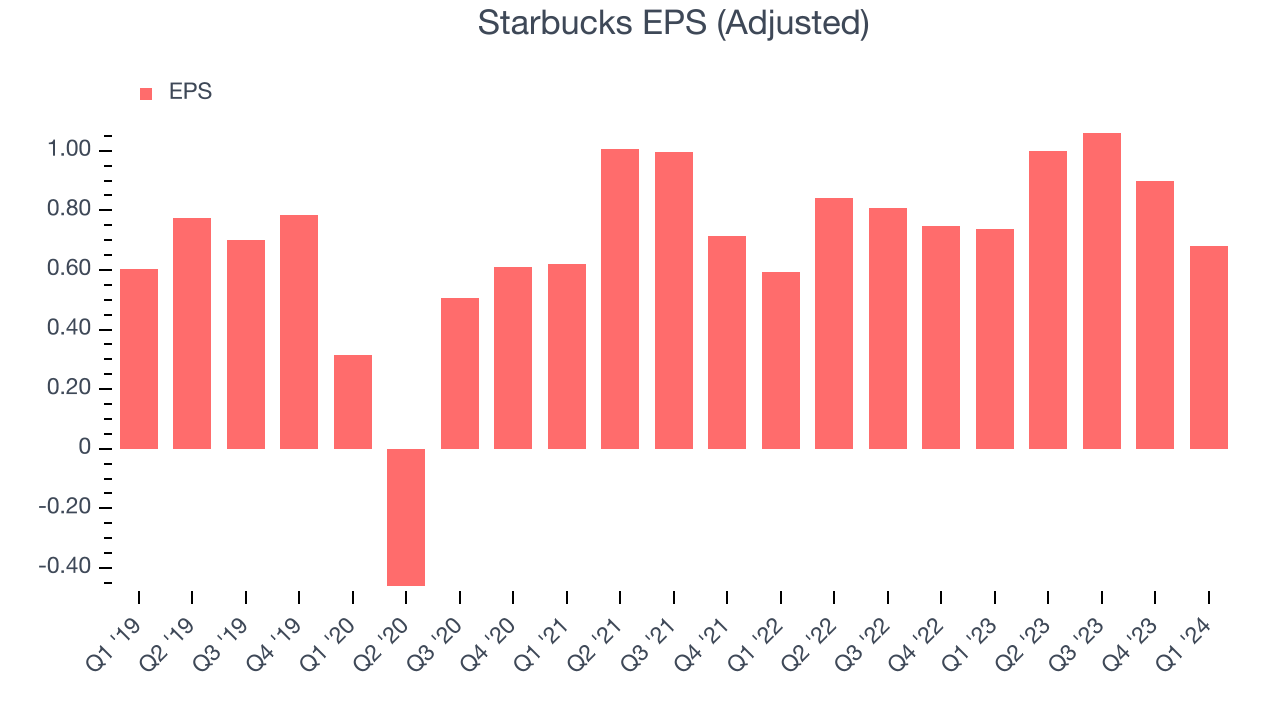
On the bright side, Wall Street expects the company to continue growing earnings over the next 12 months, with analysts projecting an average 18.4% year-on-year increase in EPS.
Cash Is King
Although earnings are undoubtedly valuable for assessing company performance, we believe cash is king because you can't use accounting profits to pay the bills.
Starbucks's free cash flow came in at $629.9 million in Q1, up 123% year on year. This result represents a 7.4% margin.
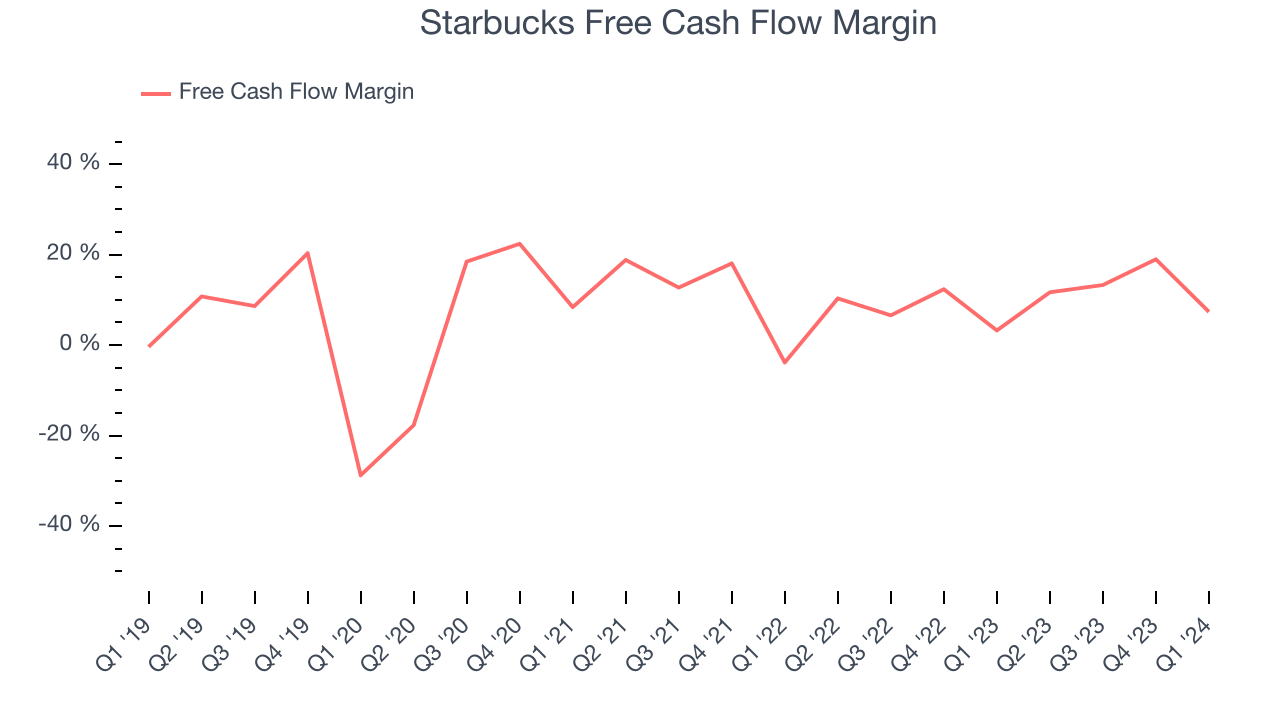
Over the last two years, Starbucks has shown strong cash profitability, giving it an edge over its competitors and the option to reinvest or return capital to investors while keeping cash on hand for emergencies. The company's free cash flow margin has averaged 10.6%, quite impressive for a restaurant business. Furthermore, its margin has averaged year-on-year increases of 4.9 percentage points. This likely pleases the company's investors.
Return on Invested Capital (ROIC)
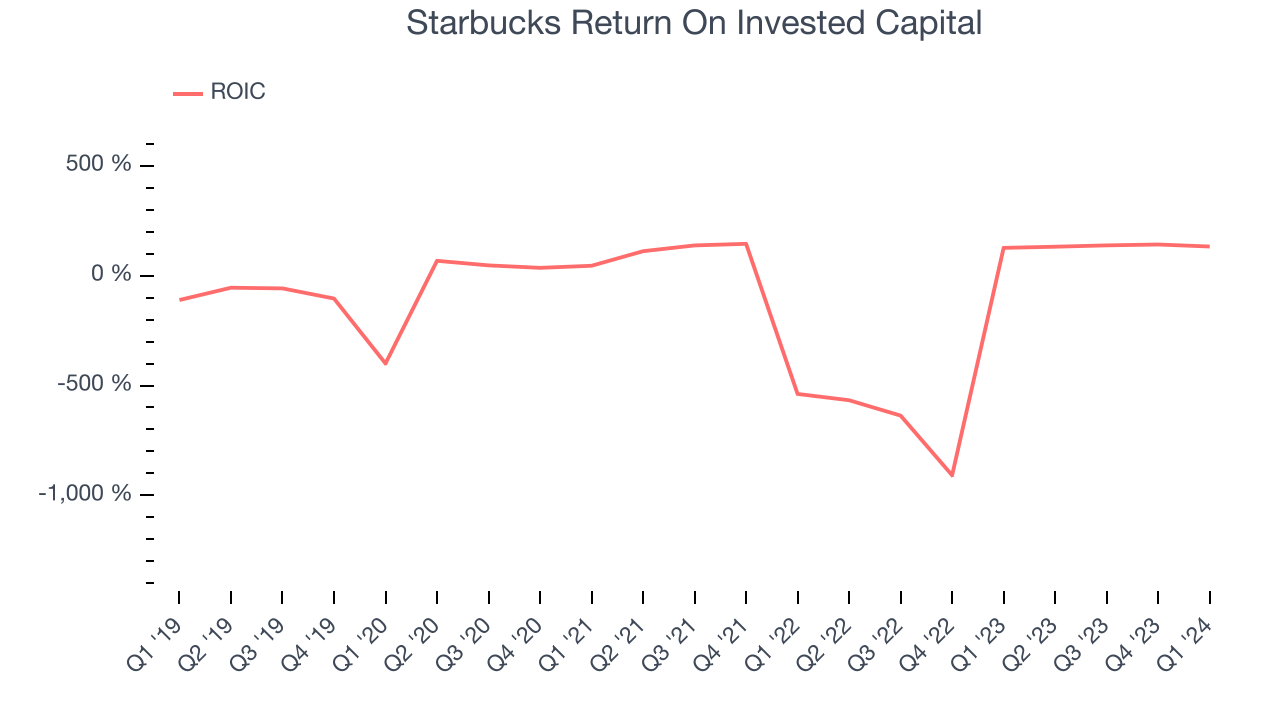
EPS and free cash flow tell us whether a company was profitable while growing revenue. But was it capital-efficient? Enter ROIC, a metric showing how much operating profit a company generates relative to how much money the business raised (debt and equity).
Starbucks's five-year average ROIC was 44.7%, placing it among the best restaurant companies. Just as you’d like your investment dollars to generate returns, Starbucks's invested capital has produced excellent profits.
Balance Sheet Risk
As long-term investors, the risk we care most about is the permanent loss of capital. This can happen when a company goes bankrupt or raises money from a disadvantaged position and is separate from short-term stock price volatility, which we are much less bothered by.
Starbucks reported $3.13 billion of cash and $15.59 billion of debt on its balance sheet in the most recent quarter. As investors in high-quality companies, we primarily focus on two things: 1) that a company's debt level isn't too high and 2) that its interest payments are not excessively burdening the business.
With $7.31 billion of EBITDA over the last 12 months, we view Starbucks's 1.7x net-debt-to-EBITDA ratio as safe. We also see its $240.6 million of annual interest expenses as appropriate. The company's profits give it plenty of breathing room, allowing it to continue investing in new initiatives.
Key Takeaways from Starbucks's Q1 Results
We struggled to find many strong positives in these results. Its revenue and EPS unfortunately missed analysts' expectations as its same-store sales declined by 4% (driven by a 6% decline in volumes offset by a 2% increase in prices). Starbucks's demand in China was especially weak as its same-store sales fell 11%. Management highlighted its disappointment with the results and called out a challenging operating environment. Overall, this was a bad quarter for Starbucks. The company is down 8.7% on the results and currently trades at $80.77 per share.
Is Now The Time?
Starbucks may have had a tough quarter, but investors should also consider its valuation and business qualities when assessing the investment opportunity.
We think Starbucks is a good business. First off, its revenue growth has been decent over the last five years, and growth is expected to increase in the short term. And while its EPS growth over the last five years has been mediocre, its new restaurant openings have increased its brand equity. On top of that, its stellar ROIC suggests it has been a well-run company historically.
Starbucks's price-to-earnings ratio based on the next 12 months is 20.6x. There are definitely a lot of things to like about Starbucks, and looking at the consumer landscape right now, it seems the company trades at a pretty interesting price.
Wall Street analysts covering the company had a one-year price target of $102.81 per share right before these results (compared to the current share price of $80.77), implying they saw upside in buying Starbucks in the short term.
To get the best start with StockStory, check out our most recent stock picks, and then sign up to our earnings alerts by adding companies to your watchlist here. We typically have the quarterly earnings results analyzed within seconds of the data being released, and especially for companies reporting pre-market, this often gives investors the chance to react to the results before the market has fully absorbed the information.