Footwear retailer Shoe Carnival (NASDAQ:SCVL) reported results in line with analysts' expectations in Q4 CY2023, with revenue down 3.6% year on year to $280.2 million. The company's outlook for the full year was also close to analysts' estimates with revenue guided to $1.23 billion at the midpoint. It made a non-GAAP profit of $0.59 per share, down from its profit of $0.79 per share in the same quarter last year.
Shoe Carnival (SCVL) Q4 CY2023 Highlights:
- Revenue: $280.2 million vs analyst estimates of $280.3 million (small miss)
- EPS (non-GAAP): $0.59 vs analyst expectations of $0.59 (small miss)
- Management's EPS guidance for the upcoming financial year 2024 is $2.65 billion at the midpoint, below analyst expectations of $2.84 (6.7% miss)
- Gross Margin (GAAP): 35.6%, down from 38.3% in the same quarter last year
- Free Cash Flow of $40.73 million, up 128% from the same quarter last year
- Same-Store Sales were down 9.4% year on year (in line)
- Store Locations: 429 at quarter end, increasing by 32 over the last 12 months
- Market Capitalization: $894 million
Known for its playful atmosphere that features carnival elements, Shoe Carnival (NASDAQ:SCVL) is a retailer that sells footwear from mainstream brands for the entire family.
A shopper can find shoes from Nike, Adidas, Skechers, Converse, Vans, and Crocs for sale at a typical store. Because Shoe Carnival focuses on keeping prices low and attracting a value customer, the selection from these brands will likely not be the newest, hottest releases but the staples. The company’s purchasing approach is also a major reason prices are competitive–Shoe Carnival acquires some inventory through excess inventory and closeouts. The company also maintains direct relationships with many suppliers, cutting out the expenses of middlemen.
On average, Shoe Carnival stores are mid-sized in the world of retail at approximately 10,000 square feet. Stores are typically located in both urban and suburban areas shopping centers and malls alongside other apparel and footwear retailers. The floors are easy to navigate, with sections for men, women, and children and those sections with further subsections for athletic, casual, and dress shoes. Shoe Carnival does have an e-commerce presence, established in 2008, but it is a concept and category that tends to draw shoppers in person.
Footwear Retailer
Footwear sales–like their apparel counterparts–are driven by seasons, trends, and innovation more so than absolute need and similarly face the bigger-picture secular trend of e-commerce penetration. Footwear plays a part in societal belonging, personal expression, and occasion, and retailers selling shoes recognize this. Therefore, they aim to balance selection, competitive prices, and the latest trends to attract consumers. Unlike their apparel counterparts, footwear retailers most sell popular third-party brands (as opposed to their own exclusive brands), which could mean less exclusivity of product but more nimbleness to pivot to what’s hot.
Footwear retailer competitors include Designer Brands’s (NYSE:DBI) DSW banner, Foot Locker (NYSE:FL), and TJX (NYSE:TJX).Sales Growth
Shoe Carnival is a small retailer, which sometimes brings disadvantages compared to larger competitors that benefit from economies of scale.
As you can see below, the company's annualized revenue growth rate of 3.2% over the last four years (we compare to 2019 to normalize for COVID-19 impacts) was weak , but to its credit, it opened new stores and expanded its reach.
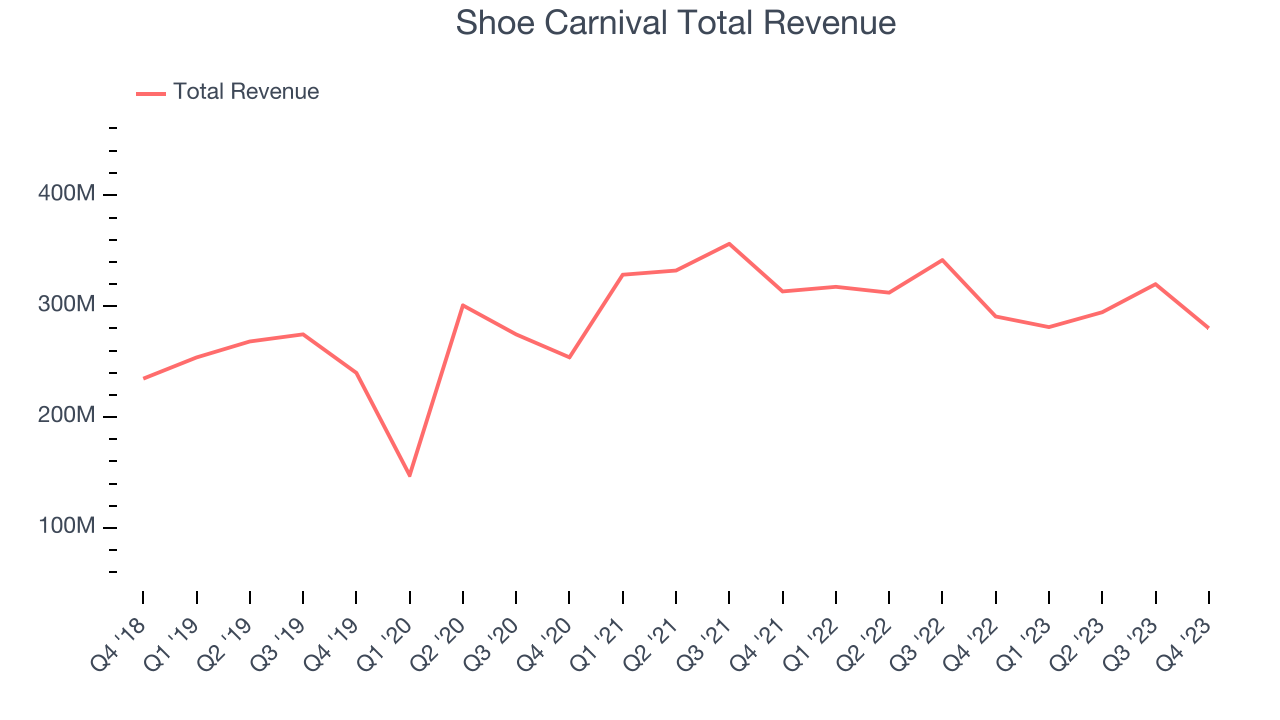
This quarter, Shoe Carnival missed Wall Street's estimates and reported a rather uninspiring 3.6% year-on-year revenue decline, generating $280.2 million in revenue. Looking ahead, Wall Street expects sales to grow 4.3% over the next 12 months, an acceleration from this quarter.
Number of Stores
When a retailer like Shoe Carnival is opening new stores, it usually means it's investing for growth because demand is greater than supply. Since last year, Shoe Carnival's store count increased by 32 locations, or 8.1%, to 429 total retail locations in the most recently reported quarter.
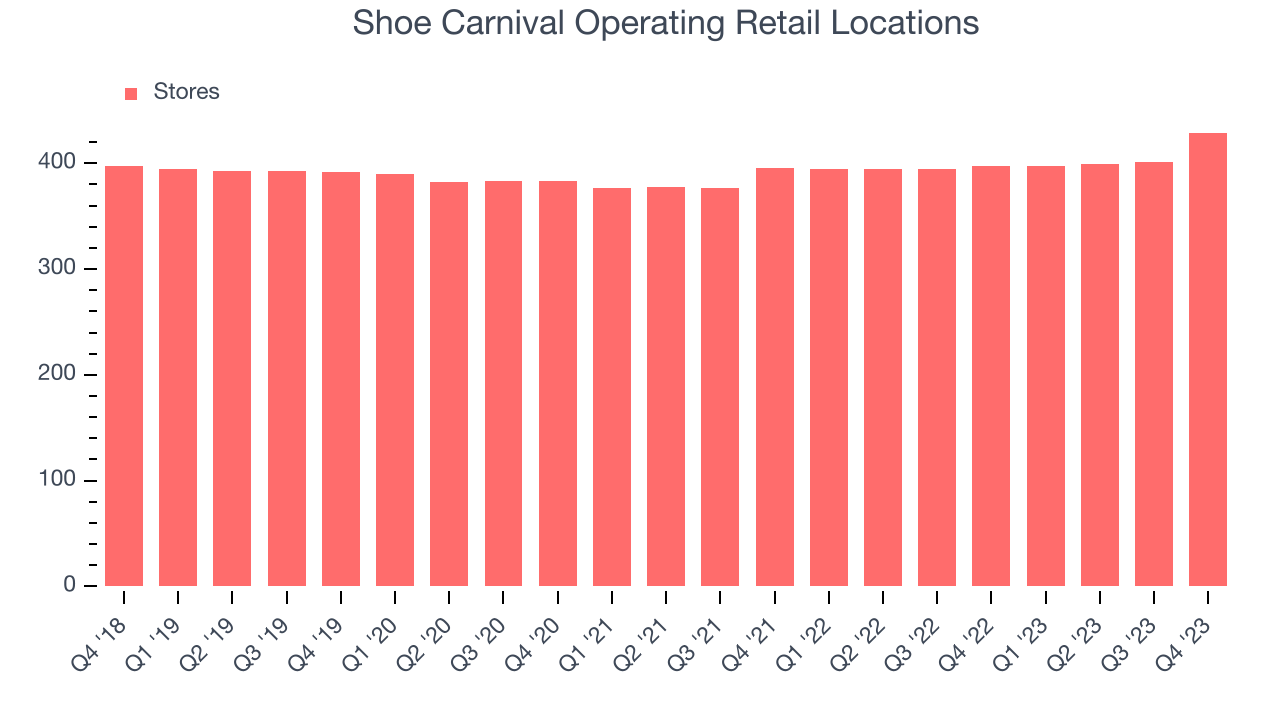
Taking a step back, the company has generally opened new stores over the last eight quarters, averaging 3.2% annual growth in its physical footprint. This is decent store growth and in line with other retailers. With an expanding store base and demand, revenue growth can come from multiple vectors: sales from new stores, sales from e-commerce, or increased foot traffic and higher sales per customer at existing stores.
Same-Store Sales
Same-store sales growth is an important metric that tracks demand for a retailer's established brick-and-mortar stores and e-commerce platform.
Shoe Carnival's demand has been shrinking over the last eight quarters, and on average, its same-store sales have declined by 9.9% year on year. This performance is quite concerning and the company should reconsider its strategy before investing its precious capital into new store buildouts.
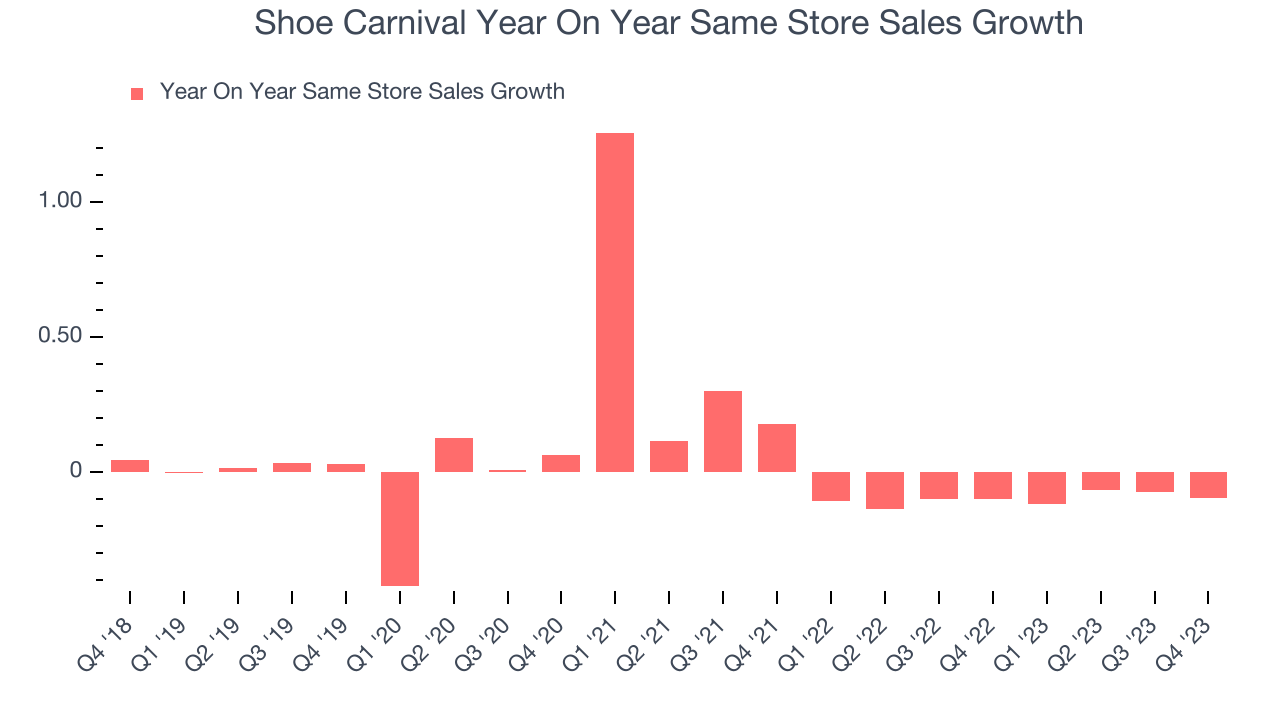
In the latest quarter, Shoe Carnival's same-store sales fell 9.4% year on year. This performance was more or less in line with the same quarter last year.
Gross Margin & Pricing Power
Gross profit margins tell us how much money a retailer gets to keep after paying for the goods it sells.
Shoe Carnival's unit economics are higher than the typical retailer, giving it the flexibility to invest in areas such as marketing and talent to reach more consumers. As you can see below, it's averaged a decent 36.5% gross margin over the last eight quarters. This means the company makes $0.36 for every $1 in revenue before accounting for its operating expenses.
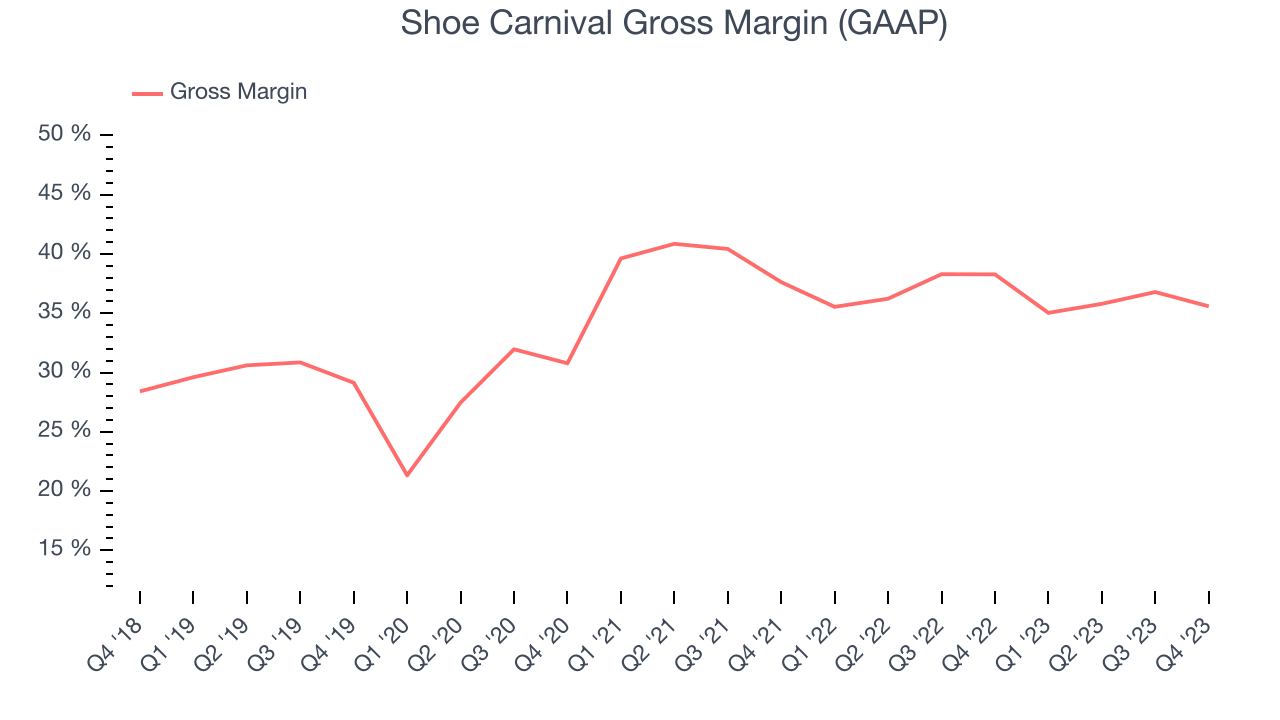
Shoe Carnival produced a 35.6% gross profit margin in Q4, marking a 2.7 percentage point decrease from 38.3% in the same quarter last year. One quarter of margin contraction shouldn't worry investors as a retailer's gross margin can often change due to factors such as product discounting and dynamic input costs (think distribution and freight expenses to move goods).
Operating Margin
Operating margin is a key profitability metric for retailers because it accounts for all expenses keeping the lights on, including wages, rent, advertising, and other administrative costs.
In Q4, Shoe Carnival generated an operating profit margin of 7.1%, down 2.7 percentage points year on year. We can infer Shoe Carnival was less efficient with its expenses or had lower leverage on its fixed costs because its operating margin decreased more than its gross margin.
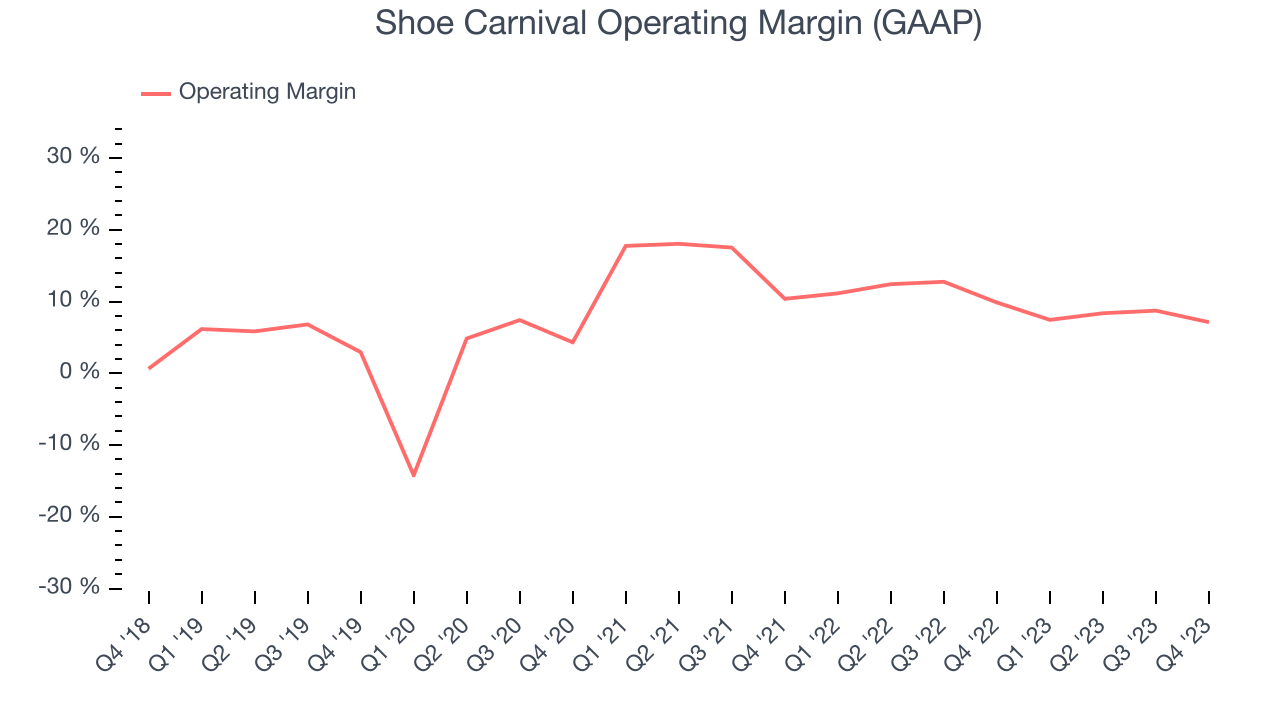 Zooming out, Shoe Carnival has done a decent job managing its expenses over the last eight quarters. It's produced an average operating margin of 9.8%, higher than the broader consumer retail sector. However, Shoe Carnival's margin has declined by 3.7 percentage points year on year (on average). Although this isn't the end of the world, some investors were likely hoping for better results.
 EPS
Earnings growth is a critical metric to track, but for long-term shareholders, earnings per share (EPS) is more telling because it accounts for dilution and share repurchases.
In Q4, Shoe Carnival reported EPS at $0.59, down from $0.79 in the same quarter a year ago. This print unfortunately missed Wall Street's estimates, but we care more about long-term EPS growth rather than short-term movements.
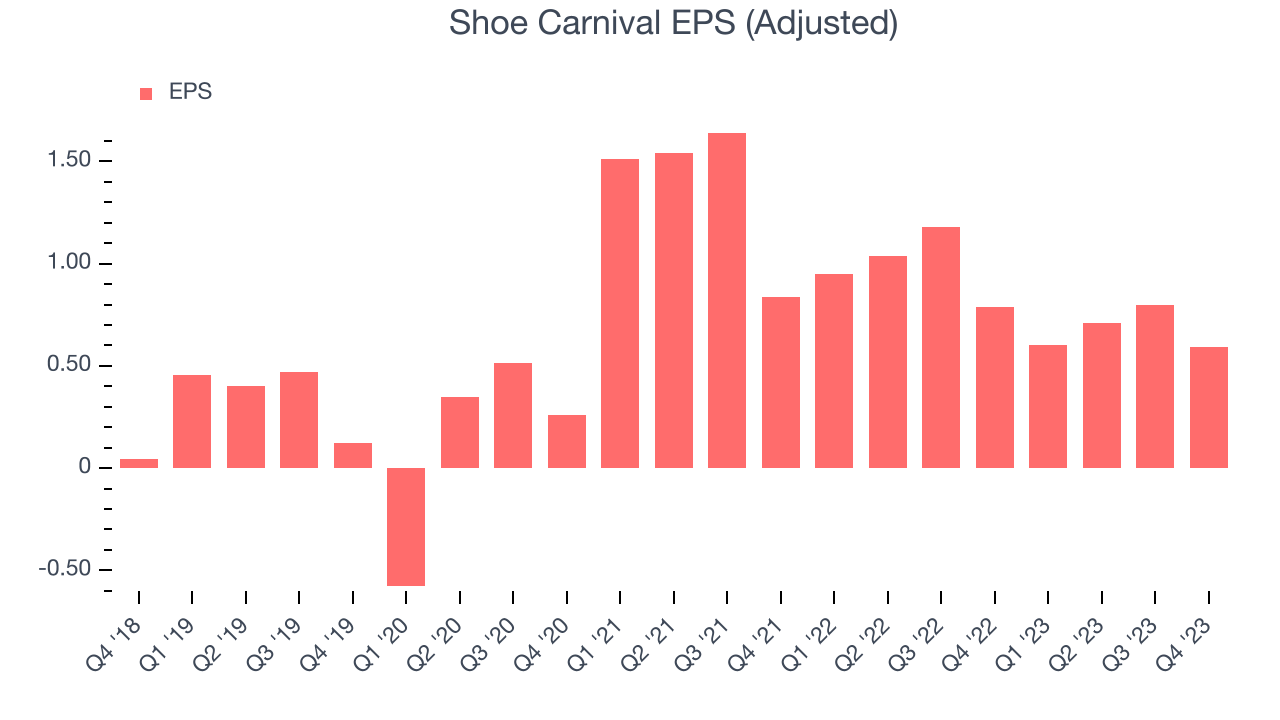
Between FY2019 and FY2023, Shoe Carnival's adjusted diluted EPS grew 85.9%, translating into a decent 16.8% compounded annual growth rate. This growth is materially higher than its revenue growth over the same period and was driven by excellent expense management (leading to higher profitability) and share repurchases (leading to higher PER share earnings).
Wall Street expects the company to continue growing earnings over the next 12 months, with analysts projecting an average 13.4% year-on-year increase in EPS.
Cash Is King
If you've followed StockStory for a while, you know that we emphasize free cash flow. Why, you ask? We believe in the end, cash is king, and you can't use accounting profits to pay the bills.
Shoe Carnival's free cash flow came in at $40.73 million in Q4, up 128% year on year. This result represents a 14.5% margin.
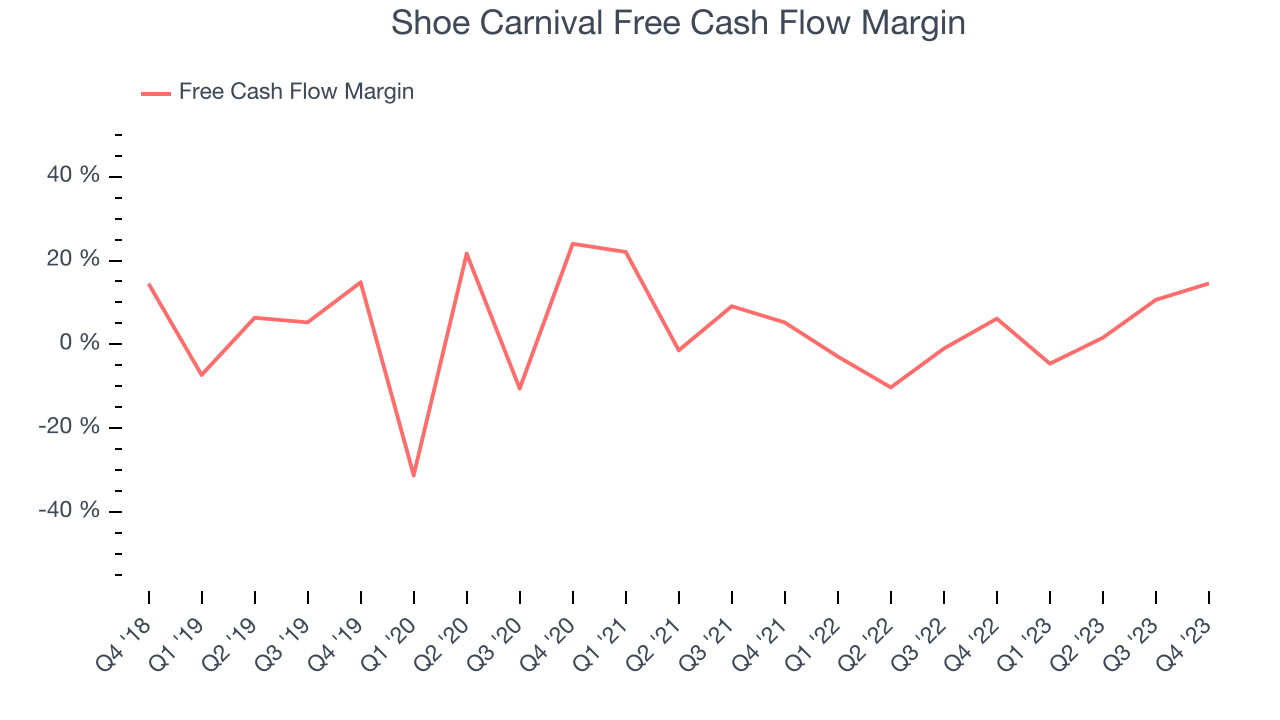
Over the last eight quarters, Shoe Carnival has shown mediocre cash profitability, putting it in a pinch as it gives the company limited opportunities to reinvest, pay down debt, or return capital to shareholders. Its free cash flow margin has averaged 1.6%, subpar for a consumer retail business. However, its margin has averaged year-on-year increases of 7.8 percentage points, a great result that should improve its prospects.
Return on Invested Capital (ROIC)
EPS and free cash flow tell us whether a company was profitable while growing revenue. But was it capital-efficient? A company’s ROIC explains this by showing how much operating profit a company makes compared to how much money the business raised (debt and equity).
Shoe Carnival's five-year average ROIC was 14.1%, somewhat low compared to the best retail companies that consistently pump out 25%+. Its returns suggest it historically did a subpar job investing in profitable business initiatives.
The trend in its ROIC, however, is often what surprises the market and drives the stock price. Over the last five years, Shoe Carnival's ROIC averaged 5.1 percentage point increases. This is a good sign and we hope the company can continue to improving.
Key Takeaways from Shoe Carnival's Q4 Results
We struggled to find many strong positives in these results. The key negative was that its full-year earnings forecast missed analysts' expectations by a meaningful amount. The stock is flat after reporting and currently trades at $32.95 per share.
Is Now The Time?
Shoe Carnival may have had a tough quarter, but investors should also consider its valuation and business qualities when assessing the investment opportunity.
We cheer for all companies serving consumers, but in the case of Shoe Carnival, we'll be cheering from the sidelines. Its revenue growth has been uninspiring over the last four years, but at least growth is expected to increase in the short term. And while its projected EPS for the next year implies the company's fundamentals will improve, the downside is its shrinking same-store sales suggests it'll need to change its strategy to succeed. On top of that, its brand caters to a niche market.
Shoe Carnival's price-to-earnings ratio based on the next 12 months is 10.8x. While the price is reasonable and there are some things to like about Shoe Carnival, we think there are better opportunities elsewhere in the market right now.
Wall Street analysts covering the company had a one-year price target of $31.67 per share right before these results (compared to the current share price of $32.95).
To get the best start with StockStory, check out our most recent stock picks, and then sign up to our earnings alerts by adding companies to your watchlist here. We typically have the quarterly earnings results analyzed within seconds of the data being released, and especially for companies reporting pre-market, this often gives investors the chance to react to the results before the market has fully absorbed the information.