
Semiconductor maker SMART Global Holdings (NASDAQ:SGH) reported results in line with analysts' expectations in Q1 CY2024, with revenue down 33.6% year on year to $284.8 million. On the other hand, next quarter's revenue guidance of $300 million was less impressive, coming in 3.4% below analysts' estimates. It made a non-GAAP profit of $0.27 per share, down from its profit of $0.76 per share in the same quarter last year.
SMART (SGH) Q1 CY2024 Highlights:
- Revenue: $284.8 million vs analyst estimates of $285.1 million (small miss)
- EPS (non-GAAP): $0.27 vs analyst estimates of $0.25 (7.1% beat)
- Revenue Guidance for Q2 CY2024 is $300 million at the midpoint, below analyst estimates of $310.4 million
- Gross Margin (GAAP): 28.8%, up from 27% in the same quarter last year
- Inventory Days Outstanding: 77, down from 99 in the previous quarter
- Free Cash Flow was -$27.12 million, down from $26.83 million in the previous quarter
- Market Capitalization: $1.34 billion
Based in the US, SMART Global Holdings (NASDAQ:SGH) is a diversified semiconductor company offering memory, digital, and LED products.
SMART was founded in 1988 by Mukesh Patel and went public went public for the first time in 1995. It was then acquired by both strategic (Solectron) and financial (Silver Lake) buyers, taken private and then public again in 2017.
SMART’s product portfolio is divided into three segments: Memory Solutions, LED Solutions, and the emerging Intelligent Platform Solutions (“IPS”). The Memory Solutions segment, upon which the company was built, designs and manufactures DRAM (dynamic random access memory) and flash memory for computers, servers, and smartphones. The LED Solutions segment consists of application-optimized LEDs (light-emitting diodes) focused on the density, intensity, and reliability of lights in video screens, gaming displays, etc. The IPS segment is a portfolio of hardware, software, and services to enable edge computing. For example, SMART IPS architected and manages a private hybrid cloud environment (nodes, storage, etc.) for a US Federal government customer to enable AI and analytics use cases.
While SMART does not operate wafer fabrication facilities, the company has facilities in Brazil, the US, China, and Malaysia for subsequent stages of semiconductor manufacturing. These facilities receive unmounted chips and package die into semiconductor and LED components. Testing and assembly also occurs in these facilities.
While no company offers the same diversified product portfolio, some competitors include Intel (NASDAQ:INTC), Dell (NYSE:DELL), NVIDIA (NASDAQ:NVDA), and SK hynix (KOSE:A000660).Sales Growth
SMART's revenue growth over the last three years has been unimpressive, averaging 7.6% annually. This quarter, its revenue declined from $429.2 million in the same quarter last year to $284.8 million. Semiconductors are a cyclical industry, and long-term investors should be prepared for periods of high growth followed by periods of revenue contractions (which can sometimes offer opportune times to buy).
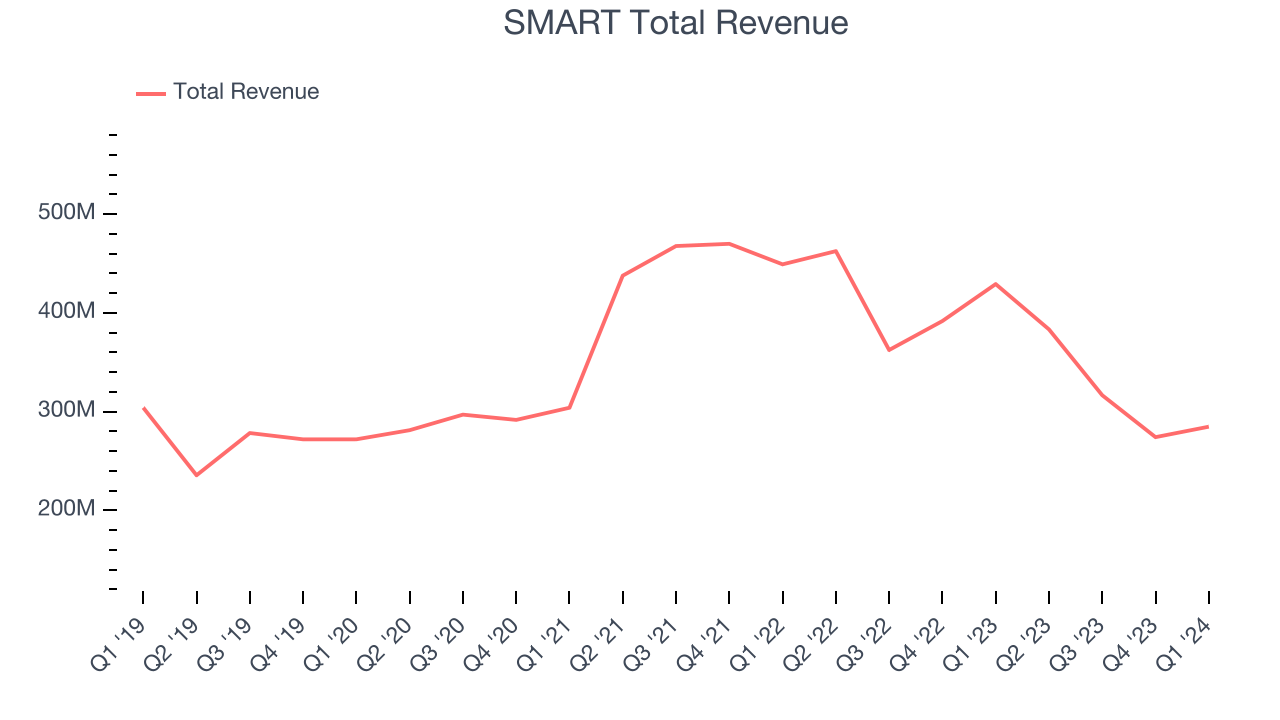
SMART had a difficult quarter as revenue dropped 33.6% year on year, missing analysts' estimates by 0.1%. This could mean that the current downcycle is deepening.
SMART may be headed for an upturn. Although the company is guiding for a year-on-year revenue decline of 21.7% next quarter, analysts are expecting revenue to grow 12.6% over the next 12 months.
Product Demand & Outstanding Inventory
Days Inventory Outstanding (DIO) is an important metric for chipmakers, as it reflects a business' capital intensity and the cyclical nature of semiconductor supply and demand. In a tight supply environment, inventories tend to be stable, allowing chipmakers to exert pricing power. Steadily increasing DIO can be a warning sign that demand is weak, and if inventories continue to rise, the company may have to downsize production.
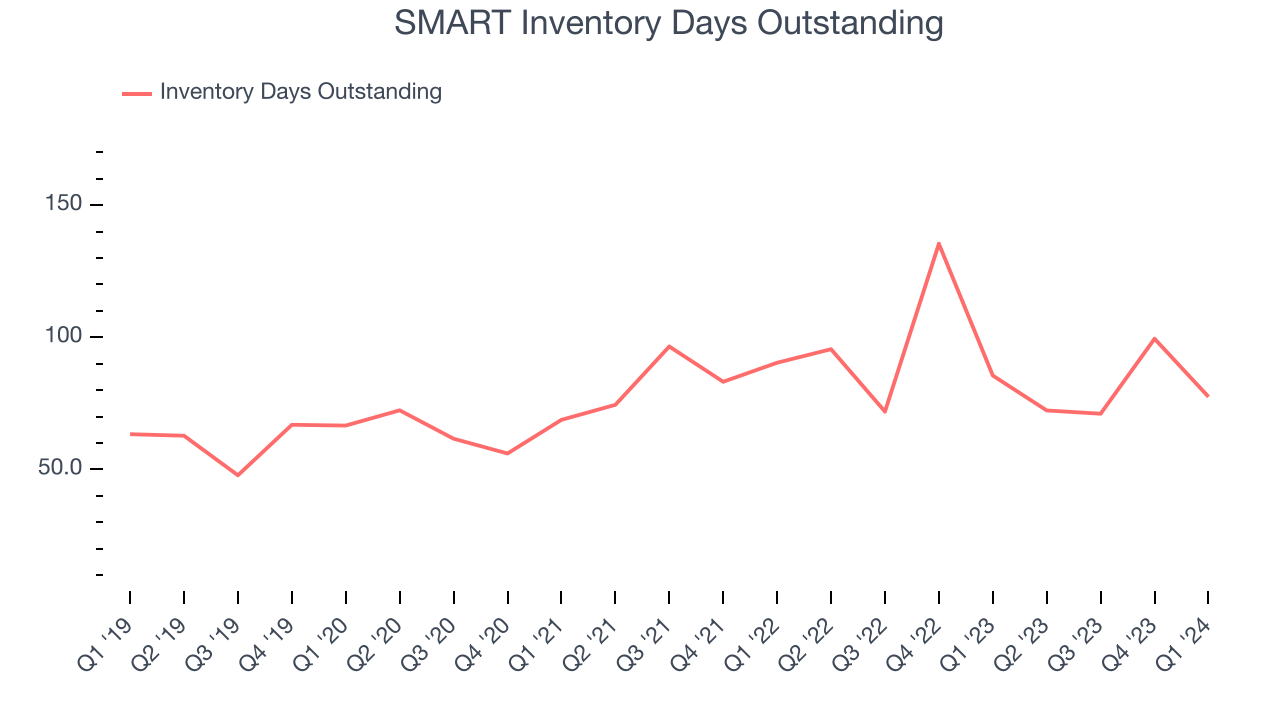
This quarter, SMART's DIO came in at 77, which is one day below its five-year average. At the moment, these numbers show no indication of an unusual inventory buildup.
Pricing Power
In the semiconductor industry, a company's gross profit margin is a critical metric to track because it sheds light on its pricing power, complexity of products, and ability to procure raw materials, equipment, and labor. SMART's gross profit margin, which shows how much money the company gets to keep after paying key materials, input, and manufacturing costs, came in at 28.8% in Q1, up 1.8 percentage points year on year.
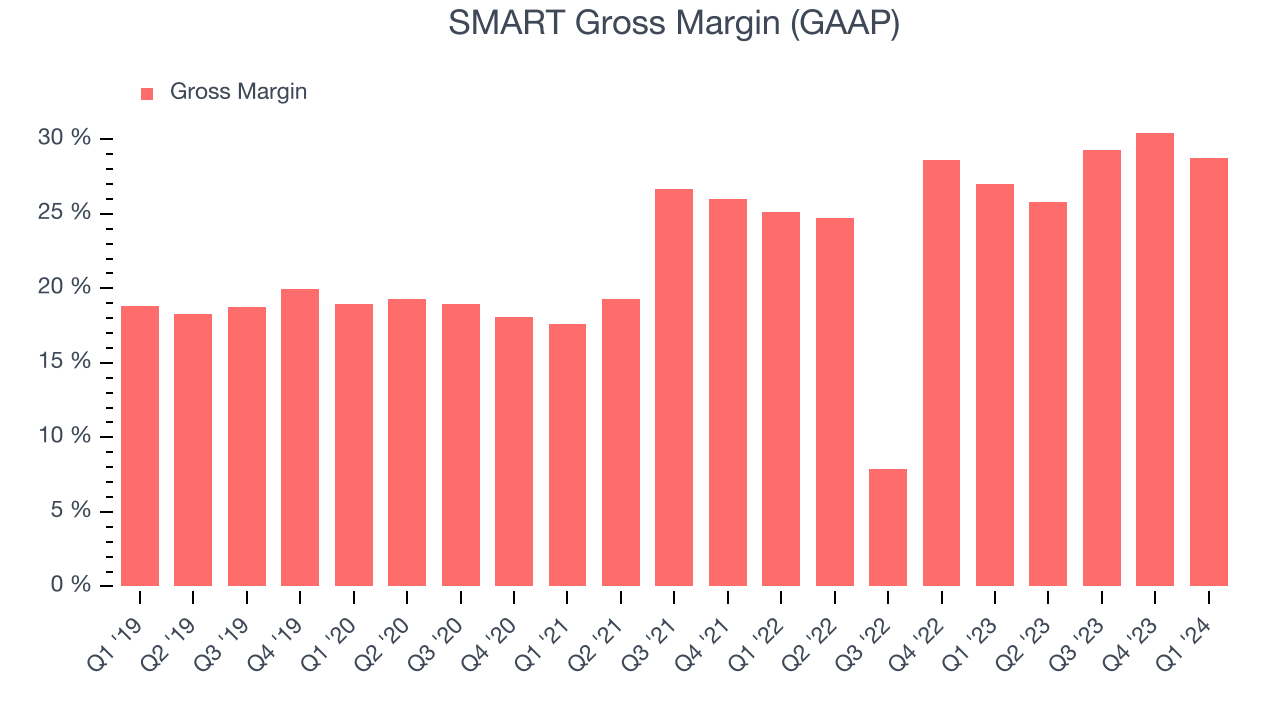
SMART's gross margins have been trending up over the last 12 months, averaging 28.3%. This is a welcome development, as SMART's margins are below the industry average, and rising margins could suggest improved demand and pricing power.
Profitability
SMART reported an operating margin of 9.3% in Q1, down 2.7 percentage points year on year. Operating margins are one of the best measures of profitability because they tell us how much money a company takes home after manufacturing its products, marketing and selling them, and, importantly, keeping them relevant through research and development.
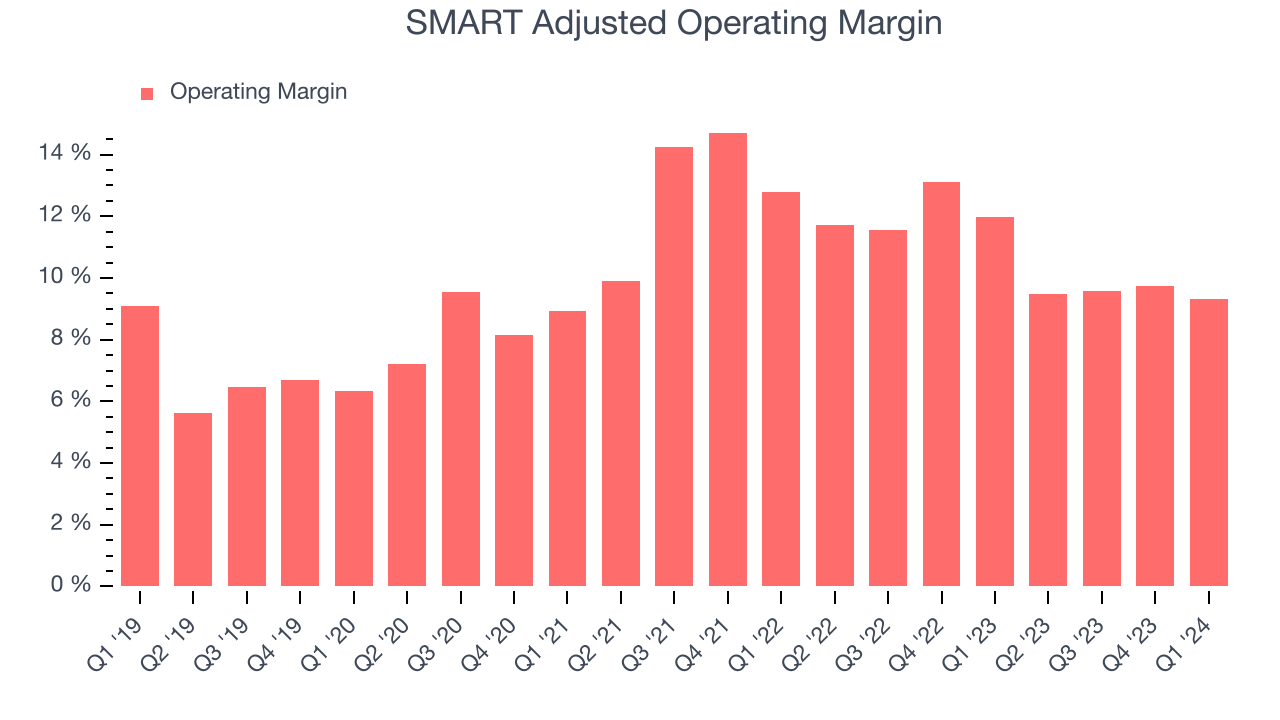
SMART's operating margins have been trending down over the last year, averaging 9.5%. This is a bad sign for SMART, whose margins are already below average for semiconductor companies. To its credit, however, the company's margins suggest modest pricing power and cost controls.
Earnings, Cash & Competitive Moat
Analysts covering SMART expect earnings per share to grow 30.6% over the next 12 months, although estimates will likely change after earnings.
Although earnings are important, we believe cash is king because you can't use accounting profits to pay the bills. SMART's free cash flow came in at negative $27.12 million in Q1, down 131% year on year.
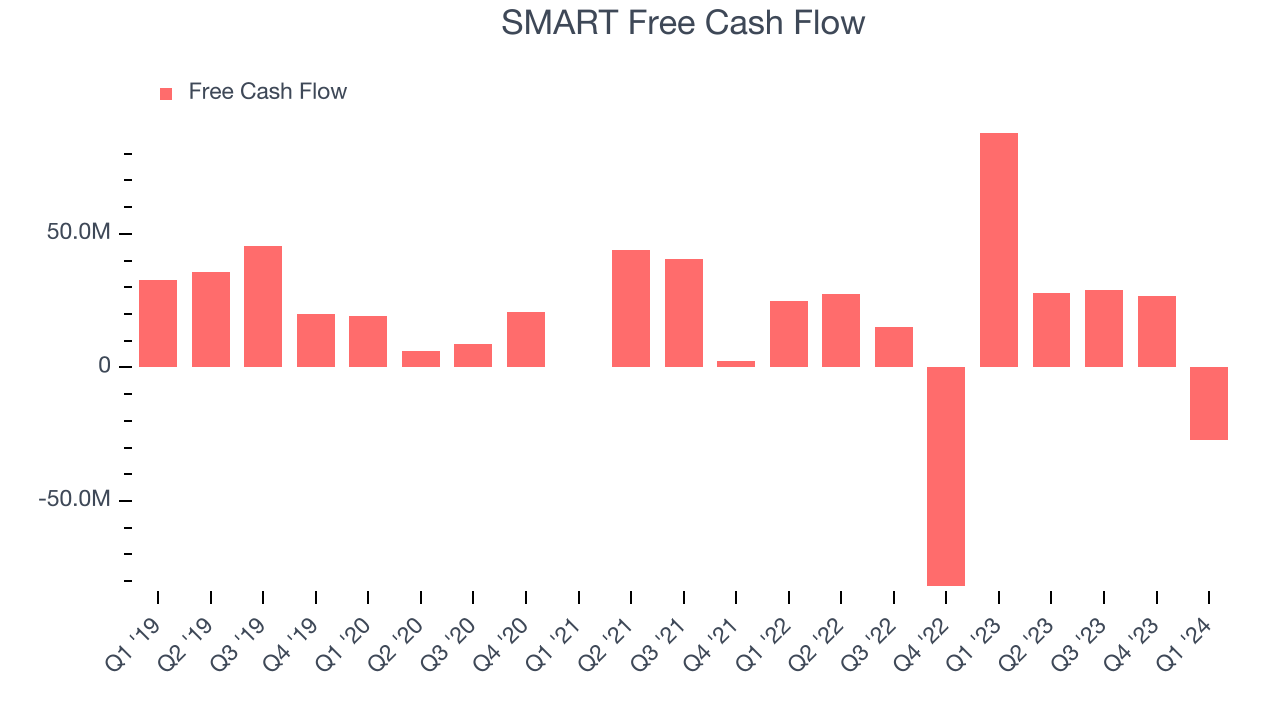
SMART has generated $56.54 million in free cash flow over the last 12 months, or 4.5% of revenue. This FCF margin enables it to reinvest in its business without depending on the capital markets.
Return on Invested Capital (ROIC)
EPS and free cash flow tell us whether a company was profitable while growing revenue. But was it capital-efficient? Enter ROIC, a metric showing how much operating profit a company generates relative to how much money the business raised (debt and equity).
SMART's five-year average ROIC was 10.3%, somewhat low compared to the best semiconductor companies that consistently pump out 35%+. Its returns suggest it historically did a subpar job investing in profitable business initiatives.
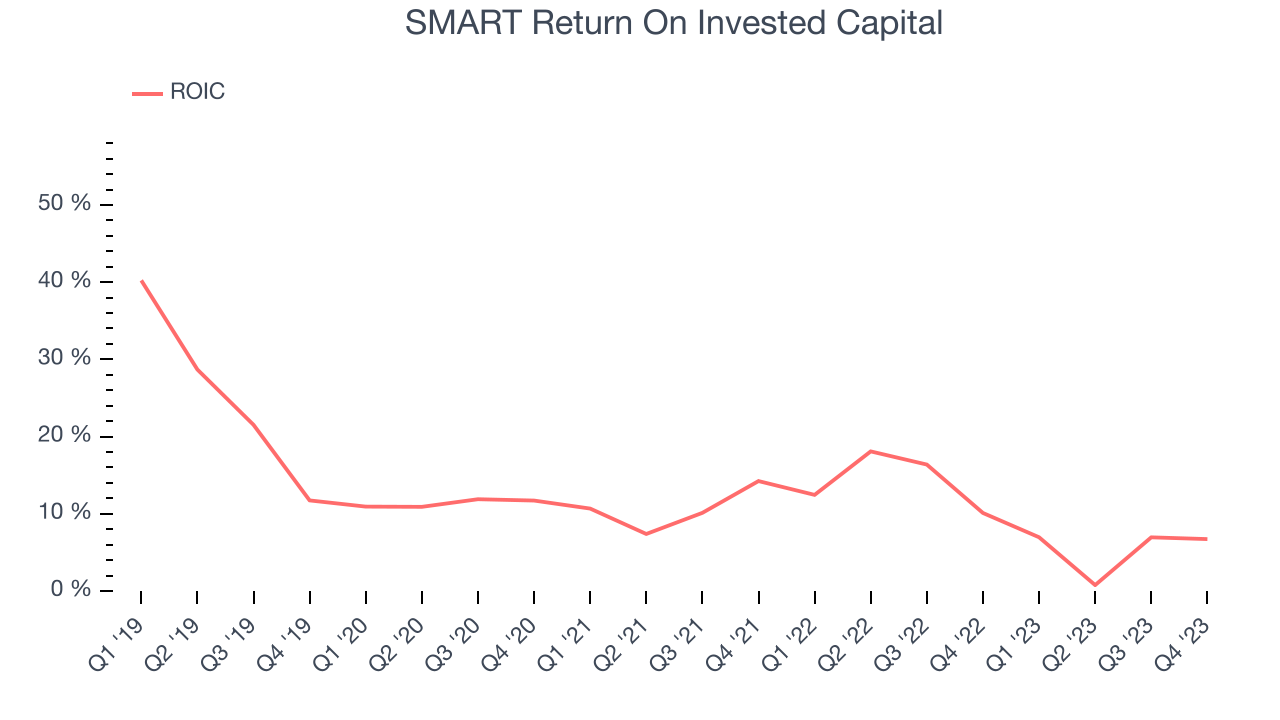
The trend in its ROIC, however, is often what surprises the market and drives the stock price. Unfortunately, SMART's ROIC averaged 1.1 percentage point decreases over the last few years. Paired with its already low returns, these declines suggest the company's profitable business opportunities are few and far between.
Key Takeaways from SMART's Q1 Results
We were impressed by SMART's strong improvement in inventory levels. We were also excited its EPS outperformed Wall Street's estimates. On the other hand, its revenue guidance for next quarter missed analysts' expectations and its operating margin shrunk.
During the earnings release, SMART also appointed Pete Manca as President of its Intelligent Platform Solutions segment. Before joining, Manca was a Senior Vice President and General Manager at Dell Technologies.
Overall, this was a mixed quarter for SMART, and the market is likely spooked by its weak outlook. The company is down 10.5% on the results and currently trades at $23.19 per share.
Is Now The Time?
When considering an investment in SMART, investors should take into account its valuation and business qualities as well as what's happened in the latest quarter.
We cheer for everyone who's making the lives of others easier through technology, but in the case of SMART, we'll be cheering from the sidelines. Its revenue growth has been uninspiring over the last three years, and analysts expect growth to deteriorate from here. On top of that, its gross margin indicate some combination of pricing pressures or rising production costs, and its operating margins reveal subpar cost controls compared to other semiconductor businesses.
SMART's price-to-earnings ratio based on the next 12 months is 16.1x. While we have no doubt one can find things to like about the company, and the price is not completely unreasonable, we think that at the moment there might be better opportunities in the market.
Wall Street analysts covering the company had a one-year price target of $26.50 per share right before these results (compared to the current share price of $23.19).
To get the best start with StockStory check out our most recent Stock picks, and then sign up to our earnings alerts by adding companies to your watchlist here. We typically have the quarterly earnings results analyzed within seconds of the data being released, and especially for the companies reporting pre-market, this often gives investors the chance to react to the results before the market has fully absorbed the information.