
Shoe and apparel company Steven Madden (NASDAQ:SHOO) reported results ahead of analysts' expectations in Q1 CY2024, with revenue up 19.1% year on year to $552.4 million. It made a non-GAAP profit of $0.65 per share, improving from its profit of $0.50 per share in the same quarter last year.
Steven Madden (SHOO) Q1 CY2024 Highlights:
- Revenue: $552.4 million vs analyst estimates of $525.2 million (5.2% beat)
- EPS (non-GAAP): $0.65 vs analyst estimates of $0.55 (17.3% beat)
- Gross Margin (GAAP): 40.7%, down from 42.1% in the same quarter last year
- Free Cash Flow was -$19.68 million, down from $145.9 million in the previous quarter
- Market Capitalization: $2.96 billion
As seen in the infamous Wolf of Wall Street movie, Steven Madden (NASDAQ:SHOO) is a fashion brand famous for its trendy and innovative footwear, appealing to a young and style-conscious audience.
Steven Madden was founded by designer and entrepreneur Steve Madden in 1990. From the outset, Madden aimed to provide young, fashion-forward women with an avenue to express their individuality through unique and daring styles.
The brand quickly became renowned for its innovative designs, blending edgy aesthetics with a keen understanding of what people wanted to wear at an affordable price. Since then, the company has expanded beyond its original focus on women's shoes to include a wide range of accessories, handbags, and apparel.
Steve Madden's core products include sandals, boots, sneakers, and heels. Its collection constantly evolves to keep pace with the ever-changing world of fashion, where styles can quickly go in and out of fashion.
Steve Madden's handbag, accessories, and apparel lines share similar business characteristics and have helped the brand build a comprehensive lifestyle image, appealing to a broader demographic.
Footwear
Before the advent of the internet, styles changed, but consumers mainly bought shoes by visiting local brick-and-mortar shoe, department, and specialty stores. Today, not only do styles change more frequently as fads travel through social media and the internet but consumers are also shifting the way they buy their goods, favoring omnichannel and e-commerce experiences. Some footwear companies have made concerted efforts to adapt while those who are slower to move may fall behind.
Steve Madden's primary competitors include Sam Edelman (owned by Caleres NYSE:CAL), Michael Kors (owned by Capri Holdings NYSE:CPRI), Zara (owned by Inditex BME:ITX), and private companies Aldo and Nine West.Sales Growth
Reviewing a company's long-term performance can reveal insights into its business quality. Any business can have short-term success, but a top-tier one sustains growth for years. Steven Madden's annualized revenue growth rate of 4% over the last five years was weak for a consumer discretionary business. 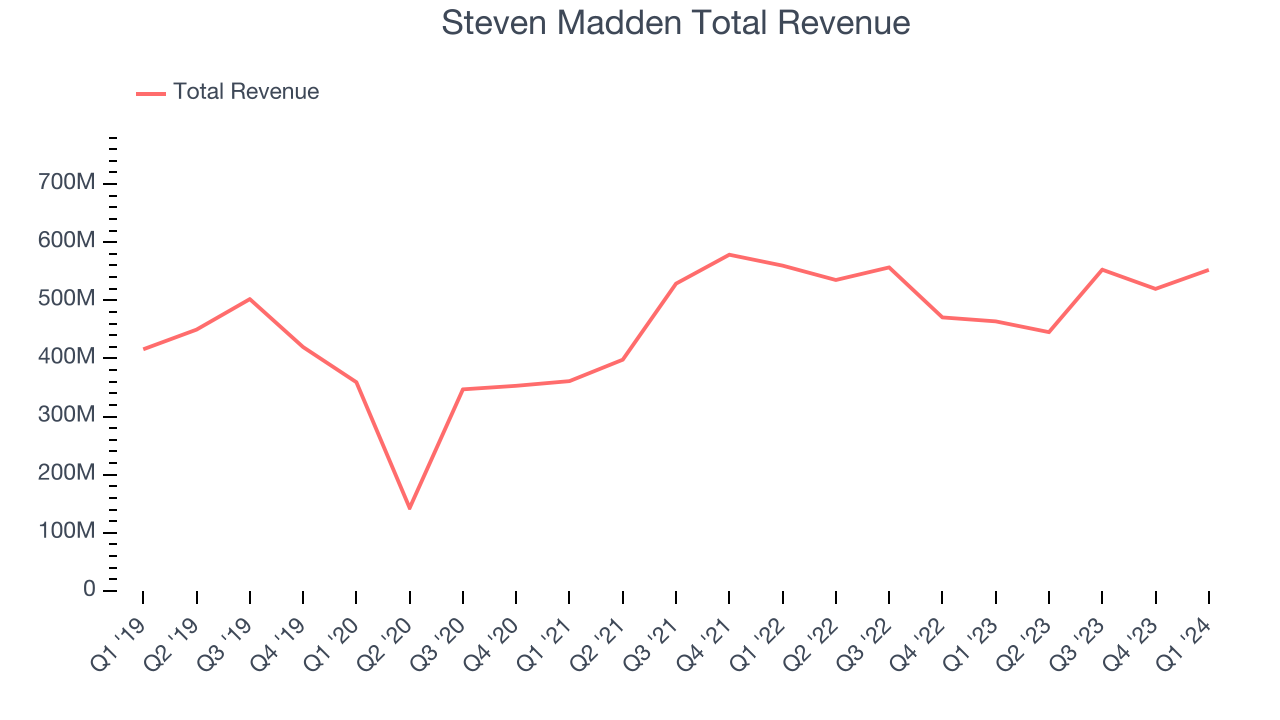 Within consumer discretionary, product cycles are short and revenue can be hit-driven due to rapidly changing trends. That's why we also follow short-term performance. Steven Madden's recent history shines a dimmer light on the company as its revenue was flat over the last two years.
We can better understand the company's revenue dynamics by analyzing its most important segments, Wholesale and Retail, which are 79.3% and 20.3% of revenue. Over the last two years, Steven Madden's Wholesale revenue (sales to retailers) averaged 3.8% year-on-year growth while its Retail revenue (direct sales to consumers) was flat.
This quarter, Steven Madden reported robust year-on-year revenue growth of 19.1%, and its $552.4 million of revenue exceeded Wall Street's estimates by 5.2%. Looking ahead, Wall Street expects sales to grow 8.6% over the next 12 months, a deceleration from this quarter.
Operating Margin
Operating margin is an important measure of profitability. It’s the portion of revenue left after accounting for all core expenses–everything from the cost of goods sold to advertising and wages. Operating margin is also useful for comparing profitability across companies with different levels of debt and tax rates because it excludes interest and taxes.
Steven Madden has done a decent job managing its expenses over the last eight quarters. The company has produced an average operating margin of 11.1%, higher than the broader consumer discretionary sector.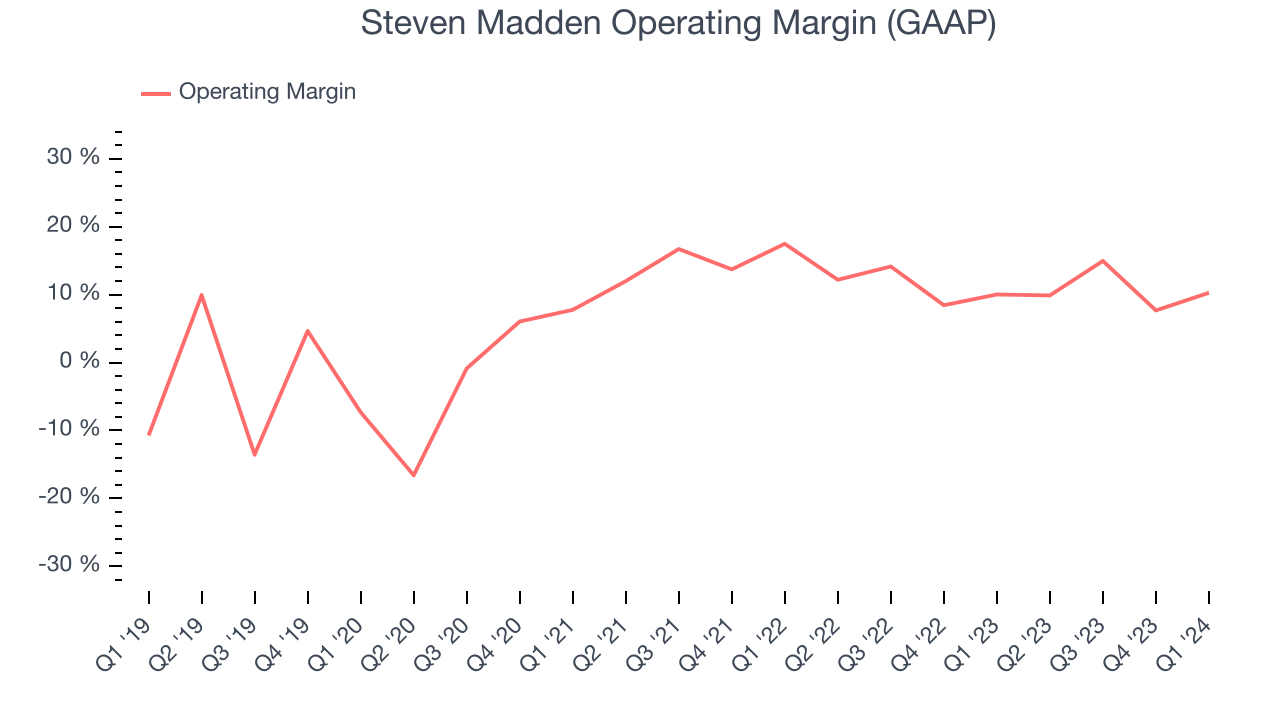
In Q1, Steven Madden generated an operating profit margin of 10.3%, in line with the same quarter last year. This indicates the company's costs have been relatively stable.
Over the next 12 months, Wall Street expects Steven Madden to maintain its LTM operating margin of 10.8%.EPS
Analyzing long-term revenue trends tells us about a company's historical growth, but the long-term change in its earnings per share (EPS) points to the profitability and efficiency of that growth–for example, a company could inflate its sales through excessive spending on advertising and promotions. 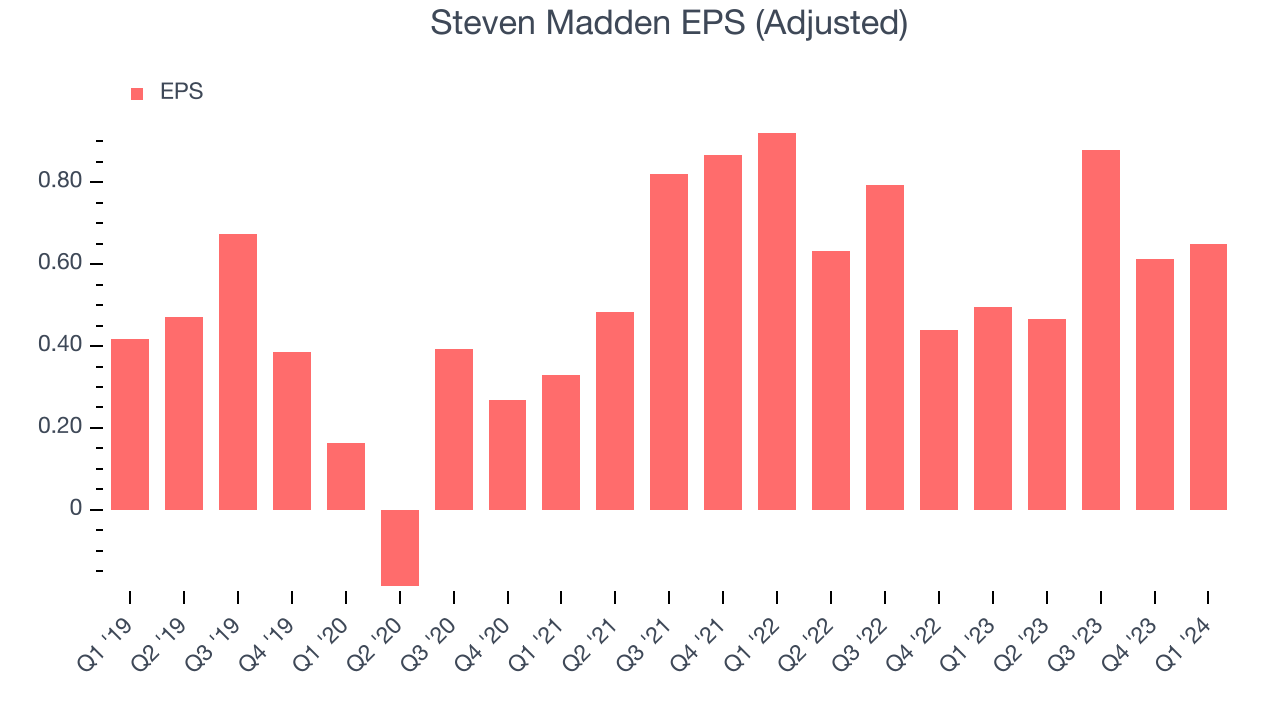
Over the last five years, Steven Madden's EPS grew 38.2%, translating into an unimpressive 6.7% compounded annual growth rate. This performance, however, is materially higher than its 4% annualized revenue growth over the same period. Let's dig into why.
While we mentioned earlier that Steven Madden's operating margin was flat this quarter, a five-year view shows its margin has expanded 21 percentage points while its share count has shrunk 13.5%. Improving profitability and share buybacks are positive signs as they juice EPS growth relative to revenue growth.In Q1, Steven Madden reported EPS at $0.65, up from $0.50 in the same quarter last year. This print beat analysts' estimates by 17.3%. Over the next 12 months, Wall Street expects Steven Madden to grow its earnings. Analysts are projecting its LTM EPS of $2.61 to climb by 3.5% to $2.70.
Cash Is King
Although earnings are undoubtedly valuable for assessing company performance, we believe cash is king because you can't use accounting profits to pay the bills.
Over the last two years, Steven Madden has shown decent cash profitability, giving it some reinvestment opportunities. The company's free cash flow margin has averaged 11.3%, slightly better than the broader consumer discretionary sector.
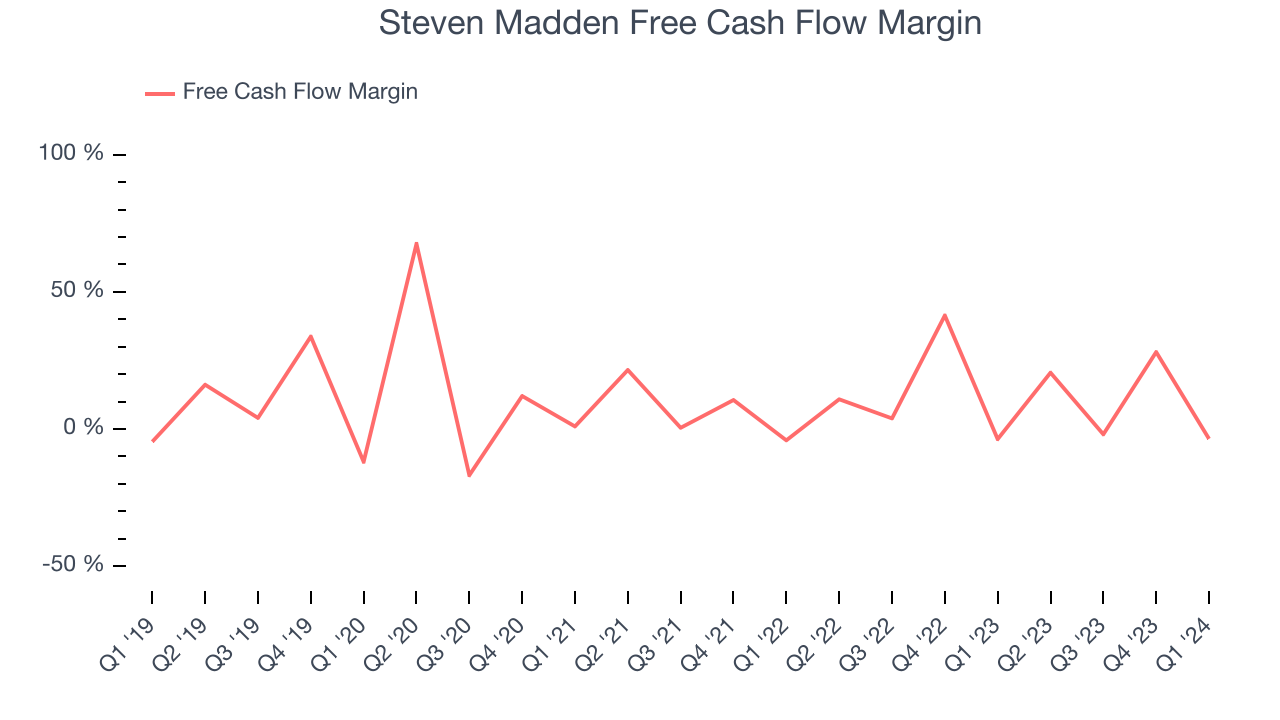
Steven Madden burned through $19.68 million of cash in Q1, equivalent to a negative 3.6% margin, reducing its cash burn by 15.3% year on year. Over the next year, analysts predict Steven Madden's cash profitability will fall. Their consensus estimates imply its LTM free cash flow margin of 10% will decrease to 8.1%.
Return on Invested Capital (ROIC)
EPS and free cash flow tell us whether a company was profitable while growing revenue. But was it capital-efficient? A company’s ROIC explains this by showing how much operating profit a company makes compared to how much money the business raised (debt and equity).
Steven Madden's five-year average return on invested capital was 16.3%, slightly better than the broader sector. Just as you’d like your investment dollars to generate returns, Steven Madden's invested capital has produced decent profits.
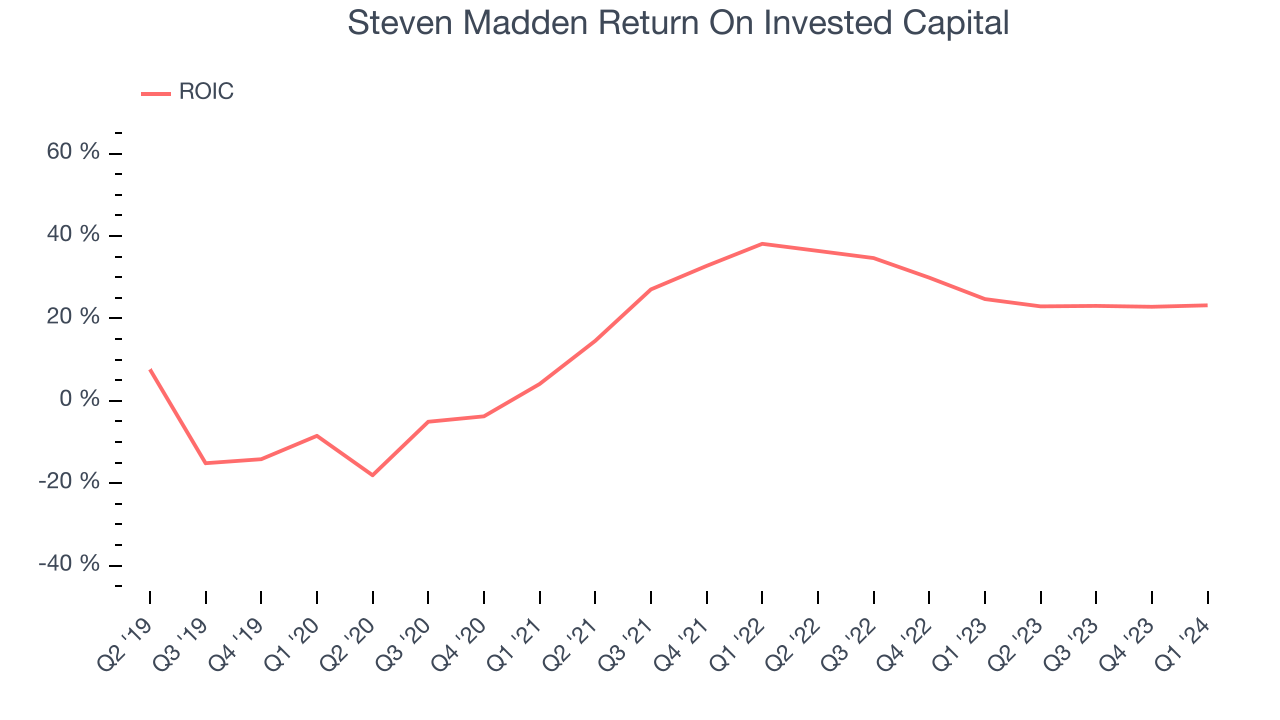
The trend in its ROIC, however, is often what surprises the market and drives the stock price. Over the last few years, Steven Madden's ROIC has significantly increased. This is a good sign, and we hope the company can continue improving.
Balance Sheet Risk
Debt is a tool that can boost company returns but presents risks if used irresponsibly.
Steven Madden is a profitable, well-capitalized company with $143.1 million of cash and $142.7 million of debt, meaning it could pay back all its debt tomorrow and still have $400,000 of cash on its balance sheet. This net cash position gives Steven Madden the freedom to raise more debt, return capital to shareholders, or invest in growth initiatives.
Key Takeaways from Steven Madden's Q1 Results
We enjoyed seeing Steven Madden exceed analysts' revenue and EPS expectations this quarter, driven by outperformance in its Wholesale segment. During the quarter, the Board approved a $0.21 quarterly dividend, payable on June 21, 2024 to stockholders as of June 10, 2024.
Looking ahead, the company's full-year revenue guidance was in line with estimates while its projected EPS was slightly below. Overall, we think this was a solid quarter. The stock is flat after reporting and currently trades at $40.41 per share.
Is Now The Time?
Steven Madden may have had a favorable quarter, but investors should also consider its valuation and business qualities when assessing the investment opportunity.
We cheer for all companies serving consumers, but in the case of Steven Madden, we'll be cheering from the sidelines. Its revenue growth has been uninspiring over the last five years, but at least growth is expected to increase in the short term. And while its above-average ROIC suggests its management team has made good investment decisions in the past, the downside is its projected EPS for the next year is lacking. On top of that, its EPS growth over the last five years has been subpar.
Steven Madden's price-to-earnings ratio based on the next 12 months is 15.0x. While we've no doubt one can find things to like about Steven Madden, we think there are better opportunities elsewhere in the market. We don't see many reasons to get involved at the moment.
Wall Street analysts covering the company had a one-year price target of $45 per share right before these results (compared to the current share price of $40.41).
To get the best start with StockStory, check out our most recent stock picks, and then sign up for our earnings alerts by adding companies to your watchlist here. We typically have the quarterly earnings results analyzed within seconds of the data being released, and especially for companies reporting pre-market, this often gives investors the chance to react to the results before the market has fully absorbed the information.