Fast food franchisee Carrols Restaurant Group (NASDAQ:TAST) announced better-than-expected results in Q3 CY2023, with revenue up 7.2% year on year to $475.8 million. It made a non-GAAP profit of $0.16 per share, improving from its loss of $0.14 per share in the same quarter last year.
Carrols (TAST) Q3 CY2023 Highlights:
- Revenue: $475.8 million vs analyst estimates of $468.9 million (1.5% beat)
- EPS (non-GAAP): $0.16 vs analyst estimates of $0.05 ($0.11 beat)
- Gross Margin (GAAP): 17.9%, up from 12.5% in the same quarter last year
- Free Cash Flow of $35.04 million, similar to the previous quarter
- Same-Store Sales were up 8.2% year on year
- Store Locations: 1,080 at quarter end, decreasing by 7 over the last 12 months
- Market Capitalization: $493.7 million
With a reputation for reviving underperforming locations, Carrols Restaurant Group (NASDAQ:TAST) is the largest franchisee of Burger King restaurants and also a major Popeyes franchisee.
In this case, franchisee Carrols obtains the rights to use the Burger King or Popeyes trademarked name and business model to operate in a location. Specifics vary, but Carrols–the franchisee–pays an initial fee plus ongoing royalty fees (a percentage of sales) to Restaurant Brands International (NYSE:QSR), the parent company of Burger King and Popeyes.
Carrols wasn’t always a franchisee. The company started with its own brand and began opening restaurants focused on traditional American fast food and desserts in the New York area in the early 1960s. In the early 1970s, as the larger national chains began dominating the fast-food landscape, Carrols made the major strategic decision to convert their Carrols Drive-In Restaurants into Burger King franchises and bet on the latter’s growth and long-term potential.
In early 2019, Carrols expanded its portfolio via a renewed agreement with Restaurant Brands, making it a franchisee of the Popeyes brand. Today, the company continues to develop new Burger King and Popeyes locations as well as acquire and revamp underperforming ones. With its experience and expertise, Carrols has created a reputation for successfully launching new locations and turning around underachieving restaurants on both the revenue and expense sides.
Traditional Fast Food
Traditional fast-food restaurants are renowned for their speed and convenience, boasting menus filled with familiar and budget-friendly items. Their reputations for on-the-go consumption make them favored destinations for individuals and families needing a quick meal. This class of restaurants, however, is fighting the perception that their meals are unhealthy and made with inferior ingredients, a battle that's especially relevant today given the consumers increasing focus on health and wellness.
Fast food competitors include Restaurant Brands International (NYSE:QSR), McDonald’s (NYSE:MCD), Shake Shack (NYSE:SHAK), and Wendy’s (NASDAQ:WEN).Sales Growth
Carrols is larger than most restaurant chains and benefits from economies of scale, giving it an edge over its smaller competitors.
As you can see below, the company's annualized revenue growth rate of 7.8% over the last four years (we compare to 2019 to normalize for COVID-19 impacts) was decent despite not opening many new restaurants, implying that growth was driven by higher sales at existing, established dining locations.
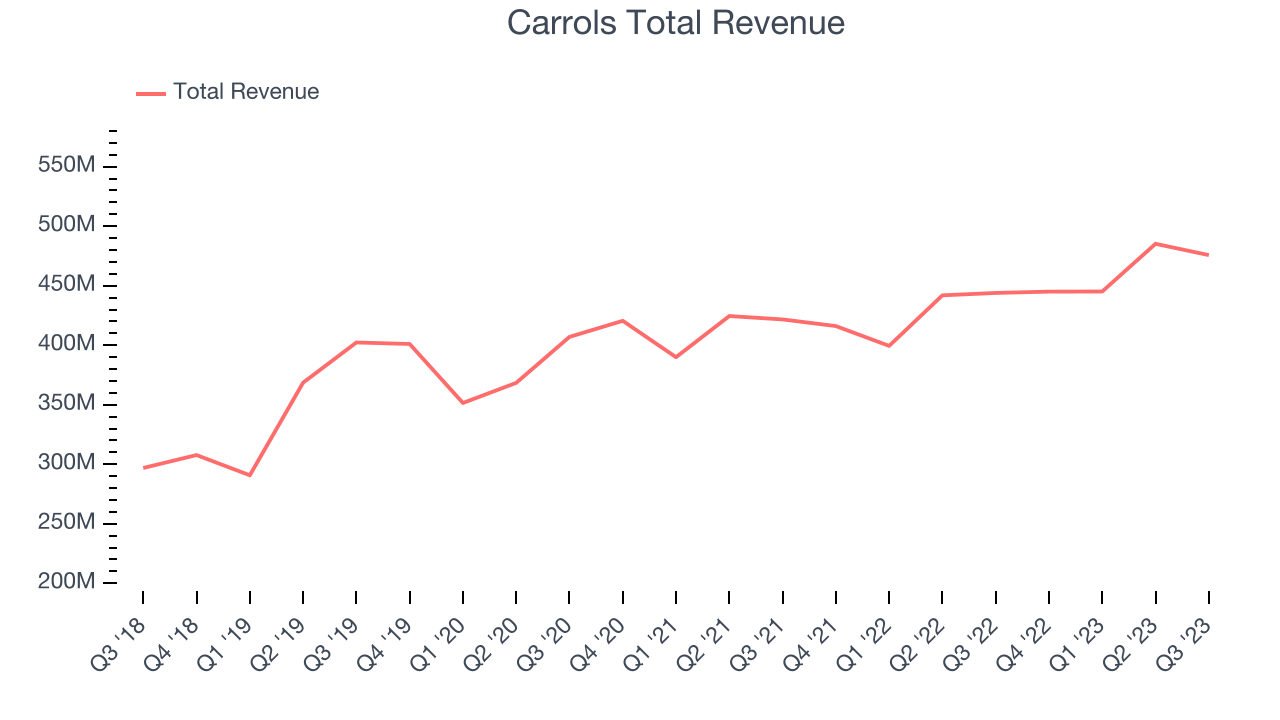
This quarter, Carrols reported solid year-on-year revenue growth of 7.2%, and its $475.8 million in revenue outperformed Wall Street's estimates by 1.5%. Looking ahead, Wall Street expects sales to grow 2.5% over the next 12 months, a deceleration from this quarter.
Number of Stores
A restaurant chain's total number of dining locations is a crucial factor influencing how much it can sell and how quickly company-level sales can grow.
When a chain like Carrols doesn't open many new restaurants, it usually means there's stable demand for its meals and it's focused on improving operational efficiency to increase profitability. At the end of this quarter, Carrols operated 1,080 total locations, in line with its restaurant count 12 months ago.
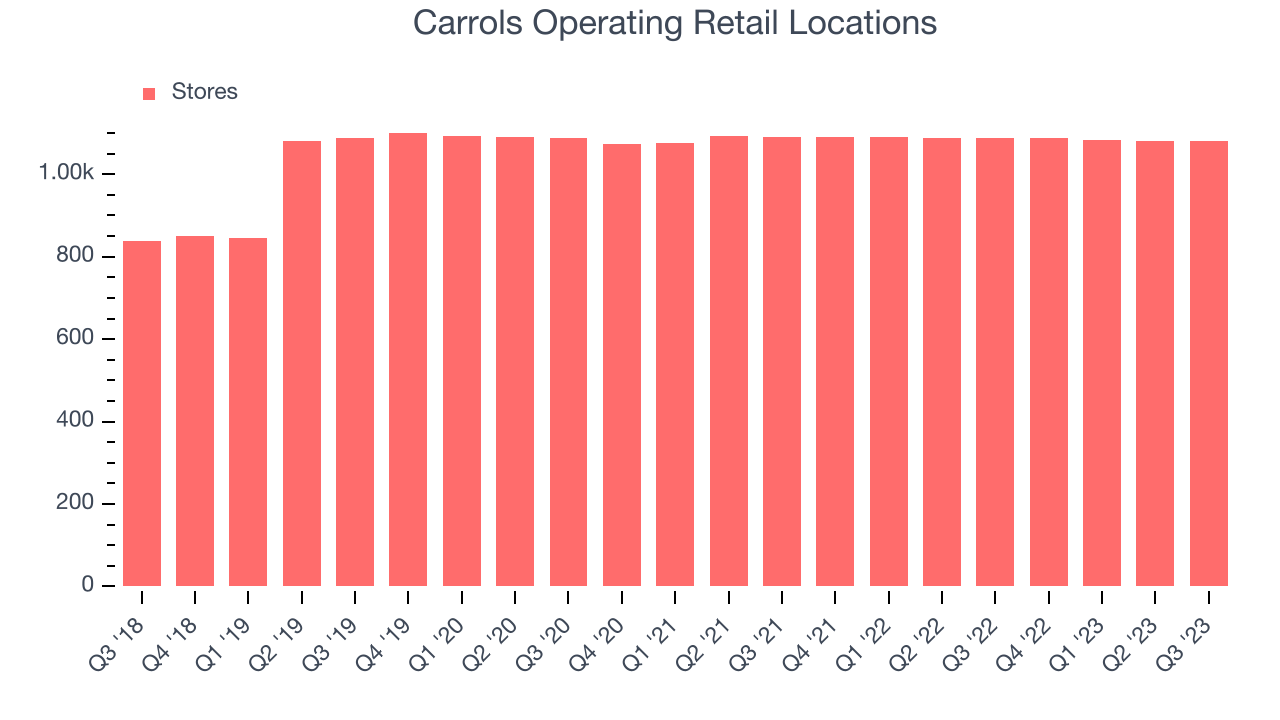
Taking a step back, Carrols has kept its locations flat over the last two years. A flat restaurant base means Carrols needs to boost foot traffic and turn tables faster at existing restaurants or raise prices to generate revenue growth.
Same-Store Sales
A company's same-store sales growth shows the year-on-year change in sales for its restaurants that have been open for at least a year, give or take. This is a key performance indicator because it measures organic growth and demand.
Carrols's demand within its existing restaurants has generally risen over the last two years but lagged behind the broader sector. On average, the company's same-store sales have grown by 6.7% year on year. Given its flat restaurant base over the same period, this performance stems from increased foot traffic or larger order sizes per customer at existing locations.
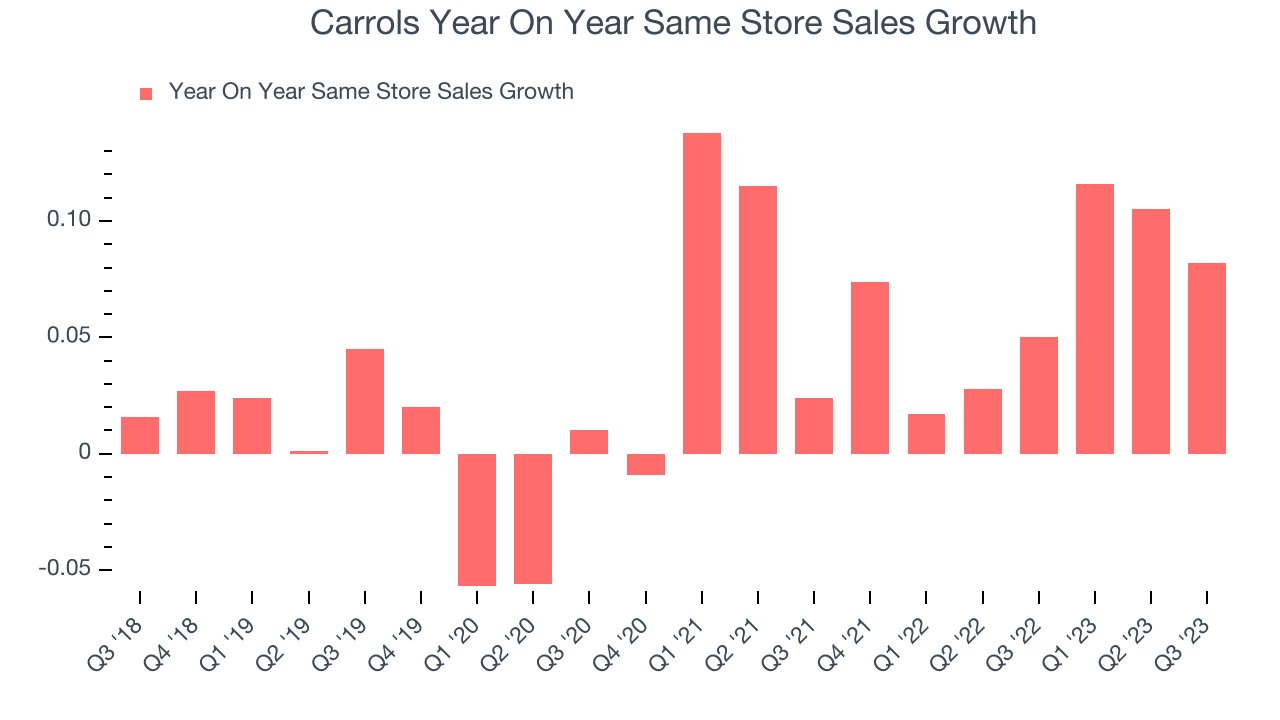
In the latest quarter, Carrols's same-store sales rose 8.2% year on year. This growth was an acceleration from the 5% year-on-year increase it posted 12 months ago, which is always an encouraging sign.
Gross Margin & Pricing Power
Gross profit margins are an important measure of a restaurant's pricing power and differentiation, whether it be the dining experience or quality and taste of food.
Carrols's gross profit margin came in at 17.9% this quarter. up 5.4 percentage points year on year. This means the company makes $0.14 for every $1 in revenue before accounting for its operating expenses.
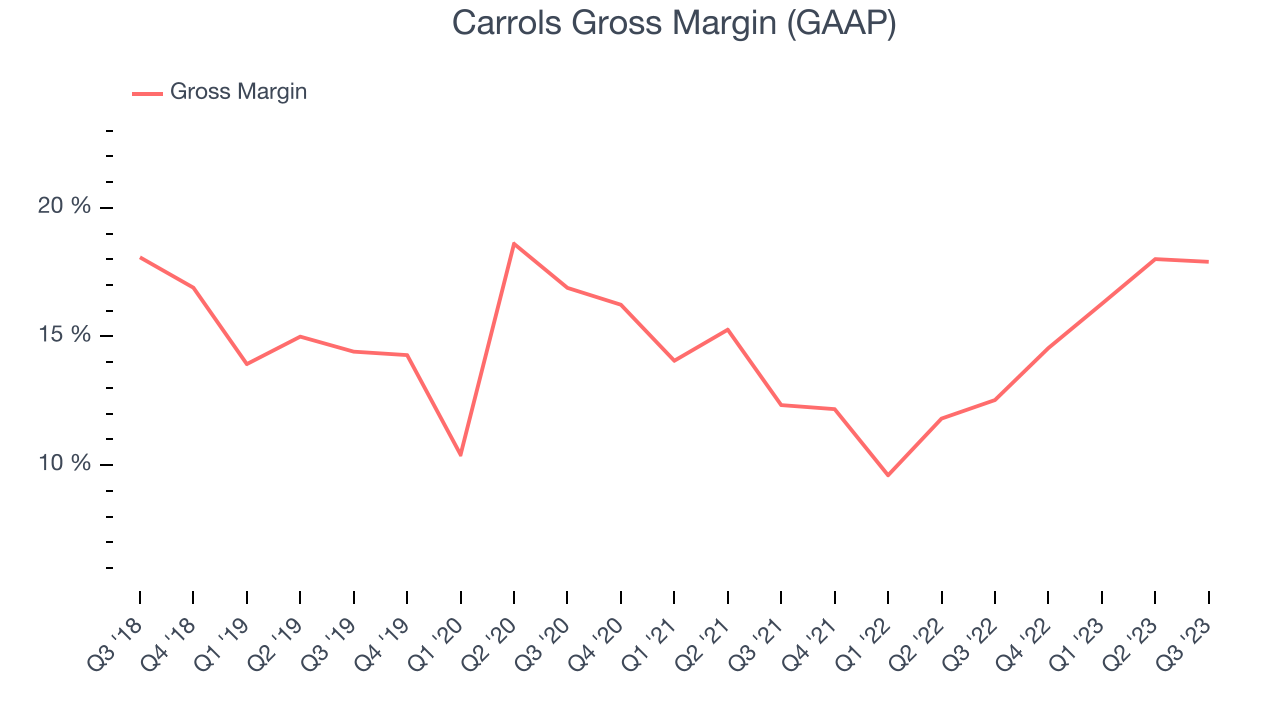
Carrols has poor unit economics for a restaurant company, leaving it with little room for error if things go awry. As you can see above, it's averaged a 14.3% gross margin over the last two years. Its margin, however, has been trending up over the last 12 months, averaging 46.1% year-on-year increases each quarter. If this trend continues, it could suggest a less competitive environment.
Operating Margin
Operating margin is a key profitability metric for restaurants because it accounts for all expenses keeping the lights on, including wages, rent, advertising, and other administrative costs.
This quarter, Carrols generated an operating profit margin of 4.9%, up 5.7 percentage points year on year. This increase was encouraging, and we can infer Carrols was more disciplined with its expenses or gained leverage on its fixed costs because its operating margin expanded more than its gross margin.
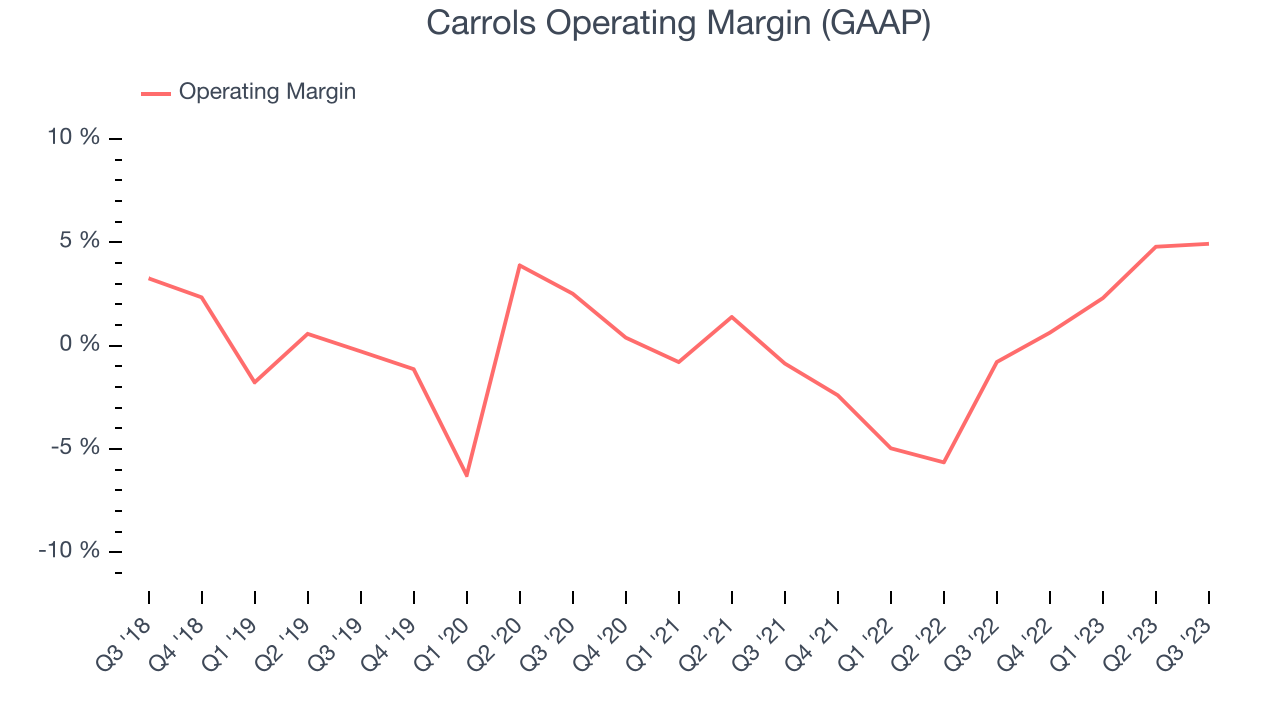 Zooming out, Carrols was profitable over the last eight quarters but held back by its large expense base. Its average operating margin of 0% has been among the worst in the restaurant sector. However, Carrols's margin has improved, on average, by 6.7 percentage points each year, an encouraging sign for shareholders. The tide could be turning.
EPS
These days, some companies issue new shares like there's no tomorrow. That's why we like to track earnings per share (EPS) because it accounts for shareholder dilution and share buybacks.
In Q3, Carrols reported EPS at $0.16, up from negative $0.14 in the same quarter a year ago. This print easily cleared Wall Street's estimates, and shareholders should be content with the results.
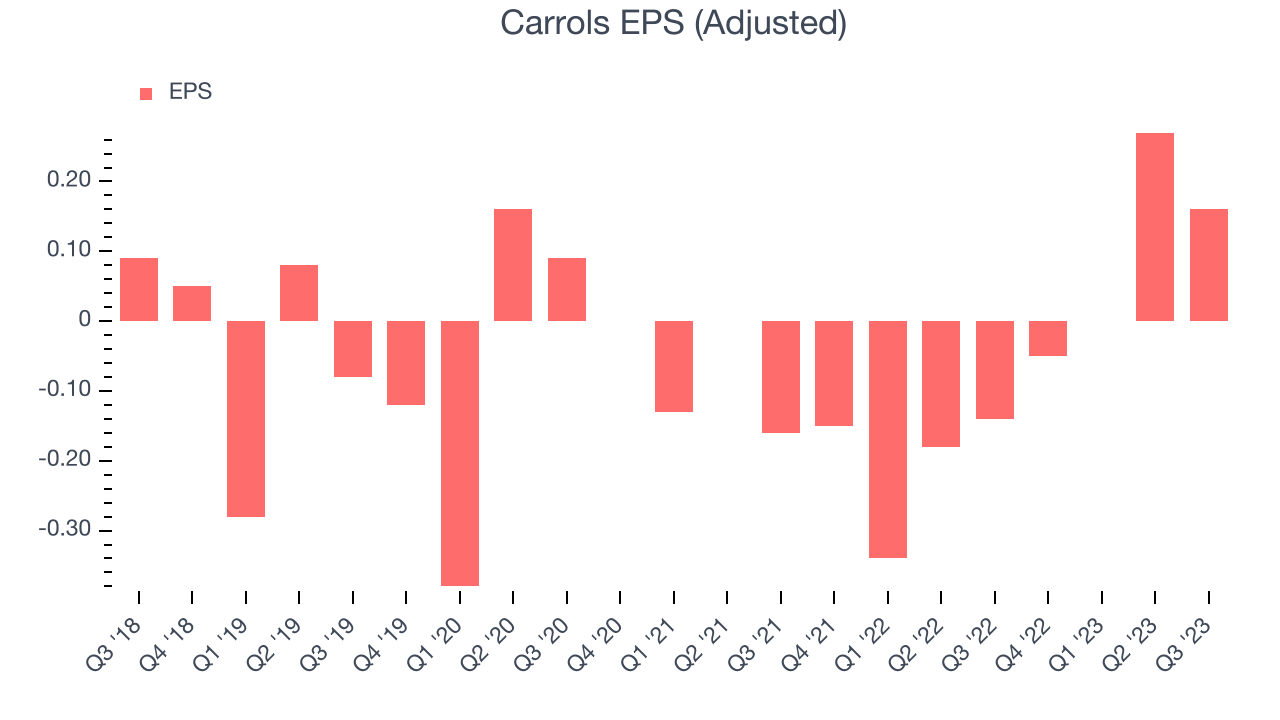
Between FY2019 and FY2023, Carrols's adjusted diluted EPS grew 265%, translating into a remarkable 38.2% compounded annual growth rate. This growth is materially higher than its revenue growth over the same period, showing that Carrols has excelled in managing its expenses.
Over the next 12 months, however, Wall Street is projecting an average 34.9% year-on-year decline in EPS.
Cash Is King
If you've followed StockStory for a while, you know that we emphasize free cash flow. Why, you ask? We believe that in the end, cash is king, and you can't use accounting profits to pay the bills.
Carrols's free cash flow came in at $35.04 million in Q3, up 152% year on year. This result represents a 7.4% margin.
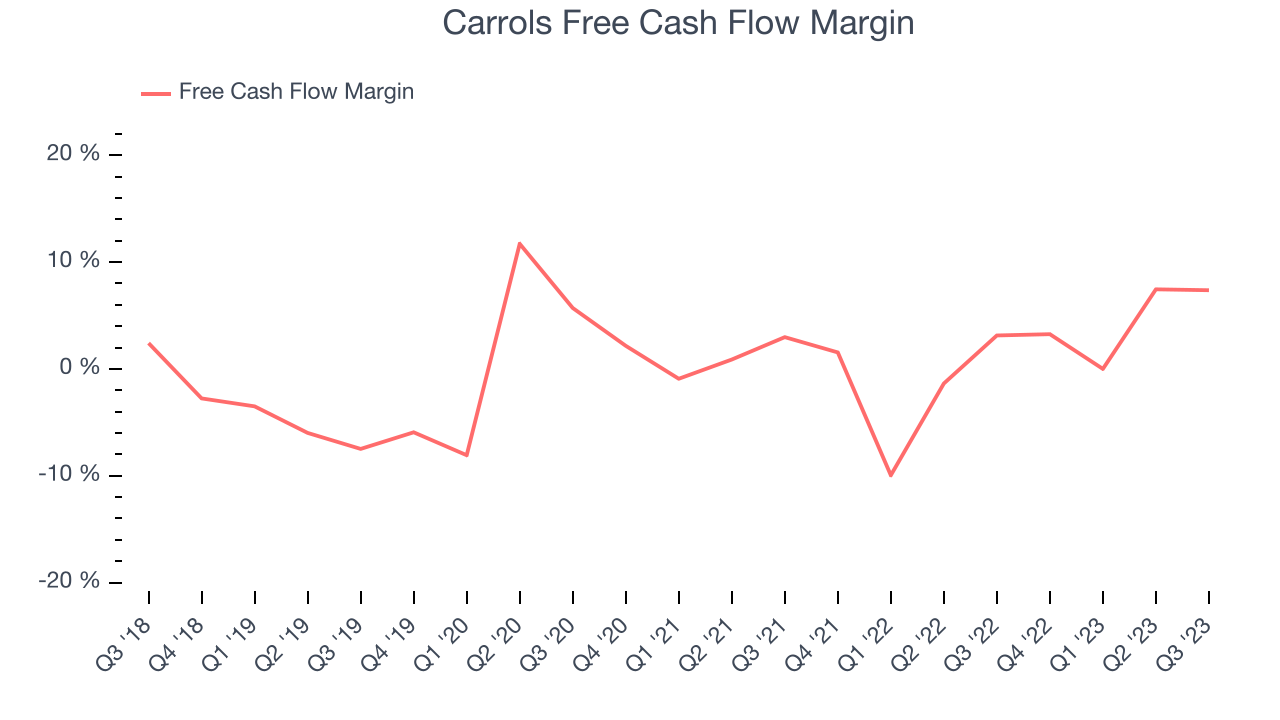
Over the last eight quarters, Carrols has shown mediocre cash profitability, putting it in a pinch as it gives the company limited opportunities to reinvest, pay down debt, or return capital to shareholders. Its free cash flow margin has averaged 1.7%, subpar for a restaurant business. However, its margin has averaged year-on-year increases of 6.1 percentage points. Continued momentum should improve its cash flow prospects.
Return on Invested Capital (ROIC)
EPS and free cash flow tell us whether a company was profitable while growing revenue. But was it capital-efficient? A company’s ROIC explains this by showing how much operating profit a company makes compared to how much money the business raised (debt and equity).
Carrols's five-year average ROIC was 0.5%, somewhat low compared to the best restaurant companies that consistently pump out 15%+. Its returns suggest it historically did a subpar job investing in profitable business initiatives.
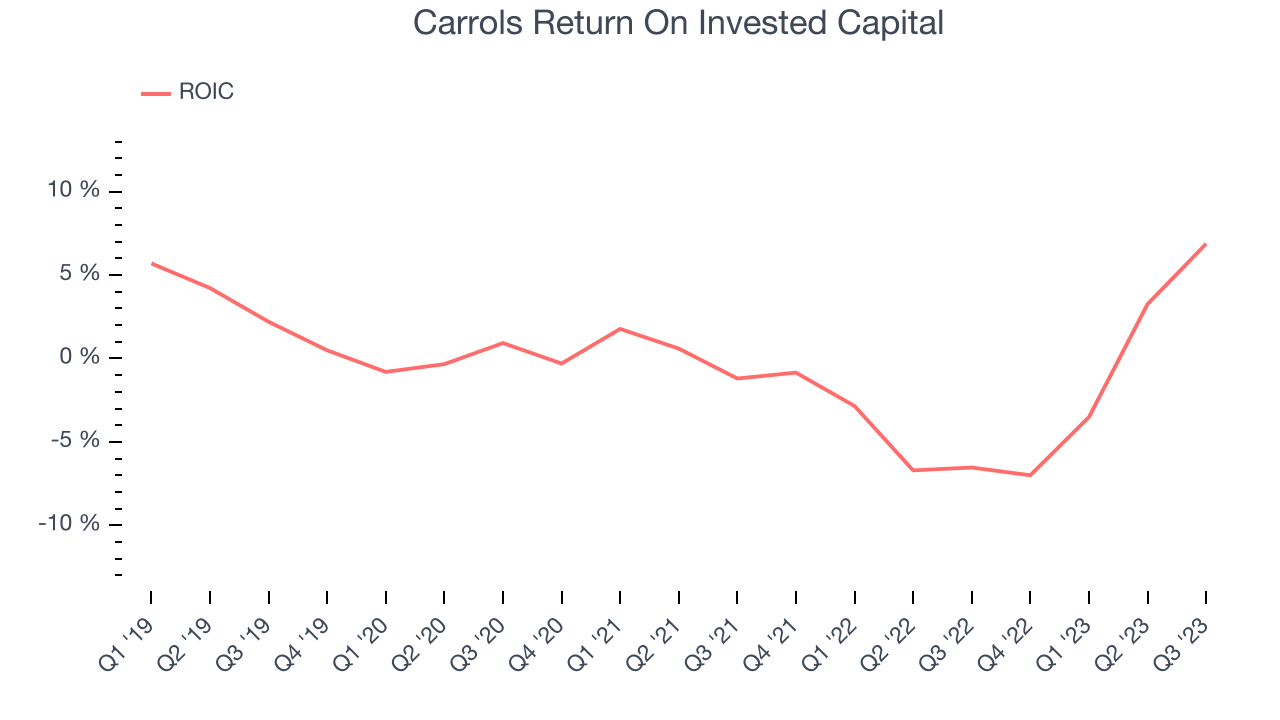
The trend in its ROIC, however, is often what surprises the market and drives the stock price. Unfortunately, Carrols's ROIC averaged 1.4 percentage point decreases over the last few years. Paired with its already low returns, these declines suggest the company's profitable business opportunities are few and far between.
Balance Sheet Risk
As long-term investors, the risk we care most about is the permanent loss of capital. This can happen when a company goes bankrupt or raises money from a disadvantaged position and is separate from short-term stock price volatility, which we are much less bothered by.
Carrols's $1.28 billion of debt exceeds the $73.02 million of cash on its balance sheet. Furthermore, its 9x net-debt-to-EBITDA ratio (based on its EBITDA of $142.3 million over the last 12 months) shows the company is overleveraged.
At this level of debt, incremental borrowing becomes increasingly expensive and credit agencies could downgrade the company’s rating if profitability falls. Carrols could also be backed into a corner if the market turns unexpectedly – a situation we seek to avoid as investors in high-quality companies.
We hope Carrols can improve its balance sheet and remain cautious until it increases its profitability or reduces its debt.
Key Takeaways from Carrols's Q3 Results
We were impressed by how significantly Carrols blew past analysts' EPS expectations this quarter. We were also excited its gross margin outperformed Wall Street's estimates. Zooming out, we think this was a great quarter that shareholders will appreciate. The stock is flat after reporting and currently trades at $9.48 per share.
Is Now The Time?
Carrols may have had a good quarter, but investors should also consider its valuation and business qualities when assessing the investment opportunity.
We cheer for all companies serving consumers, but in the case of Carrols, we'll be cheering from the sidelines. Although its revenue growth has been decent over the last four years, its projected EPS for the next year is lacking. And while its EPS growth over the last four years has significantly beat its peer group average, the downside is its relatively low ROIC suggests it has struggled to grow profits historically.
Carrols's price-to-earnings ratio based on the next 12 months is 38.3x. While we've no doubt one can find things to like about Carrols, we think there are better opportunities elsewhere in the market. We don't see many reasons to get involved at the moment.
Wall Street analysts covering the company had a one-year price target of $9.25 per share right before these results (compared to the current share price of $9.48), implying they didn't see much short-term potential in Carrols.
To get the best start with StockStory, check out our most recent stock picks, and then sign up to our earnings alerts by adding companies to your watchlist here. We typically have the quarterly earnings results analyzed within seconds of the data being released, and especially for companies reporting pre-market, this often gives investors the chance to react to the results before the market has fully absorbed the information.