
Online fashion resale marketplace ThredUp (NASDAQ:TDUP) fell short of analysts' expectations in Q1 CY2024, with revenue up 4.8% year on year to $79.59 million. Next quarter's revenue guidance of $82 million also underwhelmed, coming in 4.7% below analysts' estimates. It made a GAAP loss of $0.15 per share, improving from its loss of $0.19 per share in the same quarter last year.
ThredUp (TDUP) Q1 CY2024 Highlights:
- Revenue: $79.59 million vs analyst estimates of $80.32 million (small miss)
- EPS: -$0.15 vs analyst expectations of -$0.14 (9.1% miss)
- Revenue Guidance for Q2 CY2024 is $82 million at the midpoint, below analyst estimates of $86 million
- The company dropped its revenue guidance for the full year from $345 million to $333 million at the midpoint, a 3.5% decrease
- Gross Margin (GAAP): 69.5%, up from 67.3% in the same quarter last year
- Free Cash Flow was -$227,000 compared to -$10.18 million in the previous quarter
- Active Buyers: 1.7 million
- Market Capitalization: $198.4 million
Founded to revolutionize thrifting, ThredUp (NASDAQ:TDUP) is a leading online fashion resale marketplace that offers a wide selection of gently-used clothing and accessories.
The company addresses a large problem in fashion: people often have wardrobes filled with items they rarely wear. ThredUp solves this by creating a market to buy and sell used fashion goods, promoting a circular fashion economy that minimizes waste and reduces the environmental footprint of the industry.
Given the used nature of products listed on its marketplace, the company places a strong emphasis on quality control. Every item is inspected to ensure secondhand shopping on its platform is as reliable as buying new. Combined with a user-friendly interface and transparent pricing, ThredUp makes the thrifting experience accessible and convenient.
The company generates revenue by charging sellers a commission or processing fee for each item they sell on the platform. This fee varies depending on the selling price of the item, typically ranging from 5% to 20% of the sale price.
Apparel, Accessories and Luxury Goods
Within apparel and accessories, not only do styles change more frequently today than decades past as fads travel through social media and the internet but consumers are also shifting the way they buy their goods, favoring omnichannel and e-commerce experiences. Some apparel, accessories, and luxury goods companies have made concerted efforts to adapt while those who are slower to move may fall behind.
ThredUp’s main competitors are Poshmark (owned by Naver Corporation, KRX:035420), The RealReal (NASDAQ:REAL), Depop (owned by Etsy NASDAQ:ETSY), and Mercari (OTCMKTS:MCARY).Sales Growth
A company's long-term performance can indicate its business quality. Any business can enjoy short-lived success, but best-in-class ones sustain growth over many years. ThredUp's annualized revenue growth rate of 16.1% over the last four years was decent for a consumer discretionary business. 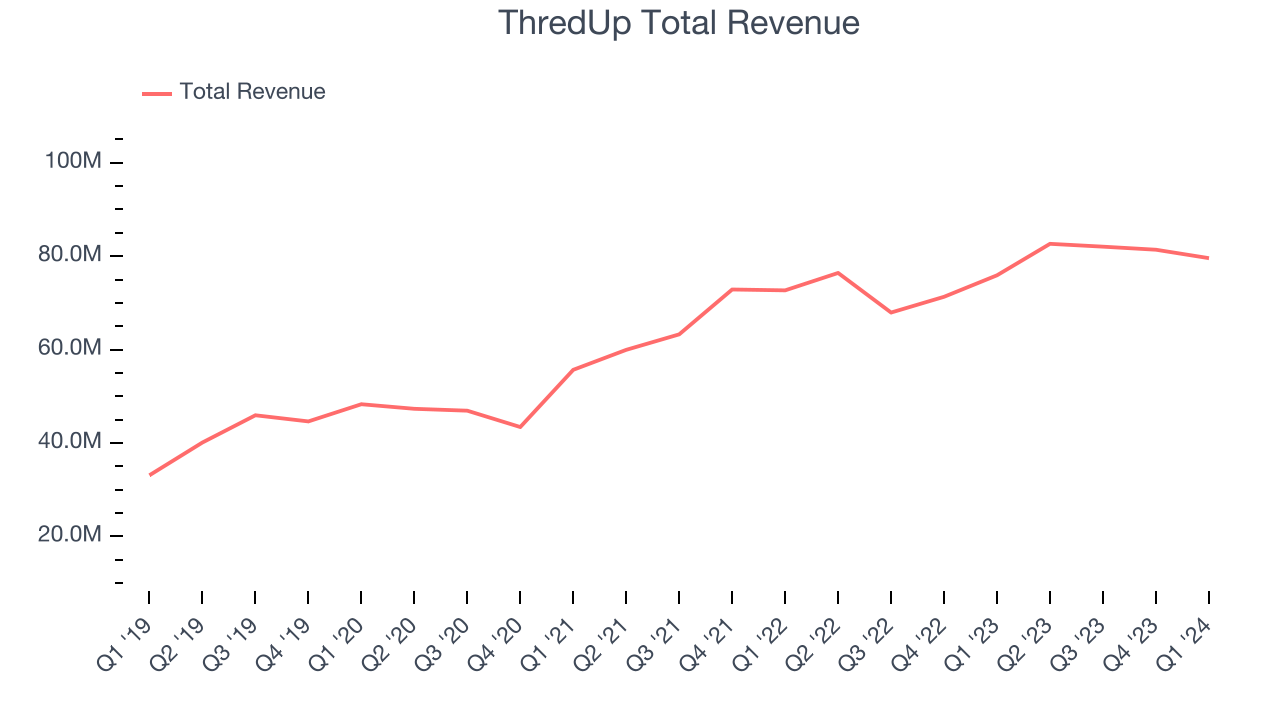 Within consumer discretionary, a long-term historical view may miss a company riding a successful new product or emerging trend. That's why we also follow short-term performance. ThredUp's recent history shows the business has slowed as its annualized revenue growth of 10.1% over the last two years is below its four-year trend.
This quarter, ThredUp's revenue grew 4.8% year on year to $79.59 million, falling short of Wall Street's estimates. For next quarter, the company is guiding for flat year on year revenue of $82 million, slowing from the 8.2% year-on-year increase it recorded in the same quarter last year. Looking ahead, Wall Street expects sales to grow 8.2% over the next 12 months, an acceleration from this quarter.
Operating Margin
Operating margin is an important measure of profitability. It’s the portion of revenue left after accounting for all core expenses–everything from the cost of goods sold to advertising and wages. Operating margin is also useful for comparing profitability across companies with different levels of debt and tax rates because it excludes interest and taxes.
Given the consumer discretionary industry's volatile demand characteristics, unprofitable companies should be scrutinized. Over the last two years, ThredUp's high expenses have contributed to an average operating margin of negative 25.5%.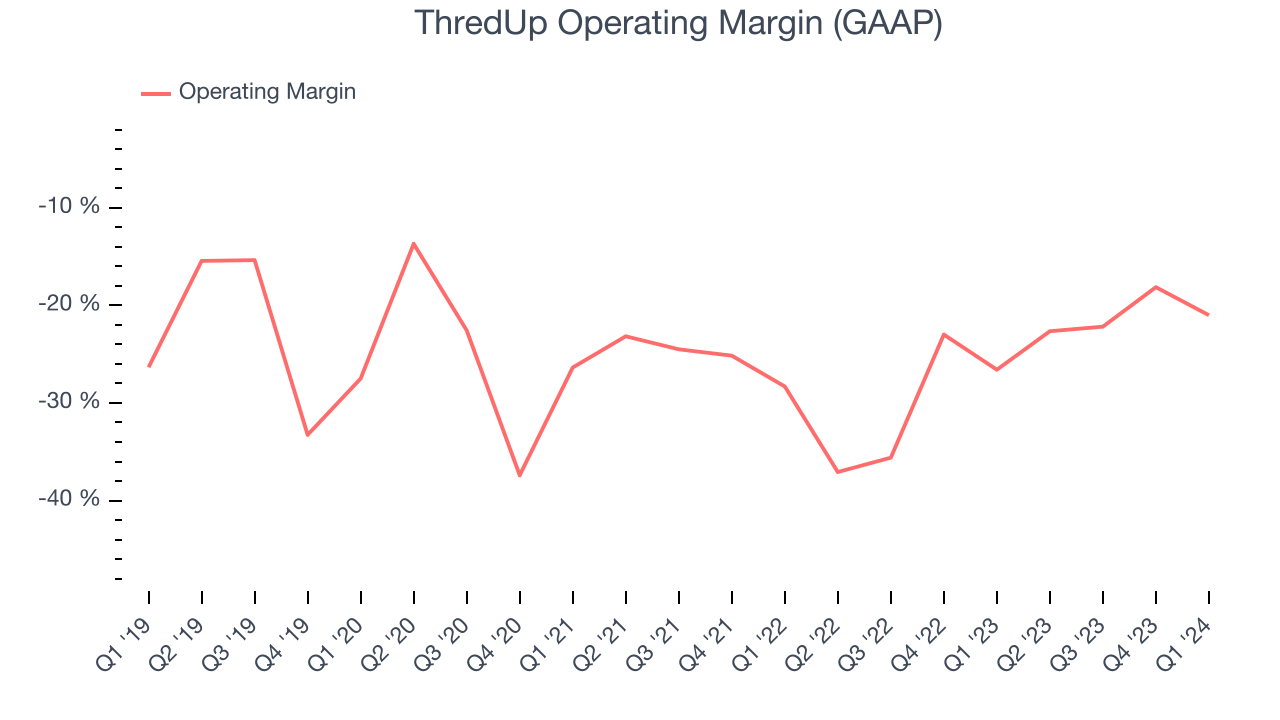
In Q1, ThredUp generated an operating profit margin of negative 21%, up 5.6 percentage points year on year.
Over the next 12 months, Wall Street expects ThredUp to shrink its losses but remain unprofitable. Analysts are expecting the company’s LTM operating margin of negative 21% to rise to negative 3%.EPS
Analyzing long-term revenue trends tells us about a company's historical growth, but the long-term change in its earnings per share (EPS) points to the profitability and efficiency of that growth–for example, a company could inflate its sales through excessive spending on advertising and promotions.
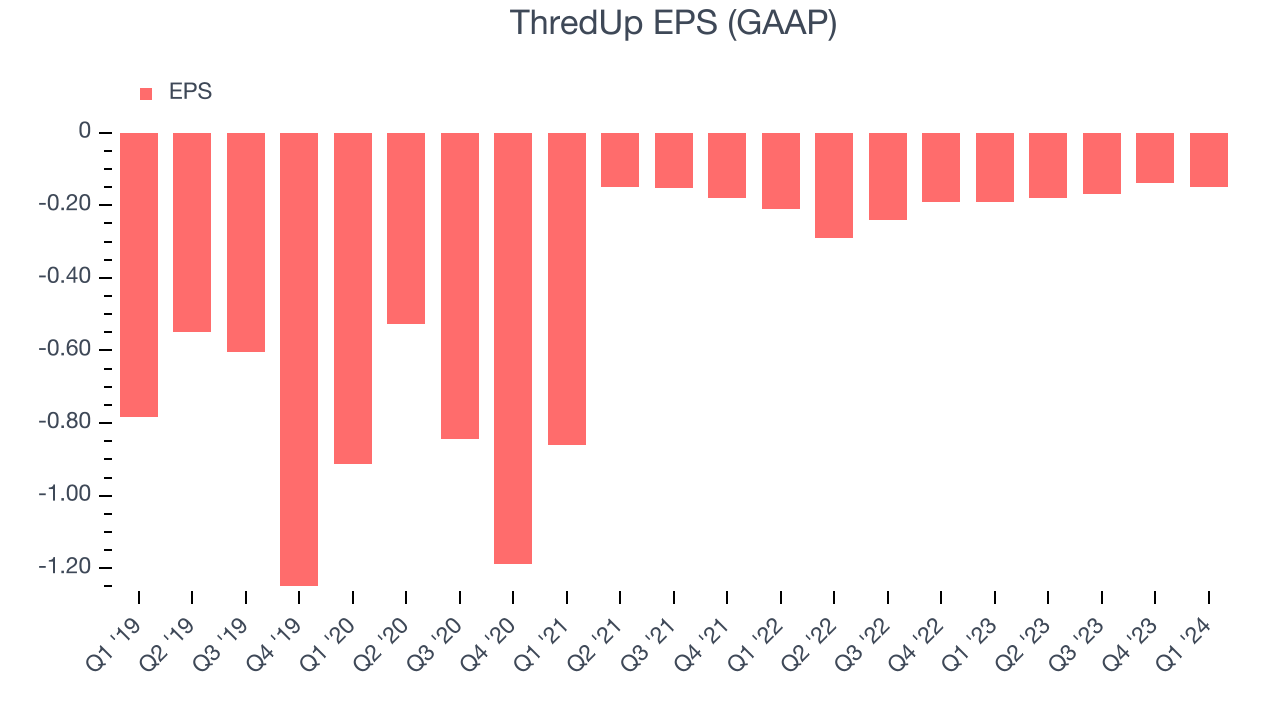
Over the last four years, ThredUp cut its earnings losses and improved its EPS by 33.7% each year. This performance is materially higher than its 16.1% annualized revenue growth over the same period. Let's dig into why.
ThredUp's operating margin has expanded 6.5 percentage points over the last four years, leading to higher profitability and earnings. Taxes and interest expenses can also affect EPS growth, but they don't tell us as much about a company's fundamentals.
In Q1, ThredUp reported EPS at negative $0.15, up from negative $0.19 in the same quarter last year. Despite growing year on year, this print unfortunately missed analysts' estimates, but we care more about long-term EPS growth rather than short-term movements. Over the next 12 months, Wall Street is optimistic. Analysts are projecting ThredUp's LTM EPS of negative $0.64 to reach break even.
Cash Is King
If you've followed StockStory for a while, you know we emphasize free cash flow. Why, you ask? We believe that in the end, cash is king, and you can't use accounting profits to pay the bills.
Over the last two years, ThredUp's demanding reinvestments to stay relevant with consumers have drained company resources. Its free cash flow margin has been among the worst in the consumer discretionary sector, averaging negative 18.6%.
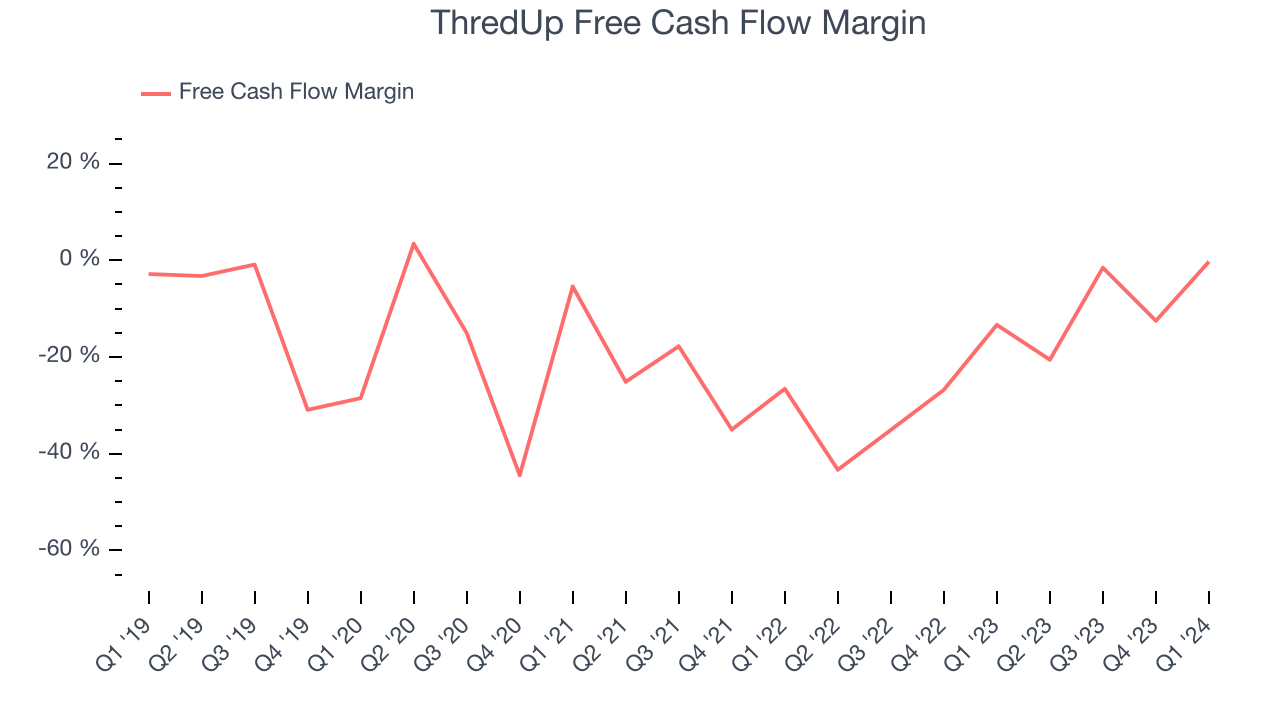
ThredUp broke even from a free cash flow perspective in Q1. This quarter's result was great for the business as its margin was 13.1 percentage points higher than in the same period last year. Over the next year, analysts predict ThredUp's cash profitability will improve to break even. Their consensus estimates imply its LTM free cash flow margin of negative 8.8% will increase by 8 percentage points.
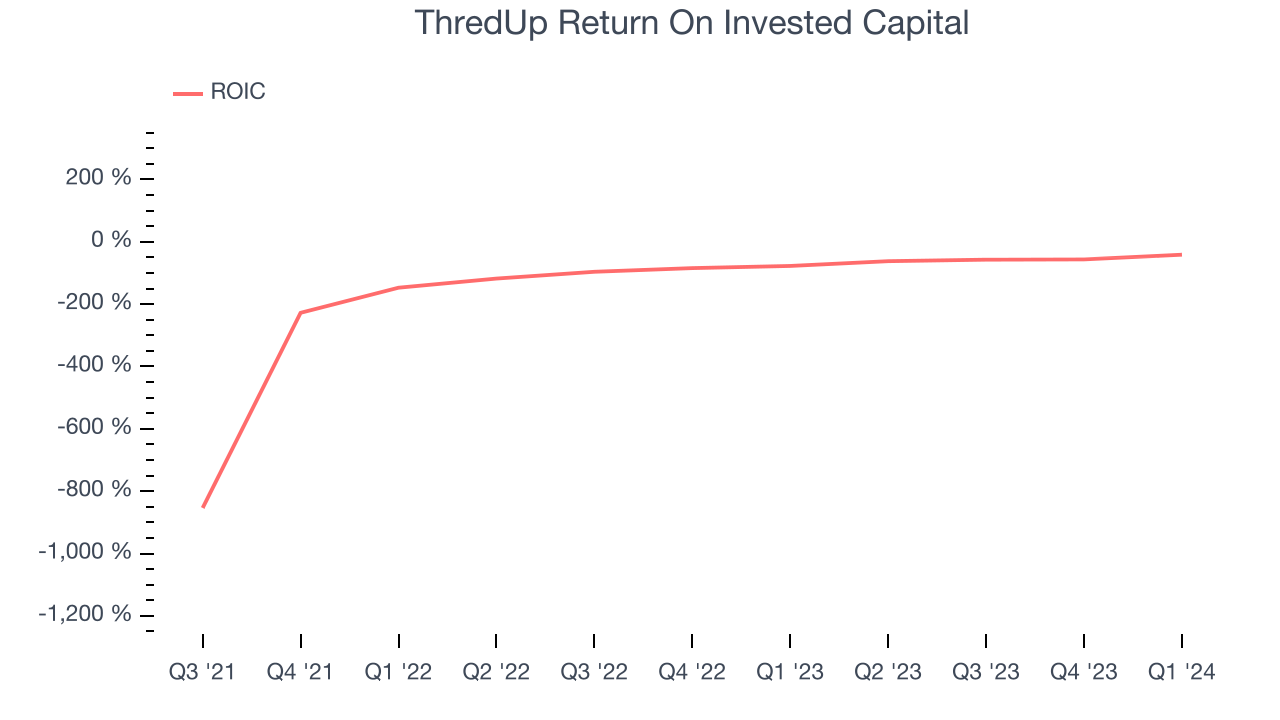
Return on Invested Capital (ROIC)
EPS and free cash flow tell us whether a company was profitable while growing revenue. But was it capital-efficient? Enter ROIC, a metric showing how much operating profit a company generates relative to how much money the business raised (debt and equity).
ThredUp's five-year average return on invested capital was negative 59.5%, meaning management lost money while trying to expand the business. Its returns were among the worst in the consumer discretionary sector.
Balance Sheet Risk
Debt is a tool that can boost company returns but presents risks if used irresponsibly.
ThredUp, which has $62.51 million of cash and $80.15 million of debt on its balance sheet, was unprofitable over the last 12 months. It posted negative $11.48 million of EBITDA, and as investors in high-quality companies, we seek to avoid indebted loss-making companies.
We implore our readers to do the same because credit agencies could downgrade ThredUp if its unprofitable ways continue, making incremental borrowing more expensive and restricting growth prospects. The company could also be backed into a corner if the market turns unexpectedly. We hope ThredUp can improve its profitability and remain cautious until then.
Key Takeaways from ThredUp's Q1 Results
We struggled to find many strong positives in these results. Its revenue and full-year revenue guidance missed Wall Street's estimates along with its operating margin and EPS. This poor performance was driven by fewer active buyers on the platform than expected. Overall, this was a bad quarter for ThredUp. The company is down 6.2% on the results and currently trades at $1.75 per share.
Is Now The Time?
ThredUp may have had a tough quarter, but investors should also consider its valuation and business qualities when assessing the investment opportunity.
We cheer for all companies serving consumers, but in the case of ThredUp, we'll be cheering from the sidelines. Although its revenue growth has been decent over the last four years, its relatively low ROIC suggests it has historically struggled to find compelling business opportunities. And while its projected EPS for the next year implies the company's fundamentals will improve, the downside is its cash burn raises the question of whether it can sustainably maintain growth.
While we've no doubt one can find things to like about ThredUp, we think there are better opportunities elsewhere in the market. We don't see many reasons to get involved at the moment.
Wall Street analysts covering the company had a one-year price target of $4.40 per share right before these results (compared to the current share price of $1.75).
To get the best start with StockStory, check out our most recent stock picks, and then sign up for our earnings alerts by adding companies to your watchlist here. We typically have the quarterly earnings results analyzed within seconds of the data being released, and especially for companies reporting pre-market, this often gives investors the chance to react to the results before the market has fully absorbed the information.