Online real estate marketplace Zillow (NASDAQ:ZG) reported Q1 CY2024 results topping analysts' expectations, with revenue up 12.8% year on year to $529 million. It made a GAAP loss of $0.10 per share, down from its loss of $0.09 per share in the same quarter last year.
Zillow (ZG) Q1 CY2024 Highlights:
- Revenue: $529 million vs analyst estimates of $507.7 million (4.2% beat)
- EPS: -$0.10 vs analyst expectations of -$0.08 (23.4% miss)
- Gross Margin (GAAP): 76.7%, down from 80.4% in the same quarter last year
- Free Cash Flow of $41 million, down 21.2% from the previous quarter
- Market Capitalization: $10.02 billion
Founded by Expedia co-founders Lloyd Frink and Rich Barton, Zillow (NASDAQ:ZG) is the leading U.S. online real estate marketplace.
Zillow is an online residential real estate database with information on more than 100 million homes in the U.S. on its three main properties: Zillow, Trulia, and StreetEasy. Home buyers come to the site to search for available homes along with detailed information regarding everything from school districts to crime rates and estimated property taxes along with access to mortgages, and most importantly, real estate agents whom interested buyers can connect with. Zillow’s most differentiated feature is its Z-estimate – a feature that provides real-time estimates of a home’s value and attracts potential home sellers to the platform.
The company generates the bulk of its revenues from its Premier Agent business, where real estate agents pay Zillow to advertise on its platform while receiving a suite of customer relationship management tools. It also generates advertising revenues from mortgage lenders and other real estate professionals, as well as fees from its Mortech mortgage software. For both mortgage lenders and real estate agents, Zillow provides a massive aggregated audience of potential customers in the US, customers who are both actively showing intent, and able to be targeted at granular zip code levels.
As you will see in our report, Zillow's historical financials are distorted given its rapid entry and exit of Zillow Offers, its former iBuying division (buying and selling homes). The company closed this business line in November 2021 after losing $1 billion+ over 3.5 years. The properties Zillow purchased as part of this venture are no longer on its balance sheet today.
Real Estate Services
Technology has been a double-edged sword in real estate services. On the one hand, internet listings are effective at disseminating information far and wide, casting a wide net for buyers and sellers to increase the chances of transactions. On the other hand, digitization in the real estate market could potentially disintermediate key players like agents who use information asymmetries to their advantage.
Zillow competes with online advertising platforms such as Google (NASDAQ:GOOGL), Yelp (NYSE:YELP) and Meta Platforms (NASDAQ:META), along with rival real estate platforms Move.com (owned by NASDAQ: NWSA), Redfin (NASDAQ:RDFN), Realogy (NYSE:RLGY), and Compass (NYSE:COMP).
Sales Growth
Examining a company's long-term performance can provide clues about its business quality. Any business can put up a good quarter or two, but the best consistently grow over the long haul. Zillow's annualized revenue growth rate of 6.1% over the last five years was weak for a consumer discretionary business. 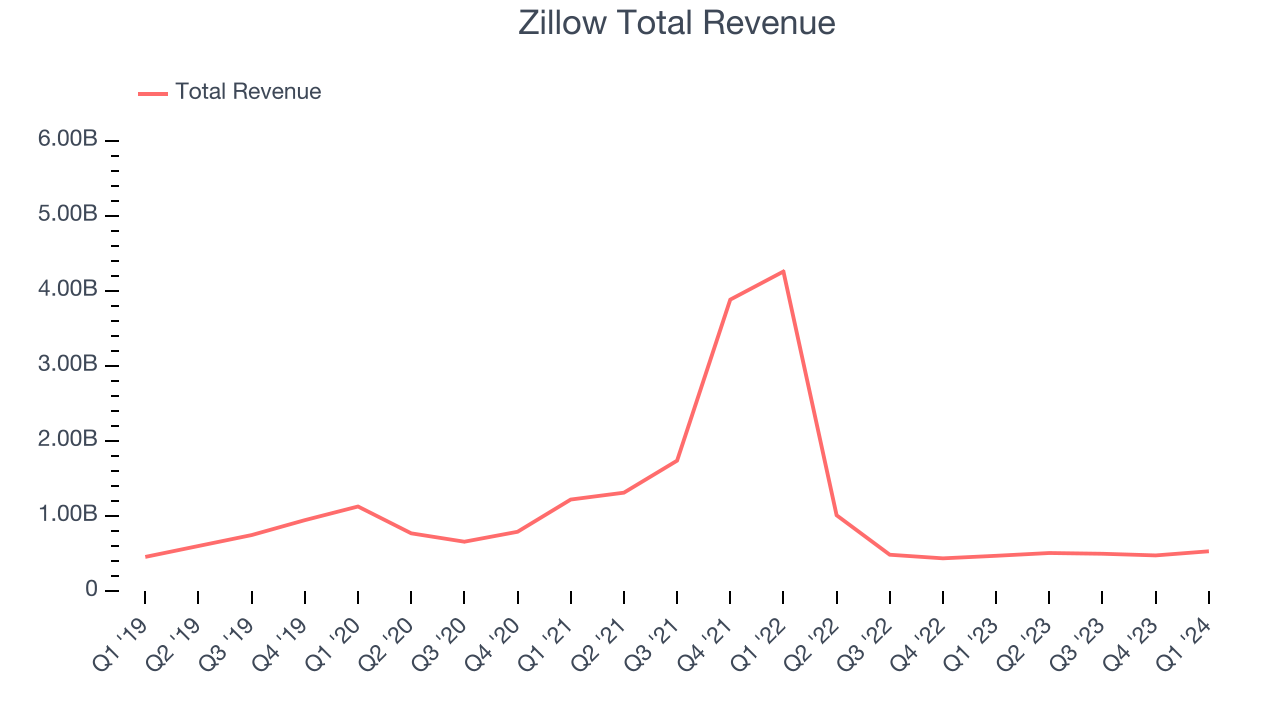 Within consumer discretionary, product cycles are short and revenue can be hit-driven due to rapidly changing trends. That's why we also follow short-term performance. Zillow's recent history shows a reversal from its already weak five-year trend as its revenue has shown annualized declines of 57.7% over the last two years.
This quarter, Zillow reported robust year-on-year revenue growth of 12.8%, and its $529 million of revenue exceeded Wall Street's estimates by 4.2%. Looking ahead, Wall Street expects sales to grow 12.1% over the next 12 months, a deceleration from this quarter.
Operating Margin
Operating margin is an important measure of profitability. It’s the portion of revenue left after accounting for all core expenses–everything from the cost of goods sold to advertising and wages. Operating margin is also useful for comparing profitability across companies with different levels of debt and tax rates because it excludes interest and taxes.
Given the consumer discretionary industry's volatile demand characteristics, unprofitable companies should be scrutinized. Over the last two years, Zillow's high expenses have contributed to an average operating margin of negative 10%.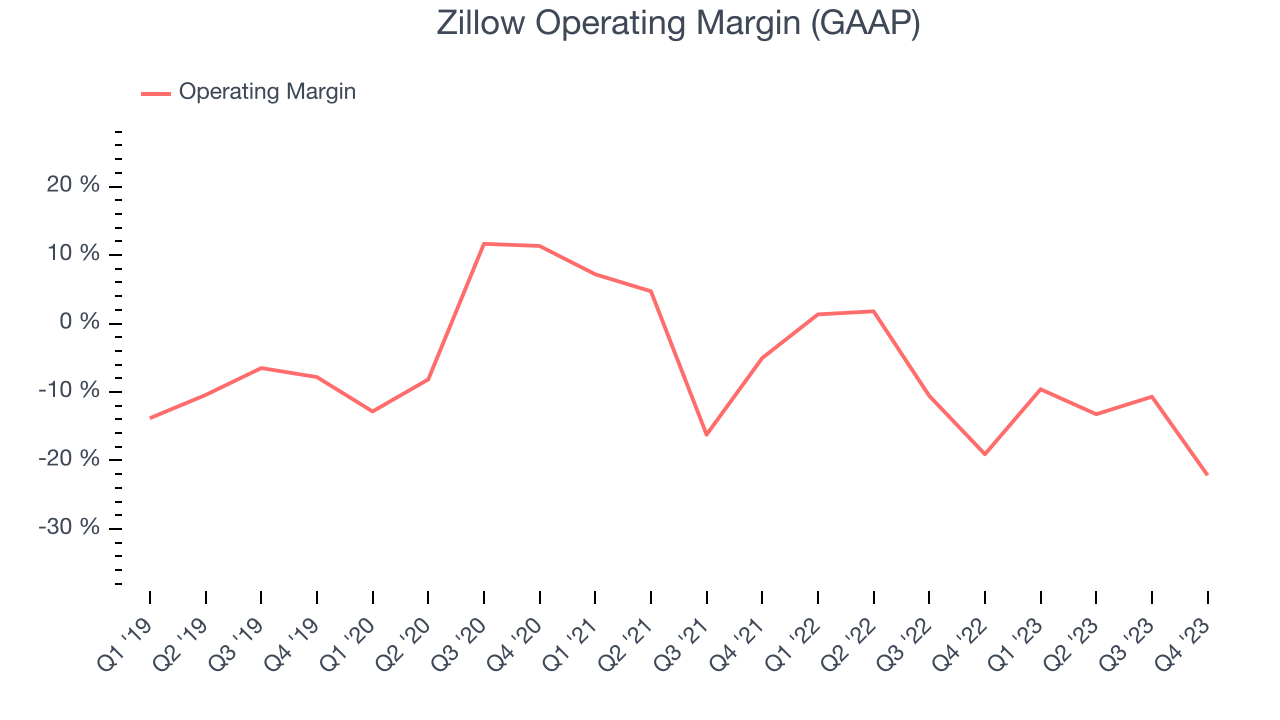
in line with the same quarter last year. This indicates the company's costs have been relatively stable.
EPS
Analyzing long-term revenue trends tells us about a company's historical growth, but the long-term change in its earnings per share (EPS) points to the profitability and efficiency of that growth–for example, a company could inflate its sales through excessive spending on advertising and promotions. 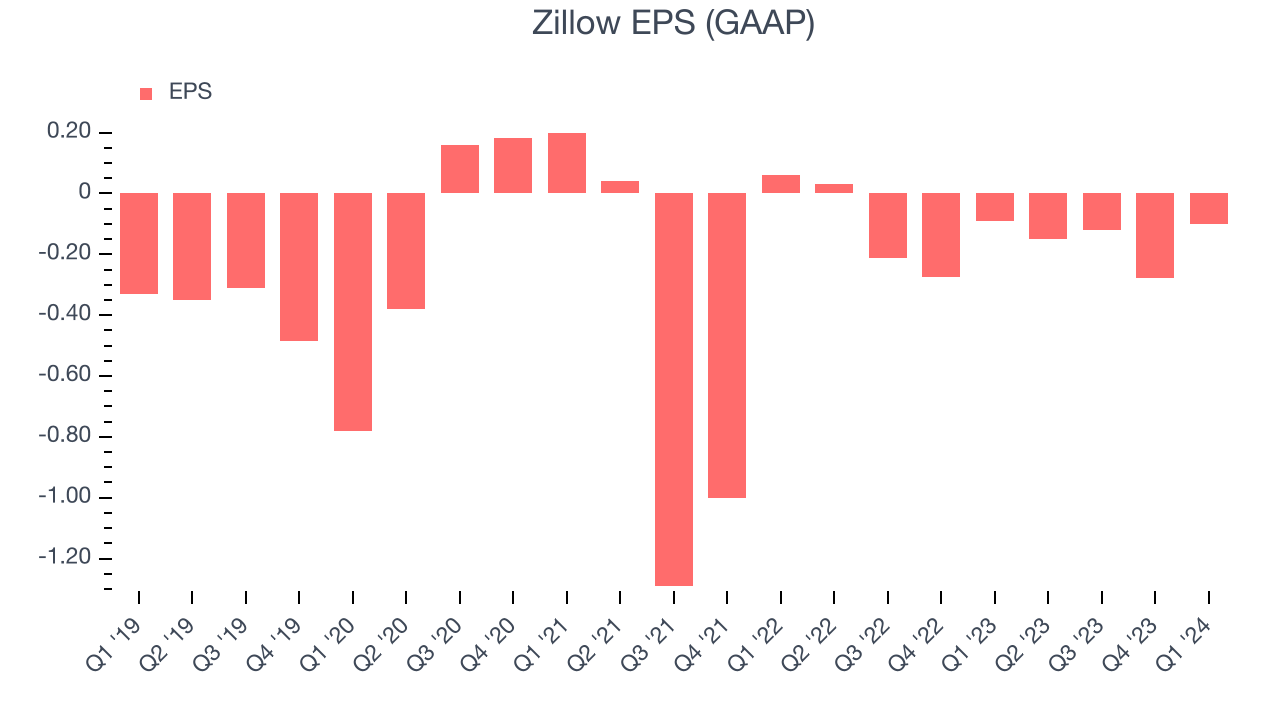
Over the last five years, Zillow cut its earnings losses and improved its EPS by 4.7% each year. Furthermore, this performance is worse than its 6.1% annualized revenue growth over the same period. There are a few reasons for this, and understanding why can shed light on its fundamentals.
A five-year view shows Zillow has diluted its shareholders, growing its share count by 14.8%. This has led to lower per share earnings. Taxes and interest expenses can also affect EPS growth, but they don't tell us as much about a company's fundamentals.In Q1, Zillow reported EPS at negative $0.10, down from negative $0.09 in the same quarter last year. This print unfortunately missed analysts' estimates. Over the next 12 months, Wall Street is optimistic. Analysts are projecting Zillow's LTM EPS of negative $0.65 to reach break even.
Cash Is King
If you've followed StockStory for a while, you know we emphasize free cash flow. Why, you ask? We believe that in the end, cash is king, and you can't use accounting profits to pay the bills.
Over the last two years, Zillow has shown terrific cash profitability, enabling it to reinvest, return capital to investors, and stay ahead of the competition while maintaining a robust cash balance. The company's free cash flow margin has been among the best in the consumer discretionary sector, averaging 29.3%.
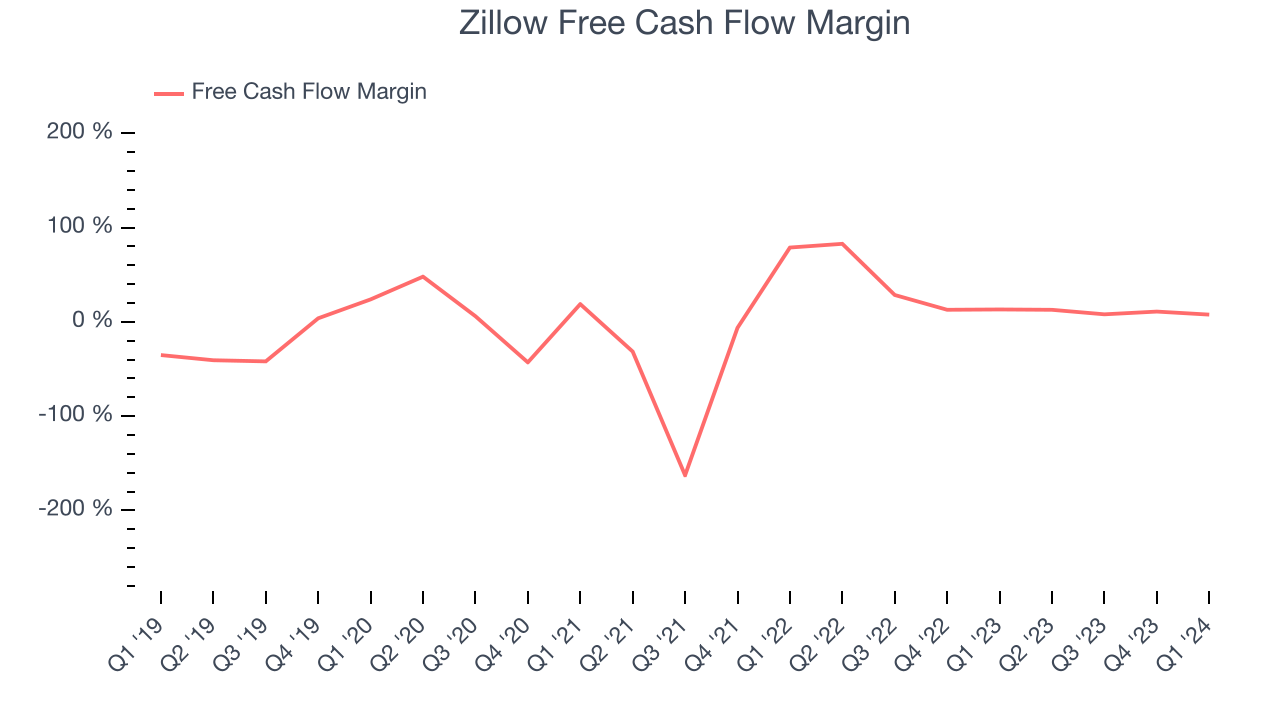
Zillow's free cash flow came in at $41 million in Q1, equivalent to a 7.8% margin and down 33.9% year on year.
Return on Invested Capital (ROIC)
EPS and free cash flow tell us whether a company was profitable while growing revenue. But was it capital-efficient? Enter ROIC, a metric showing how much operating profit a company generates relative to how much money the business raised (debt and equity).
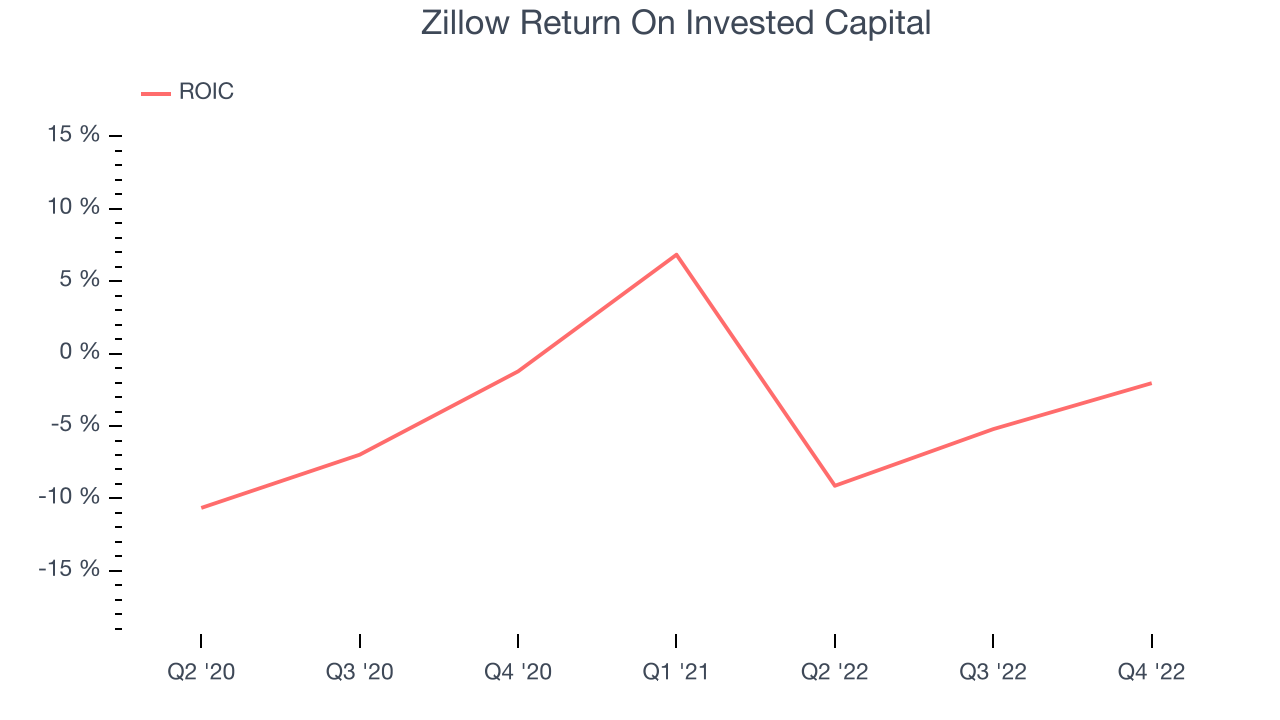
Zillow's five-year average return on invested capital was 6.8%, somewhat low compared to the best consumer discretionary companies that pump out 25%+. Its returns suggest it historically did a subpar job investing in profitable business initiatives.
Balance Sheet Risk
Debt is a tool that can boost company returns but presents risks if used irresponsibly.
Zillow is a well-capitalized company with $2.92 billion of cash and $1.85 billion of debt, meaning it could pay back all its debt tomorrow and still have $1.07 billion of cash on its balance sheet. This net cash position gives Zillow the freedom to raise more debt, return capital to shareholders, or invest in growth initiatives.
Key Takeaways from Zillow's Q1 Results
We enjoyed seeing Zillow exceed analysts' revenue and EBITDA expectations this quarter. On the other hand, its EPS missed and its number of website/mobile app visits fell short of Wall Street's projections. The company did not provide any guidance. Overall, the results could have been better. The company is down 9.1% on the results and currently trades at $37.65 per share.
Is Now The Time?
Zillow may have had a tough quarter, but investors should also consider its valuation and business qualities when assessing the investment opportunity.
We cheer for all companies serving consumers, but in the case of Zillow, we'll be cheering from the sidelines. Its revenue growth has been uninspiring over the last five years, but at least growth is expected to increase in the short term. And while its powerful free cash flow generation enables it to stay ahead of the competition through consistent reinvestment of profits, the downside is its number of monthly active users has been disappointing. On top of that, its operating margins reveal poor profitability compared to other consumer discretionary companies.
Zillow's price-to-earnings ratio based on the next 12 months is 25.3x. While we've no doubt one can find things to like about Zillow, we think there are better opportunities elsewhere in the market. We don't see many reasons to get involved at the moment.
Wall Street analysts covering the company had a one-year price target of $57.67 per share right before these results (compared to the current share price of $37.65).
To get the best start with StockStory, check out our most recent stock picks, and then sign up for our earnings alerts by adding companies to your watchlist here. We typically have the quarterly earnings results analyzed within seconds of the data being released, and especially for companies reporting pre-market, this often gives investors the chance to react to the results before the market has fully absorbed the information.