
Young adult apparel retailer American Eagle Outfitters (NYSE:AEO) reported results in line with analysts' expectations in Q4 FY2023, with revenue up 12.2% year on year to $1.68 billion. It made a non-GAAP profit of $0.61 per share, improving from its profit of $0.37 per share in the same quarter last year.
American Eagle (AEO) Q4 FY2023 Highlights:
- Revenue: $1.68 billion vs analyst estimates of $1.67 billion (small beat)
- EPS (non-GAAP): $0.61 vs analyst estimates of $0.50 (20.9% beat)
- Gross Margin (GAAP): 36.6%, up from 33.9% in the same quarter last year
- Store Locations: 1,182 at quarter end, increasing by 7 over the last 12 months
- Market Capitalization: $4.63 billion
With a heavy focus on denim, American Eagle Outfitters (NYSE:AEO) is a specialty retailer offering an assortment of apparel and accessories to young adults.
In addition to denim in various styles and washes, shoppers can find other casual clothing such as t-shirts, sweatshirts, and dresses. The American Eagle aesthetic is youthful, with a colorful palette. The core customer is the 15 to 25 set (male and female) who favors a relaxed, Americana look. American Eagle’s prices are mid-tier, neither approaching the stratosphere of luxury brands but also not as affordable as fast fashion.
Stores are roughly 6,000 square feet and located in malls or shopping centers along with other retailers. There is usually a male side of the store and a female one, with the center featuring displays of new releases or promoted items. In addition to physical stores, American Eagle has an ecommerce presence that gives customers options such as pure online shopping or buying online and picking up in store.
In addition to the core American Eagle brand, the company also operates Aerie, which offers lingerie, loungewear, and swimwear for women. The company acquired Todd Snyder, a men's fashion brand, in 2021.
Apparel Retailer
Apparel sales are not driven so much by personal needs but by seasons, trends, and innovation, and over the last few decades, the category has shifted meaningfully online. Retailers that once only had brick-and-mortar stores are responding with omnichannel presences. The online shopping experience continues to improve and retail foot traffic in places like shopping malls continues to stall, so the evolution of clothing sellers marches on.
Retailers offering youth-focused apparel and accessories include Abercrombie & Fitch (NYSE:ANF), Urban Outfitters (NASDAQ:URBN), and The Gap (NYSE:GPS).Sales Growth
American Eagle is a mid-sized retailer, which sometimes brings disadvantages compared to larger competitors benefiting from better economies of scale. On the other hand, it has an edge over smaller competitors with fewer resources and can still flex high growth rates because it's growing off a smaller base than its larger counterparts.
As you can see below, the company's annualized revenue growth rate of 5.1% over the last four years (we compare to 2019 to normalize for COVID-19 impacts) was weak , but to its credit, it opened new stores and expanded its reach.
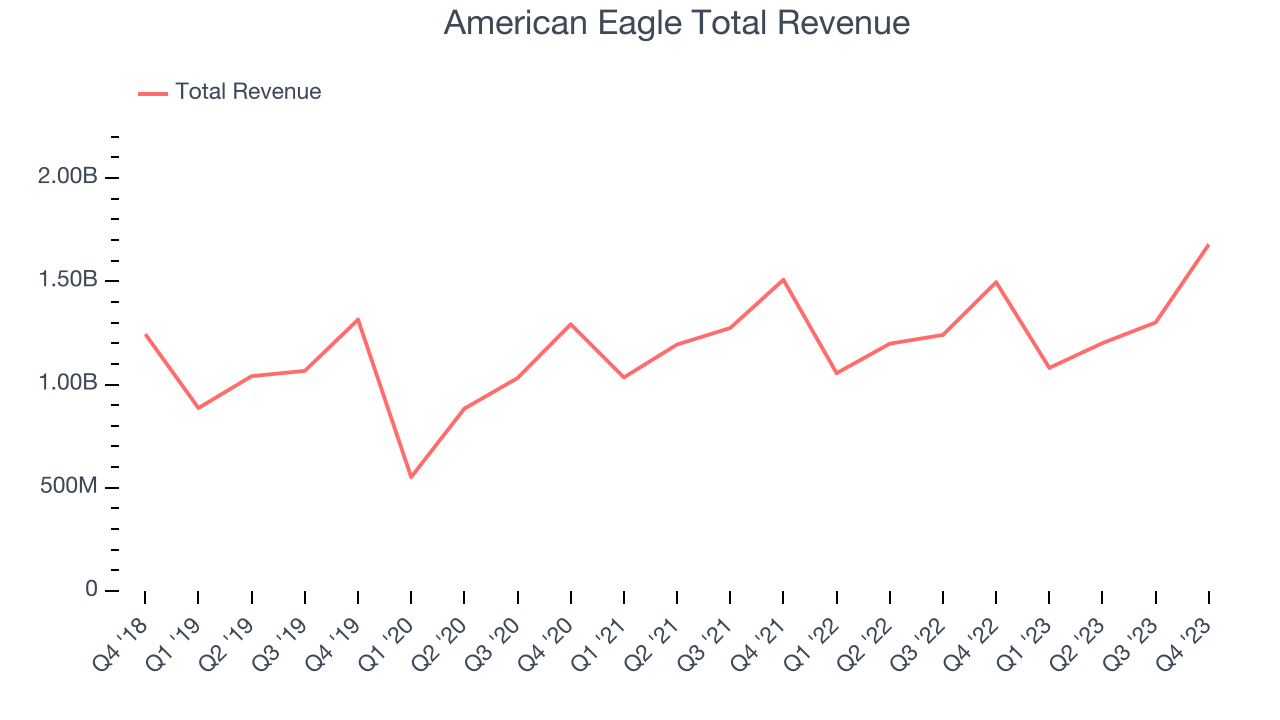
This quarter, American Eagle's year-on-year revenue growth clocked in at 12.2%, and its $1.68 billion in revenue was in line with Wall Street's estimates. Looking ahead, Wall Street expects sales to grow 2.4% over the next 12 months, a deceleration from this quarter.
Number of Stores
The number of stores a retailer operates is a major determinant of how much it can sell, and its growth is a critical driver of how quickly company-level sales can grow.
When a retailer like American Eagle is opening new stores, it usually means it's investing for growth because demand is greater than supply. At the end of this quarter, American Eagle operated 1,182 total retail locations, in line with its store count 12 months ago.
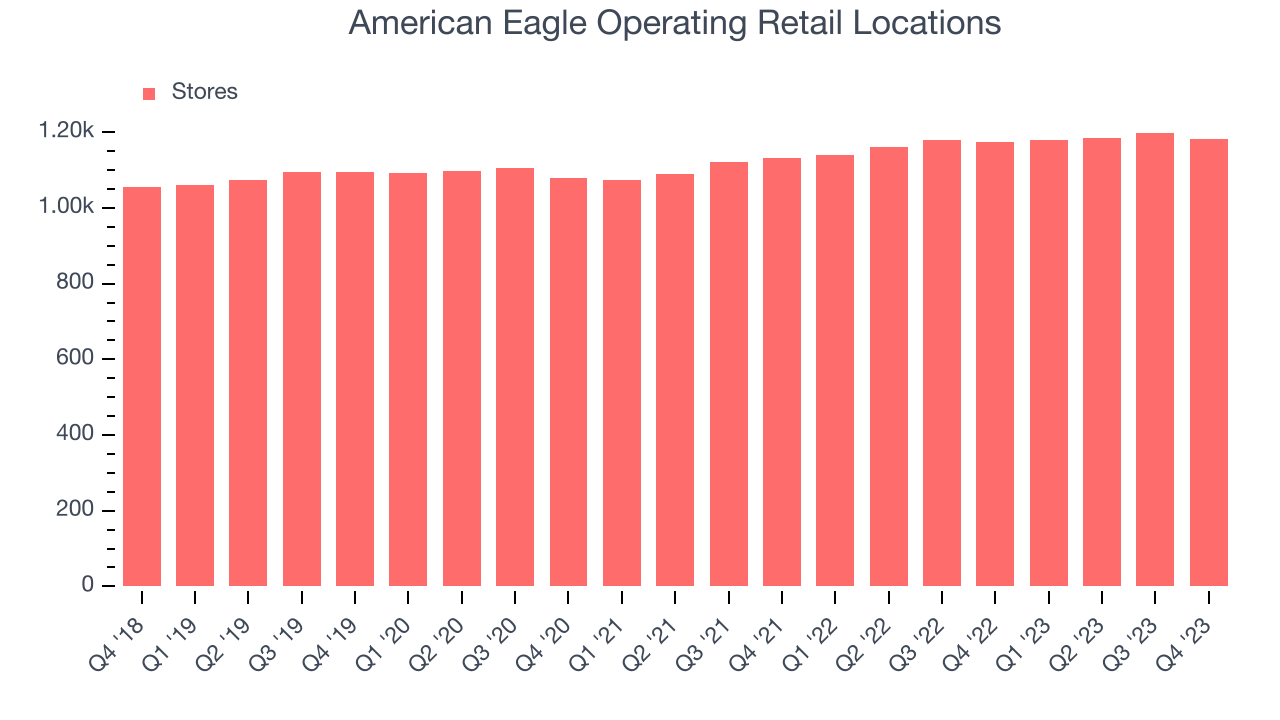
Taking a step back, the company has generally opened new stores over the last eight quarters, averaging 3.7% annual growth in its physical footprint. This is decent store growth and in line with other retailers. With an expanding store base and demand, revenue growth can come from multiple vectors: sales from new stores, sales from e-commerce, or increased foot traffic and higher sales per customer at existing stores.
Same-Store Sales
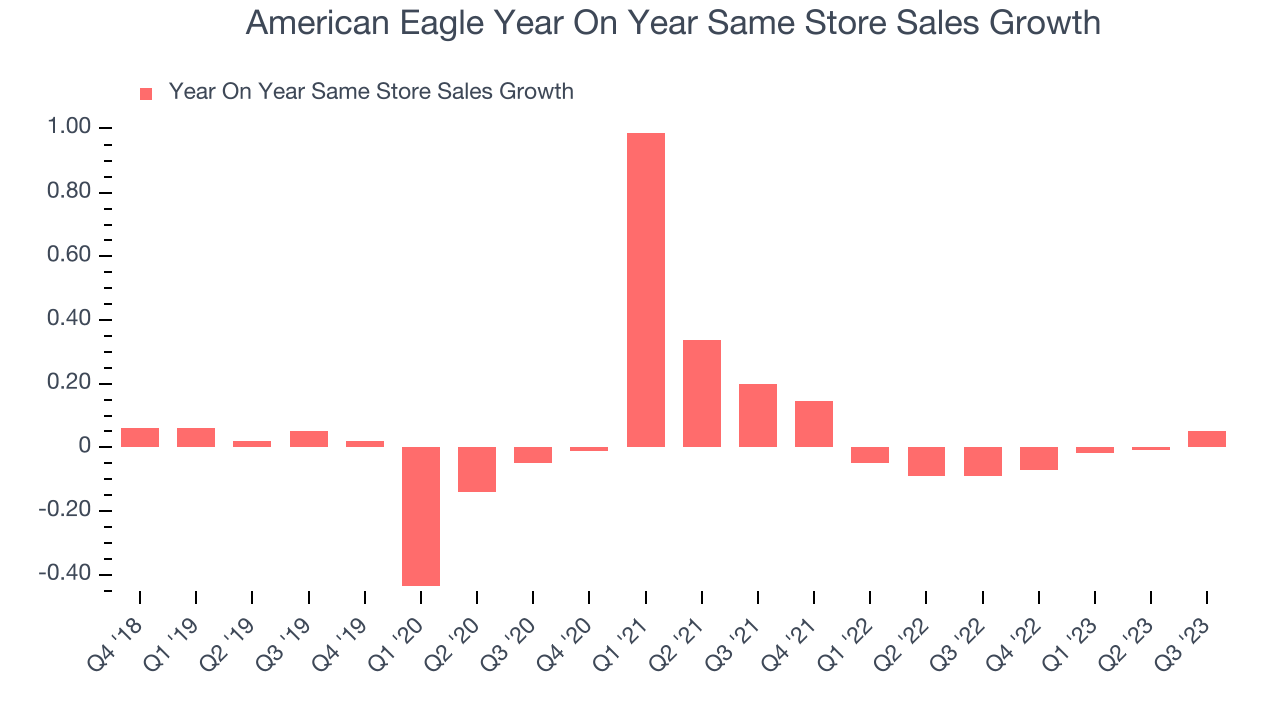
A company's same-store sales growth shows the year-on-year change in sales for its brick-and-mortar stores that have been open for at least a year, give or take, and e-commerce platform. This is a key performance indicator for retailers because it measures organic growth and demand.
American Eagle's demand has been shrinking over the last eight quarters, and on average, its same-store sales have declined by 3.9% year on year. This performance is quite concerning and the company should reconsider its strategy before investing its precious capital into new store buildouts.
Gross Margin & Pricing Power
Gross profit margins tell us how much money a retailer gets to keep after paying for the goods it sells.
American Eagle's unit economics are higher than the typical retailer, giving it the flexibility to invest in areas such as marketing and talent to reach more consumers. As you can see below, it's averaged a decent 36.8% gross margin over the last eight quarters. This means the company makes $0.37 for every $1 in revenue before accounting for its operating expenses.
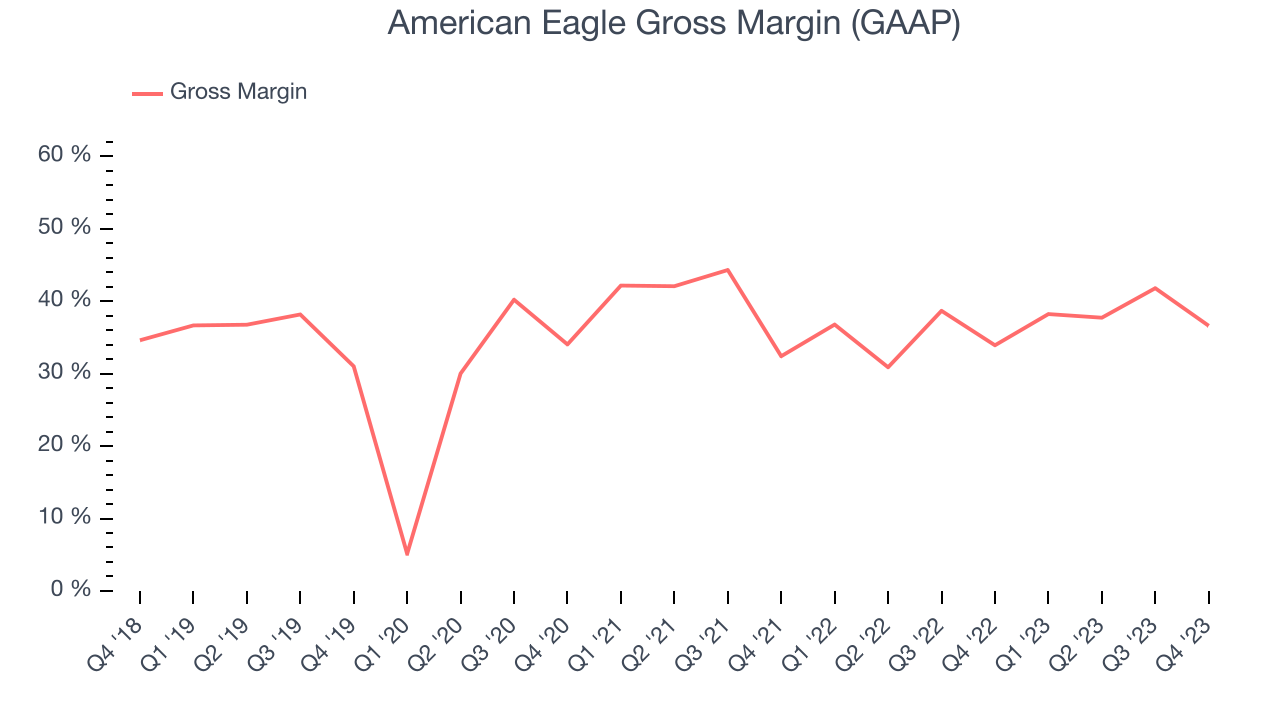
American Eagle's gross profit margin came in at 36.6% this quarter, marking a 2.7 percentage point increase from 33.9% in the same quarter last year. This margin expansion is a good sign in the near term. If this trend continues, it could signal a less competitive environment where the company has better pricing power, less pressure to discount products, and more stable input costs (such as distribution expenses to move goods).
Operating Margin
Operating margin is an important measure of profitability for retailers as it accounts for all expenses keeping the lights on, including wages, rent, advertising, and other administrative costs.
In Q4, American Eagle generated an operating profit margin of 0.6%, down 4.4 percentage points year on year. Conversely, the company's gross margin actually increased, so we can assume the reduction was driven by weaker cost controls or operating leverage on fixed costs.
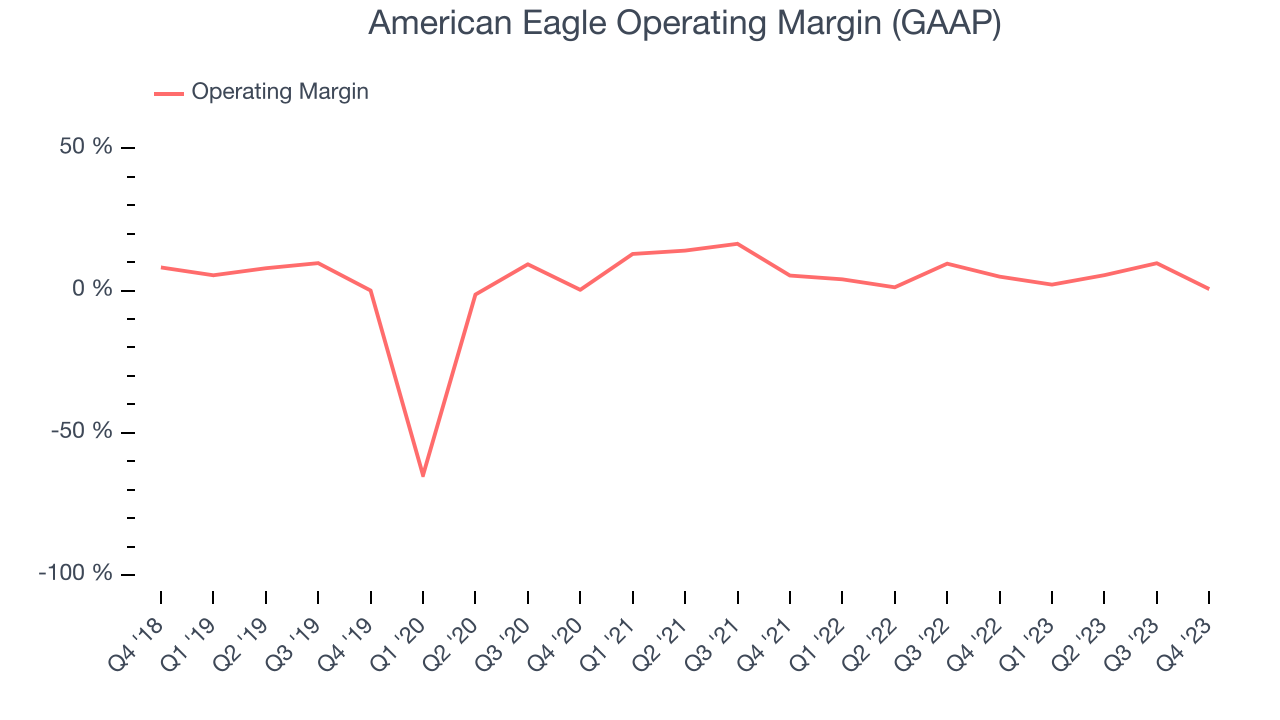 Zooming out, American Eagle was profitable over the last eight quarters but held back by its large expense base. It's demonstrated subpar profitability for a consumer retail business, producing an average operating margin of 4.6%. Its margin has also seen few fluctuations, meaning it will take a big change to improve profitability.
EPS
These days, some companies issue new shares like there's no tomorrow. That's why we like to track earnings per share (EPS) because it accounts for shareholder dilution and share buybacks.
In Q4, American Eagle reported EPS at $0.61, up from $0.37 in the same quarter a year ago. This print beat Wall Street's estimates by 20.9%.
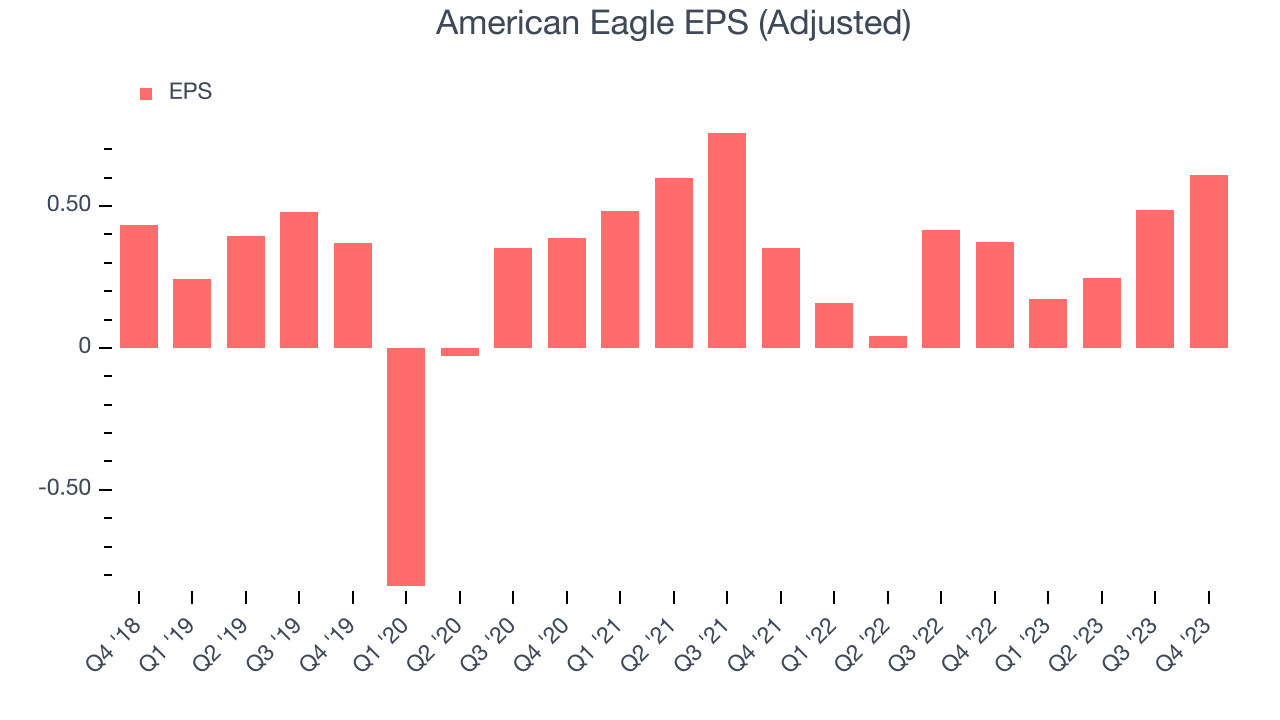
Between FY2019 and FY2023, American Eagle's adjusted diluted EPS grew 2%, translating into a weak 0.5% compounded annual growth rate.
On the bright side, Wall Street expects the company to continue growing earnings over the next 12 months, with analysts projecting an average 6.7% year-on-year increase in EPS.
Return on Invested Capital (ROIC)
EPS and free cash flow tell us whether a company was profitable while growing revenue. But was it capital-efficient? Enter ROIC, a metric showing how much operating profit a company generates relative to how much money the business raised (debt and equity).
American Eagle's five-year average ROIC was 3.8%, somewhat low compared to the best retail companies that consistently pump out 25%+. Its returns suggest it historically did a subpar job investing in profitable business initiatives.
The trend in its ROIC, however, is often what surprises the market and drives the stock price. Over the last two years, American Eagle's ROIC averaged 12.1 percentage point increases each year. This is a good sign and we hope the company can continue to improving.
Key Takeaways from American Eagle's Q4 Results
We enjoyed seeing American Eagle exceed analysts' revenue and EPS expectations this quarter. Outperformance was driven by its Aerie brand, which saw same-store sales growth of 13% compared to 6% for the flagship American Eagle brand, which is still good.
Looking ahead, management expects revenue to rise by 3% in the full year 2024, falling short of analysts' estimates. However, its forecasted full-year operating income of $455 million easily cleared analysts' expectations of $362 million.
Overall, this quarter's results seemed fairly positive and shareholders should feel optimistic. The stock is up 12.1% after reporting and currently trades at $26.3 per share.
Is Now The Time?
American Eagle may have had a favorable quarter, but investors should also consider its valuation and business qualities when assessing the investment opportunity.
We cheer for all companies serving consumers, but in the case of American Eagle, we'll be cheering from the sidelines. Its revenue growth has been a little slower over the last four years, and analysts expect growth to deteriorate from here. And while its projected EPS for the next year implies the company will generate shareholder value, the downside is its relatively low ROIC suggests it has struggled to grow profits historically. On top of that, its shrinking same-store sales suggests it'll need to change its strategy to succeed.
American Eagle's price-to-earnings ratio based on the next 12 months is 14.5x. While we've no doubt one can find things to like about American Eagle, we think there are better opportunities elsewhere in the market. We don't see many reasons to get involved at the moment.
Wall Street analysts covering the company had a one-year price target of $23.03 per share right before these results (compared to the current share price of $26.30), implying they didn't see much short-term potential in American Eagle.
To get the best start with StockStory, check out our most recent stock picks, and then sign up to our earnings alerts by adding companies to your watchlist here. We typically have the quarterly earnings results analyzed within seconds of the data being released, and especially for companies reporting pre-market, this often gives investors the chance to react to the results before the market has fully absorbed the information.