Electronic gaming manufacturer and supplier PlayAGS (NYSE:AGS) reported results ahead of analysts' expectations in Q4 FY2023, with revenue up 15.2% year on year to $94.15 million. It made a GAAP loss of $0 per share, down from its profit of $0.06 per share in the same quarter last year.
PlayAGS (AGS) Q4 FY2023 Highlights:
- Revenue: $94.15 million vs analyst estimates of $92.58 million (1.7% beat)
- Adjusted EBITDA: $42.8 million vs analyst estimates of $41.6 million (3.0% beat)
- EPS: $0 vs analyst estimates of $0.05 (-$0.05 miss)
- Free Cash Flow of $11.02 million, down 44.2% from the previous quarter
- Gross Margin (GAAP): 68.9%, down from 72.4% in the same quarter last year
- Market Capitalization: $348.8 million
Originating as a small slot machine business, PlayAGS (NYSE:AGS) provides electronic gaming machines, table game products, and digital gaming solutions to the casino and gaming industry.
PlayAGS was established to supply electronic gaming machines to Native American casinos. As the industry grew, PlayAGS expanded its vision, broadening its range to include a variety of gaming and entertainment solutions.
Today, PlayAGS's portfolio includes not only electronic gaming machines but also table games and digital games (iGaming). To ensure its games remain relevant on casino floors, the company invests in gaming studios and research and development to produce new content.
PlayAGS generates revenue primarily through the one-off sales of equipment, leasing of equipment, and iGaming fees. Its leased games are sold on revenue share agreements, and casino customers are free to place the machines wherever they'd like on the casino floor. Casinos can remove the games if they underperform, and to mitigate this risk, the company will occasionally pay placement fees to guarantee a spot on the floor for a designated period, typically a few years.
Casinos and Gaming
Casino and gaming companies that offer slot machines, Texas Hold ‘Em, Blackjack and the like can enjoy limited competition because gambling is a highly regulated industry. These companies can also enjoy healthy margins and profits-have you ever heard the phrase ‘the house always wins’? Regulation cuts both ways, however, and casino and gaming companies may face stroke-of-the-pen risk that suddenly limits what they do or where they can do it. Furthermore, digitization is changing the game, pun intended. Whether it’s online poker or sports betting on your smartphone, innovation is forcing casino and gaming companies to adapt to keep up with changing consumer preferences such as being able to wager anywhere on demand.
Competitors in the gaming technology and equipment sector include Everi Holdings (NYSE:EVRI), Light & Wonder (NASDAQ:LNW), and Inspired Entertainment (NASDAQ:INSE).Sales Growth
Reviewing a company's long-term performance can reveal insights into its business quality. Any business can have short-term success, but a top-tier one sustains growth for years. PlayAGS's annualized revenue growth rate of 4.5% over the last five years was weak for a consumer discretionary business. 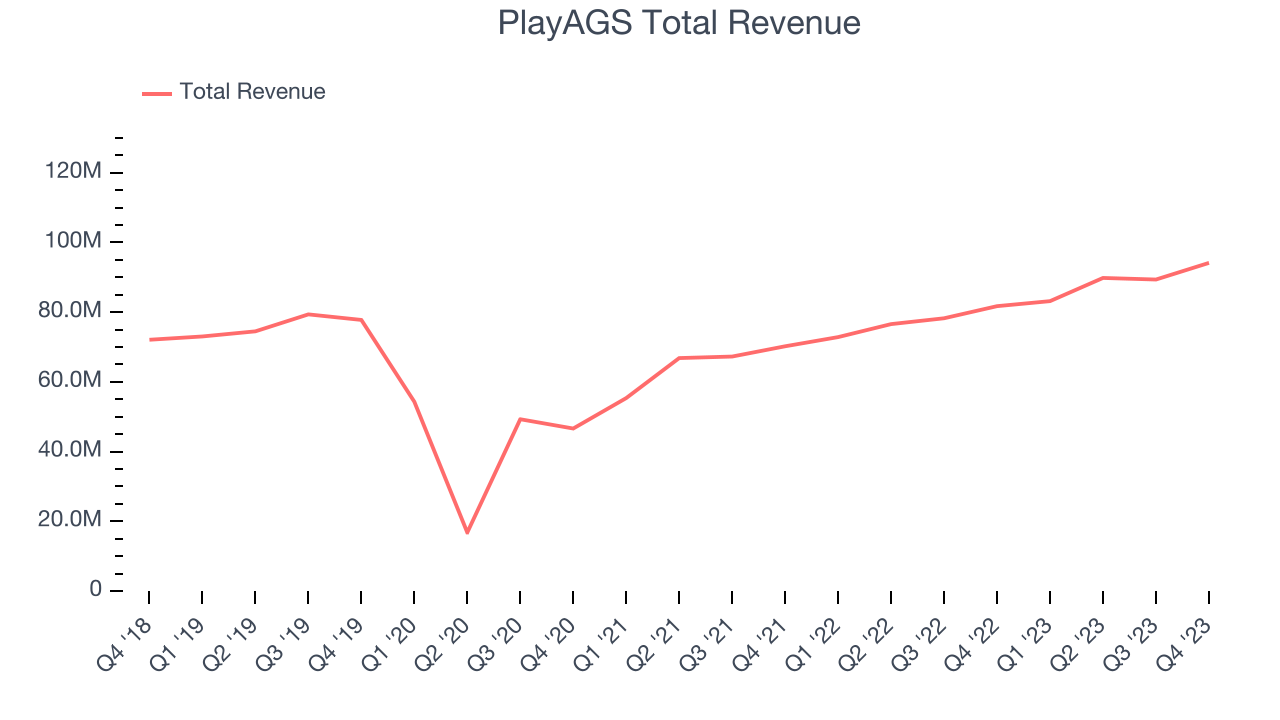 Within consumer discretionary, a long-term historical view may miss a company riding a successful new product or emerging trend. That's why we also follow short-term performance. PlayAGS's annualized revenue growth of 17.2% over the last two years is above its five-year trend, suggesting some bright spots.
This quarter, PlayAGS reported robust year-on-year revenue growth of 15.2%, and its $94.15 million of revenue exceeded Wall Street's estimates by 1.7%. Looking ahead, Wall Street expects sales to grow 2.5% over the next 12 months, a deceleration from this quarter.
Operating Margin
Operating margin is an important measure of profitability. It’s the portion of revenue left after accounting for all core expenses–everything from the cost of goods sold to advertising and wages. Operating margin is also useful for comparing profitability across companies with different levels of debt and tax rates because it excludes interest and taxes.
PlayAGS has managed its expenses well over the last two years. It's demonstrated solid profitability for a consumer discretionary business, producing an average operating margin of 14.7%.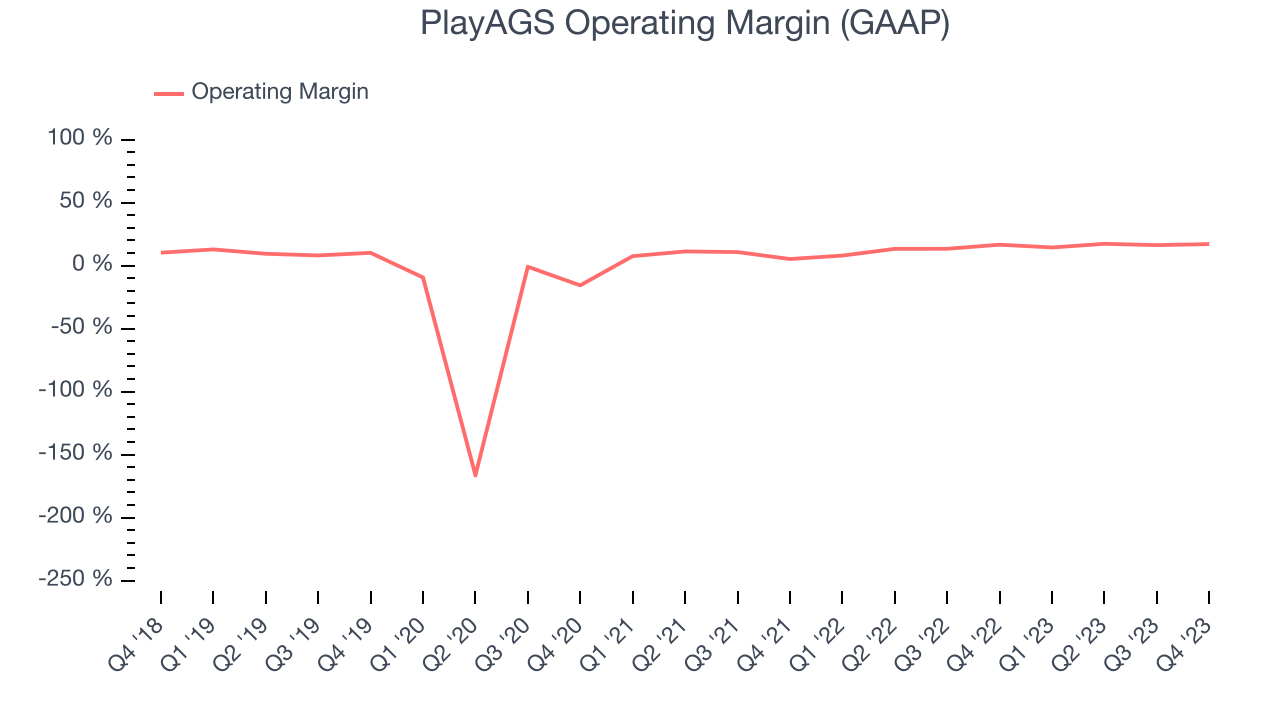
This quarter, PlayAGS generated an operating profit margin of 17%, in line with the same quarter last year. This indicates the company's costs have been relatively stable.
Over the next 12 months, Wall Street expects PlayAGS to become more profitable. Analysts are expecting the company’s LTM operating margin of 16.3% to rise to 17.4%.EPS
We track long-term historical earnings per share (EPS) growth for the same reason as long-term revenue growth. Compared to revenue, however, EPS highlights whether a company's growth was profitable. 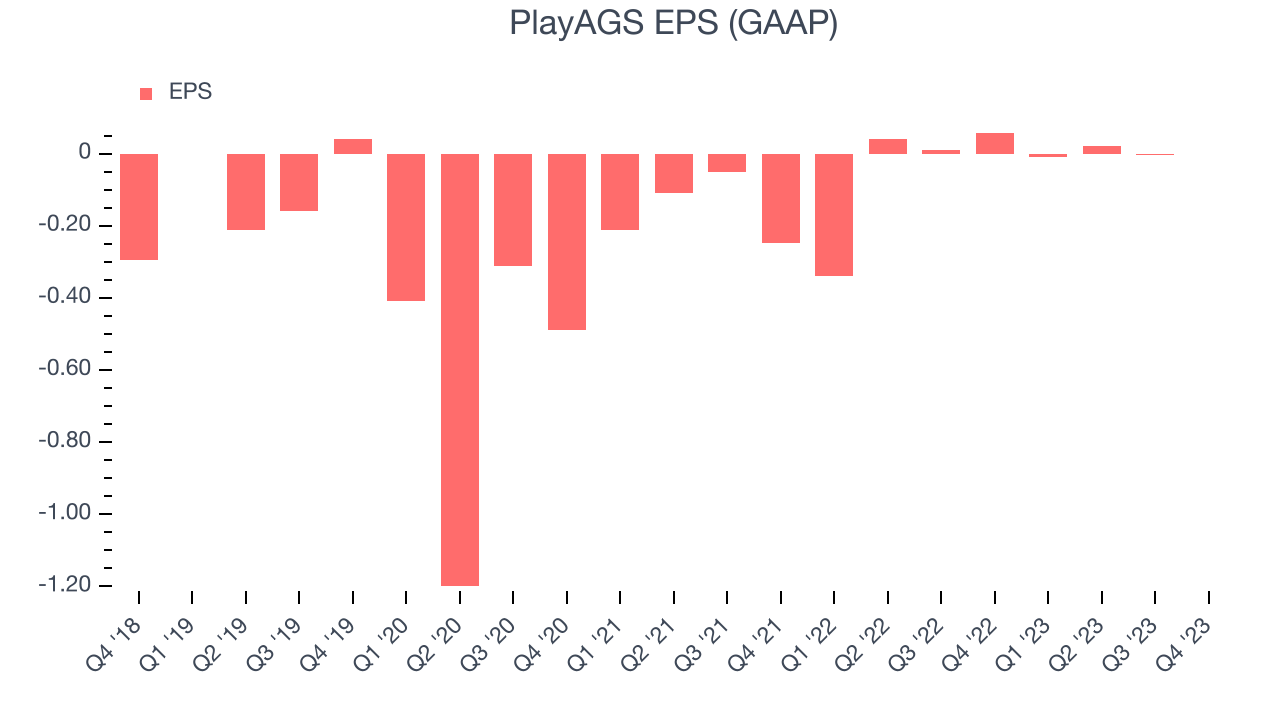
Over the last five years, PlayAGS cut its earnings losses and improved its EPS by 52.8% each year. This performance is materially higher than its 4.5% annualized revenue growth over the same period. There are a few reasons for this, and understanding why can shed light on its fundamentals.
While we mentioned earlier that PlayAGS's operating margin was flat this quarter, a five-year view shows its margin has expanded 6.8 percentage points, leading to higher profitability and earnings. Taxes and interest expenses can also affect EPS growth, but they don't tell us as much about a company's fundamentals.In Q4, PlayAGS reported EPS at $0, down from $0.06 in the same quarter a year ago. This print unfortunately missed analysts' estimates, but we care more about long-term EPS growth rather than short-term movements. Over the next 12 months, Wall Street expects PlayAGS to grow its earnings. Analysts are projecting its LTM EPS of $0.01 to climb by 5,693% to $0.34.
Cash Is King
Although earnings are undoubtedly valuable for assessing company performance, we believe cash is king because you can't use accounting profits to pay the bills.
Over the last two years, PlayAGS has shown decent cash profitability, giving it some reinvestment opportunities. The company's free cash flow margin has averaged 10.1%, slightly better than the broader consumer discretionary sector.
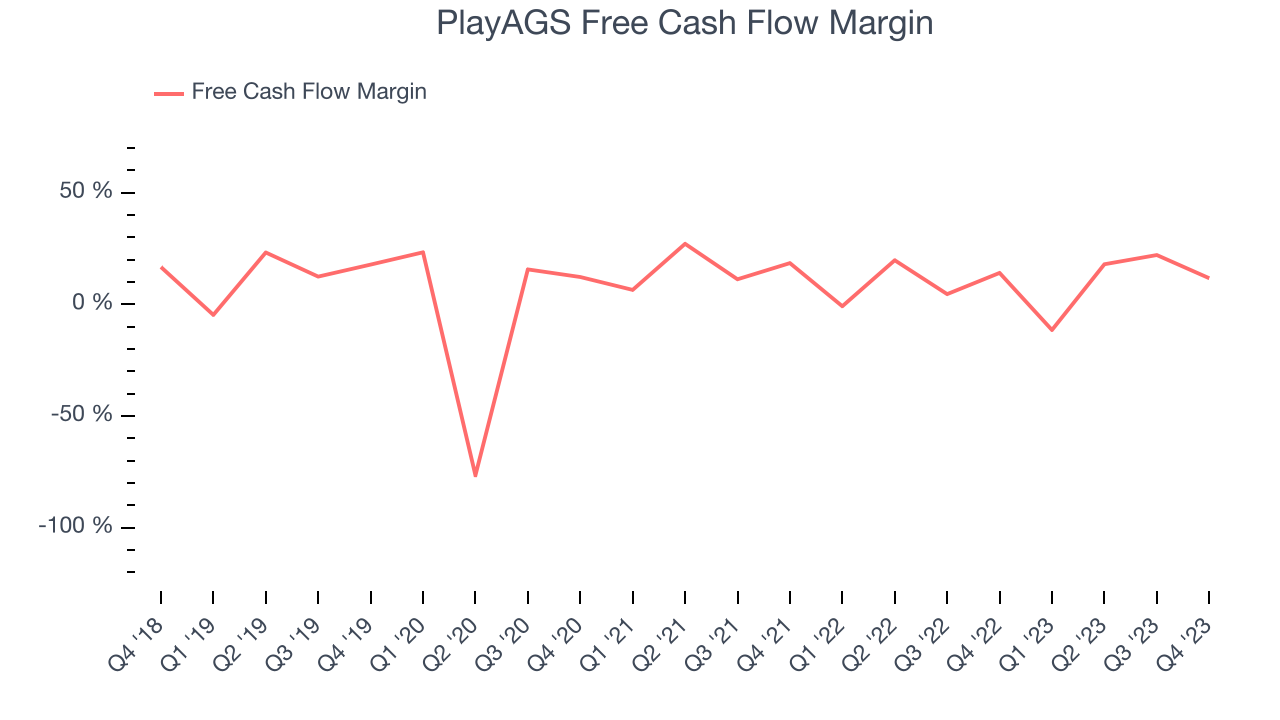
PlayAGS's free cash flow came in at $11.02 million in Q4, equivalent to a 11.7% margin and in line with the same quarter last year. Over the next year, analysts predict PlayAGS's cash profitability will fall. Their consensus estimates imply its LTM free cash flow margin of 10.5% will decrease to 8.5%.
Return on Invested Capital (ROIC)
EPS and free cash flow tell us whether a company was profitable while growing revenue. But was it capital-efficient? A company’s ROIC explains this by showing how much operating profit a company makes compared to how much money the business raised (debt and equity).
PlayAGS's five-year average return on invested capital was 4.4%, somewhat low compared to the best consumer discretionary companies that pump out 25%+. Its returns suggest it historically did a subpar job investing in profitable business initiatives.
The trend in its ROIC, however, is often what surprises the market and drives the stock price. Over the last two years, PlayAGS's ROIC averaged 9.1 percentage point increases each year. This is a good sign and we hope the company can continue to improving.
Key Takeaways from PlayAGS's Q4 Results
It was good to see PlayAGS beat analysts' revenue and adjusted EBITDA expectations this quarter. The company's net leverage also declined to 3.2x at the end of the quarter, getting closer to the target range of 2.75x to 3.00x. Forward guidance was not given in the earnings release. Overall, this was a solid quarter, and the stock is up 2.3% after reporting and currently trades at $9.42 per share.
Is Now The Time?
PlayAGS may have had a tough quarter, but investors should also consider its valuation and business qualities when assessing the investment opportunity.
We cheer for all companies serving consumers, but in the case of PlayAGS, we'll be cheering from the sidelines. Its revenue growth has been uninspiring over the last five years, and analysts expect growth to deteriorate from here. And while its projected EPS for the next year implies the company's fundamentals will improve, unfortunately, its relatively low ROIC suggests it has historically struggled to find compelling business opportunities.
While the price is reasonable and there are some things to like about PlayAGS, we think there are better opportunities elsewhere in the market right now.
Wall Street analysts covering the company had a one-year price target of $12.20 per share right before these results (compared to the current share price of $9.42).
To get the best start with StockStory, check out our most recent stock picks, and then sign up for our earnings alerts by adding companies to your watchlist here. We typically have the quarterly earnings results analyzed within seconds of the data being released, and especially for companies reporting pre-market, this often gives investors the chance to react to the results before the market has fully absorbed the information.