Pet products provider Bark (NYSE:BARK) beat analysts' expectations in Q3 FY2024, with revenue down 6.9% year on year to $125.1 million. The company also expects next quarter's revenue to be around $121.1 million, slightly above analysts' estimates. It made a non-GAAP loss of $0.05 per share, improving from its loss of $0.09 per share in the same quarter last year.
Bark (BARK) Q3 FY2024 Highlights:
- Revenue: $125.1 million vs analyst estimates of $123.3 million (1.4% beat)
- EPS (non-GAAP): -$0.05, in line with analyst estimates
- Revenue Guidance for Q4 2024 is $121.1 million at the midpoint, above analyst estimates of $119.9 million
- Free Cash Flow of $13.26 million, up from $864,000 in the previous quarter
- Gross Margin (GAAP): 61.8%, up from 59.7% in the same quarter last year
- Market Capitalization: $164.4 million
Making a name for itself with the BarkBox, Bark (NYSE:BARK) specializes in subscription-based, personalized pet products.
The company's journey started with a vision: to fill a gap in the market for high-quality, engaging, and personalized pet care items. This concept quickly gained traction during COVID-19, leading to its June 2021 SPAC debut.
Bark's primary offerings include subscription-based bundles such as BarkBox and Bark Super Chewer, which contain a customized selection of toys, treats, and chews. These bundles can be purchased online and scheduled for home delivery. Additionally, Bark sells pet food and dental products, and its goods can also be found at retailers like Target.
Bark’s customers are affectionate pet owners who prioritize their pets' happiness and well-being. The company's revenue is primarily derived from subscription services, supplemented by direct sales of individual products. Maintaining its subscription revenue base is key to its success.
Other Specialty Retail
Some consumer discretionary companies don’t fall neatly into a category because their products or services are unique. Although their offerings may be niche, these companies have often found more efficient or technology-enabled ways of doing or selling something that has existed for a while. Those that differentiate themselves and serve consumers well will enjoy brand equity, customer loyalty, and even some pricing power while those who don’t may find themselves in precarious positions due to the discretionary nature of their offerings.
Competitors operating in the pet care and products industry include Chewy (NYSE:CHWY), Petco (NASDAQ:WOOF), and Amazon (NASDAQ:AMZN).Sales Growth
Exploring a company's long-term performance can offer valuable insights into its business quality. Any business can experience brief periods of success, but distinguished ones maintain steady growth over time. Bark's annualized revenue growth rate of 22.9% over the last 4 years was exceptional for a consumer discretionary business. 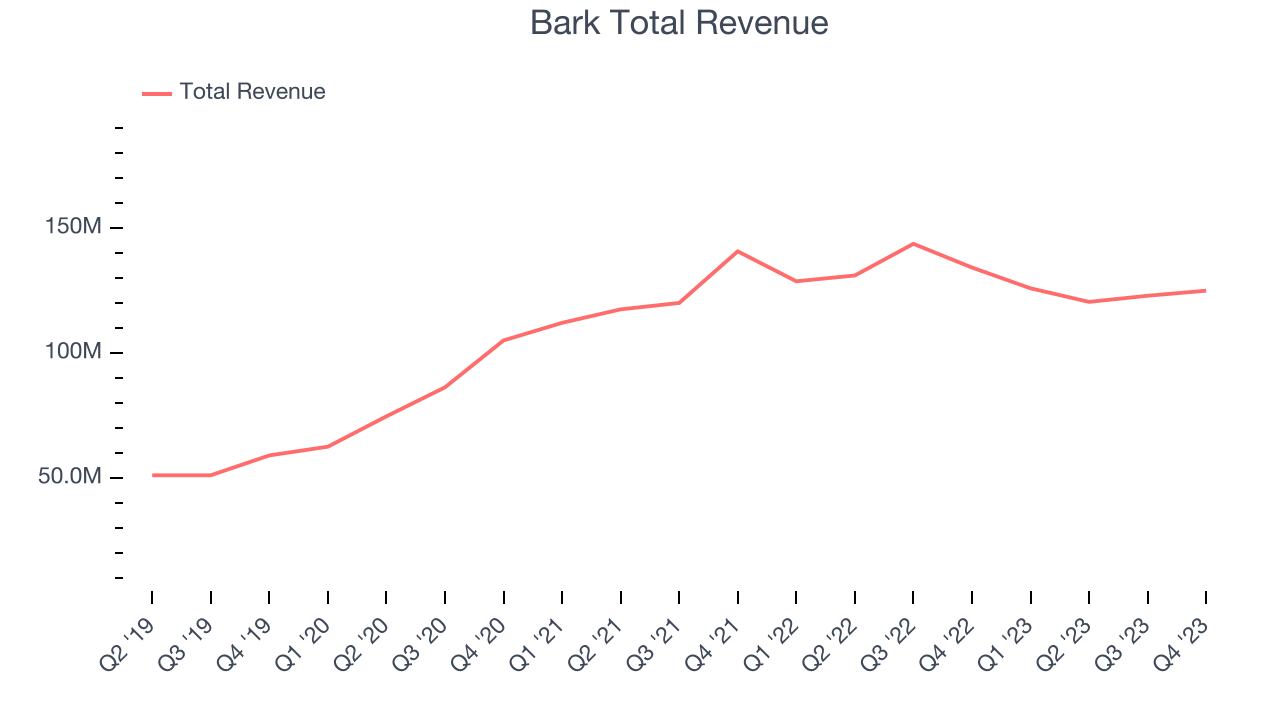 Within consumer discretionary, a long-term historical view may miss a company riding a successful new product or emerging trend. That's why we also follow short-term performance. Bark's recent history shines a dimmer light on the company, as its revenue was flat over the last 2 years.
This quarter, Bark's revenue fell 6.9% year on year to $125.1 million but beat Wall Street's estimates by 1.4%. The company is guiding for a 3.9% year-on-year revenue decline next quarter to $121.1 million, a deceleration from the 2.2% year-on-year decrease it recorded in the same quarter last year. Looking ahead, Wall Street expects revenue to remain flat over the next 12 months.
Operating Margin
Operating margin is an important measure of profitability. It’s the portion of revenue left after accounting for all core expenses–everything from the cost of goods sold to advertising and wages. Operating margin is also useful for comparing profitability across companies with different levels of debt and tax rates because it excludes interest and taxes.
Given the consumer discretionary industry's volatile demand characteristics, unprofitable companies should be scrutinized. Over the last two years, Bark's high expenses have contributed to an average operating margin of negative 13.4%.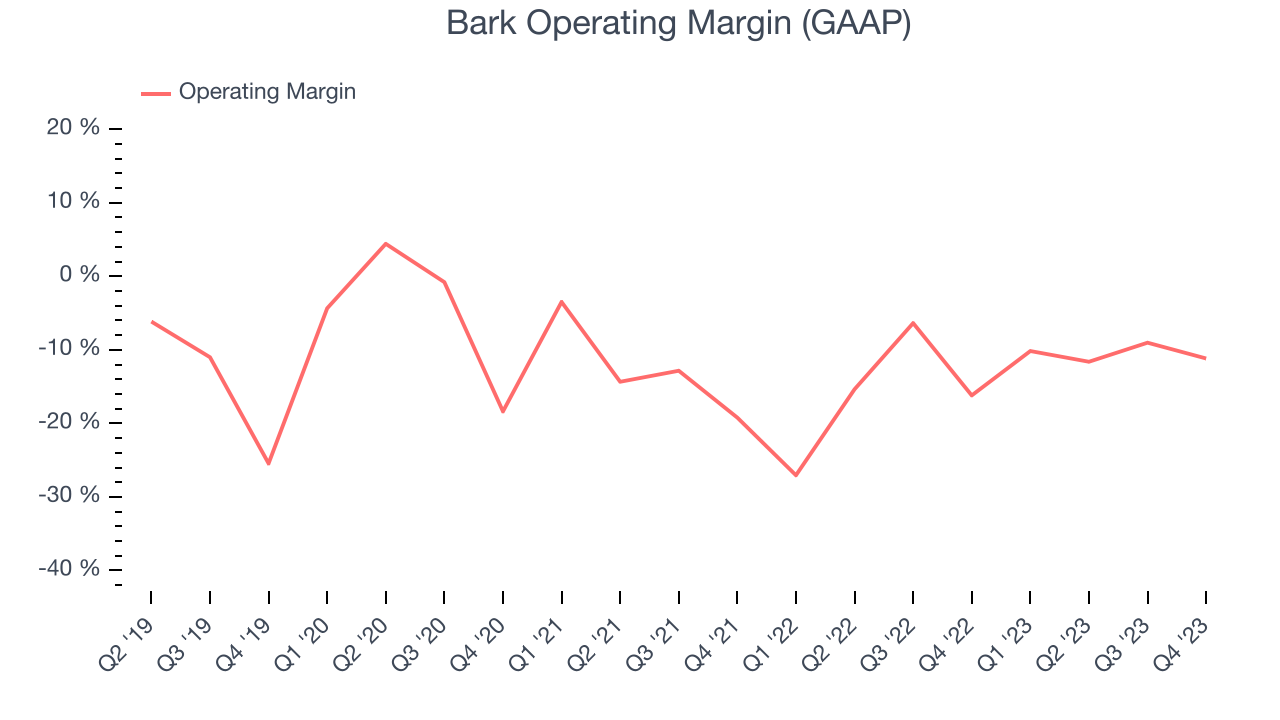
This quarter, Bark generated an operating profit margin of negative 11.2%, up 5 percentage points year on year. This increase indicates the company was more efficient with its expenses over the last quarter, spending less money in areas like corporate overhead and advertising.
EPS
We track long-term historical earnings per share (EPS) growth for the same reason as long-term revenue growth. Compared to revenue, however, EPS highlights whether a company's growth was profitable. 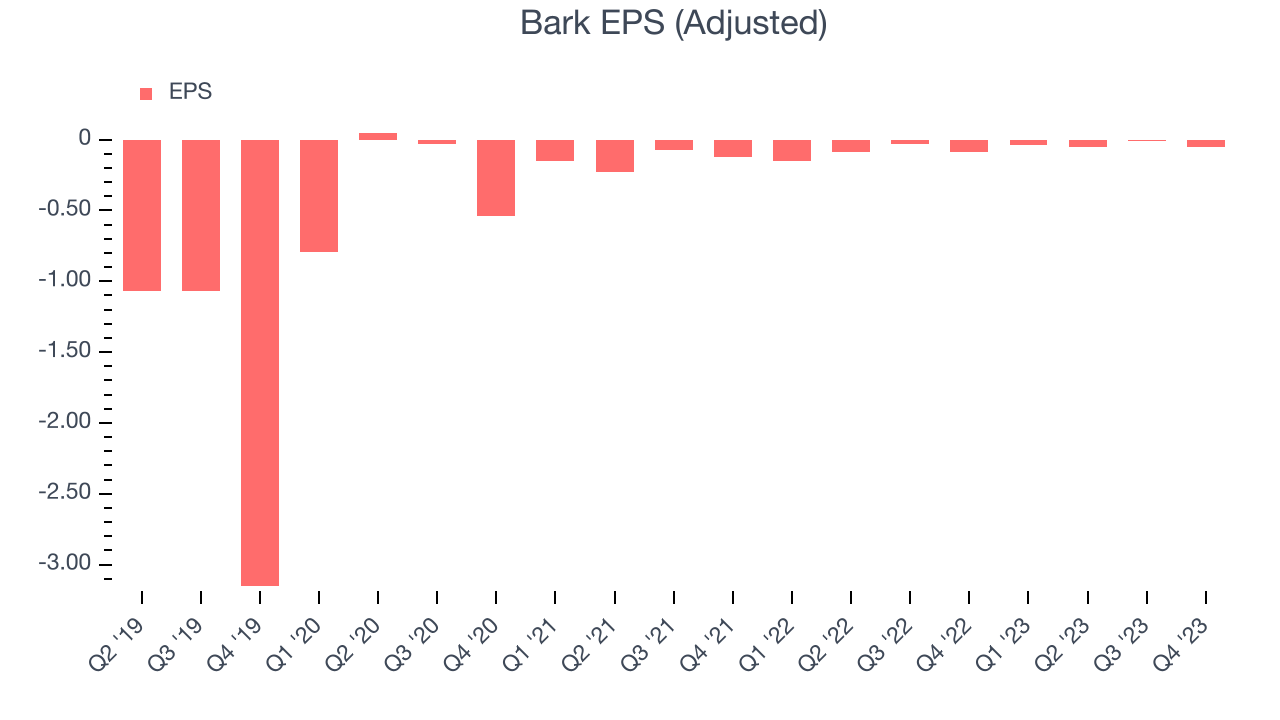
Over the last 4 years, Bark cut its earnings losses and improved its EPS by 55.3% on average each year. This performance is materially higher than its 22.9% annualized revenue growth over the same period. There are a few reasons for this, and understanding why can shed light on its fundamentals.
Bark's operating margin has expanded 14.3 percentage points over the last 4 years, leading to higher profitability and earnings. Taxes and interest expenses can also affect EPS growth, but they don't tell us as much about a company's fundamentals.In Q3, Bark reported EPS at negative $0.05, up from negative $0.09 in the same quarter a year ago. This print unfortunately missed analysts' estimates, but we care more about long-term EPS growth rather than short-term movements. Over the next 12 months, Wall Street expects Bark to improve its earnings losses. Analysts are projecting its LTM EPS of negative $0.15 to advance to negative $0.02.
Cash Is King
Although earnings are undoubtedly valuable for assessing company performance, we believe cash is king because you can't use accounting profits to pay the bills.
While Bark posted positive free cash flow this quarter, the broader story hasn't been so clean. Over the last two years, Bark's demanding reinvestments to stay relevant with consumers have drained company resources. Its free cash flow margin has been among the worst in the consumer discretionary sector, averaging negative 4.3%.
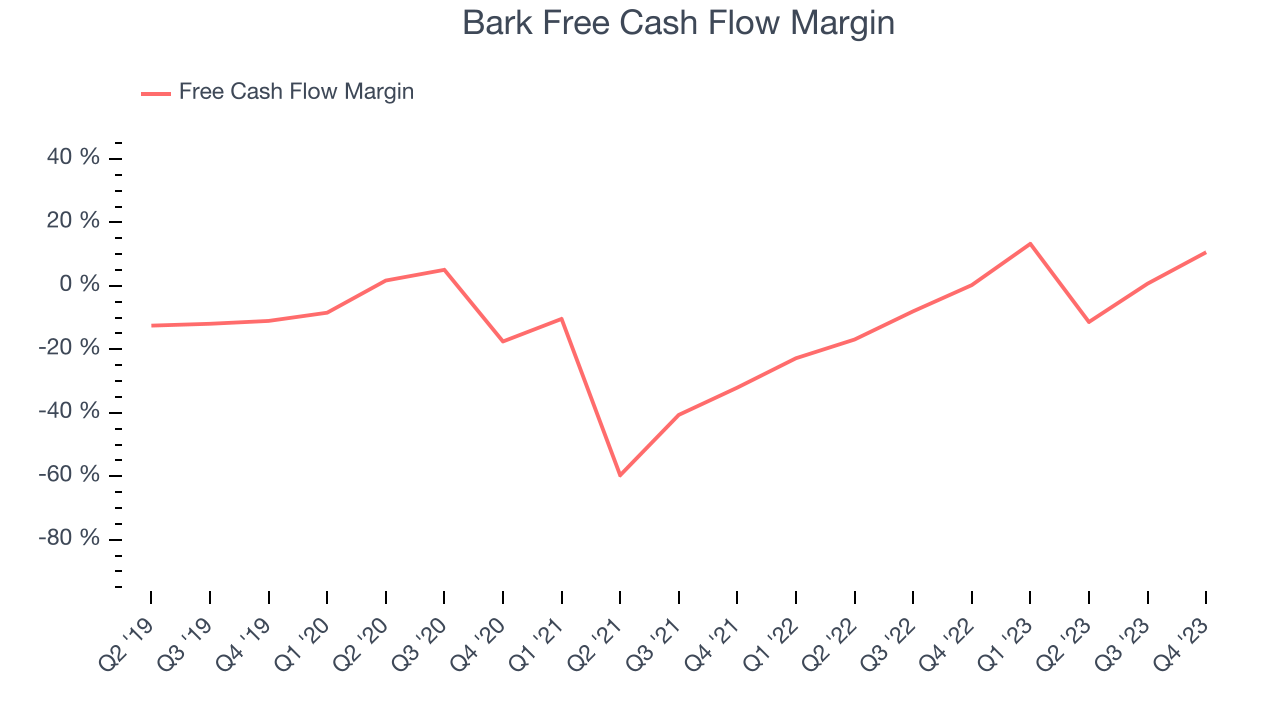
Bark's free cash flow came in at $13.26 million in Q3, equivalent to a 10.6% margin and up 3,905% year on year.
Return on Invested Capital (ROIC)
EPS and free cash flow tell us whether a company was profitable while growing revenue. But was it capital-efficient? A company’s ROIC explains this by showing how much operating profit a company makes compared to how much money the business raised (debt and equity).
Bark's five-year average return on invested capital was negative 165%, meaning management lost money while trying to expand the business. Its returns were among the worst in the consumer discretionary sector.
The trend in its ROIC, however, is often what surprises the market and drives the stock price. Unfortunately, over the last two years, Bark's ROIC has averaged a 87.9 percentage point decrease each year. In conjunction with its already low returns, these declines suggest the company's profitable business opportunities are few and far between.
Key Takeaways from Bark's Q3 Results
It was encouraging to see Bark slightly beat analysts' revenue estimates, driven by better-than-expected Direct-to-Consumer sales. We were also glad it topped Wall Street's free cash flow projections and lifted its Q4 revenue guidance. On the other hand, its operating margin missed analysts' expectations. Overall, this was a mixed quarter for Bark. The company is down 1.9% on the results and currently trades at $0.9 per share.
Is Now The Time?
Bark may have had a tough quarter, but investors should also consider its valuation and business qualities when assessing the investment opportunity.
We cheer for all companies serving consumers, but in the case of Bark, we'll be cheering from the sidelines. Although its revenue growth has been exceptional over the last four years, its declining ROIC shows it struggled to find compelling business opportunities. And while its projected EPS growth for the next year implies the company's fundamentals will improve, the downside is its cash burn raises the question of whether it can sustainably maintain growth.
While we've no doubt one can find things to like about Bark, we think there are better opportunities elsewhere in the market. We don't see many reasons to get involved at the moment.
Wall Street analysts covering the company had a one-year price target of $1.77 per share right before these results (compared to the current share price of $0.90).
To get the best start with StockStory, check out our most recent stock picks, and then sign up for our earnings alerts by adding companies to your watchlist here. We typically have the quarterly earnings results analyzed within seconds of the data being released, and especially for companies reporting pre-market, this often gives investors the chance to react to the results before the market has fully absorbed the information.