
Electronics retailer Best Buy (NYSE:BBY) reported results in line with analysts' expectations in Q4 FY2024, with revenue flat year on year at $14.65 billion. On the other hand, the company's full-year revenue guidance of $41.95 billion at the midpoint came in slightly below analysts' estimates. It made a non-GAAP profit of $2.72 per share, improving from its profit of $2.61 per share in the same quarter last year.
Best Buy Co (BBY) Q4 FY2024 Highlights:
- Revenue: $14.65 billion vs analyst estimates of $14.56 billion (small beat)
- EPS (non-GAAP): $2.72 vs analyst estimates of $2.50 (8.7% beat)
- Management's revenue guidance for the upcoming financial year 2025 is $41.95 billion at the midpoint, missing analyst estimates by 0.9% and implying -3.5% growth (vs -6.7% in FY2024)
- Free Cash Flow of $997 million, down 41.3% from the same quarter last year
- Gross Margin (GAAP): 20.5%, up from 20% in the same quarter last year
- Same-Store Sales were down 4.8% year on year (slight beat)
- Market Capitalization: $17.16 billion
With humble beginnings as a stereo equipment seller, Best Buy (NYSE:BBY) now sells a broad selection of consumer electronics, appliances, and home office products.
Whether you need a new gaming headset, a speaker for your home audio system, or a blender for making smoothies, Best Buy has you covered. The company can serve the tech savvy consumer, who appreciates Best Buy’s selection and competitive pricing. Best Buy can also serve the electronics novice providing expert service and advice through its knowledgeable sales associates, who can recommend products and help with technical support and installation. These sales associates, famously known as the ‘Geek Squad’, are one key way the company can compete effectively with larger competitors.
The size of an average Best Buy store is around 40,000 square feet and is typically located in high-traffic areas, such as shopping centers and malls. The stores are typically organized by product categories such as TVs, laptops and computers, home theater/audio, and home appliances among others. The mid-sized footprint, straightforward layout, and displays allow those who know what they want to easily find it but also encourage discovery among those who may be browsing. Best Buy has an e-commerce presence, launched in 1998, that allows customers to purchase products for home delivery or to pick up in-store.
Electronics & Gaming Retailer
After a long day, some of us want to just watch TV, play video games, listen to music, or scroll through our phones; electronics and gaming retailers sell the technology that makes this possible, plus more. Shoppers can find everything from surround-sound speakers to gaming controllers to home appliances in their stores. Competitive prices and helpful store associates that can talk through topics like the latest technology in gaming and installation keep customers coming back. This is a category that has moved rapidly online over the last few decades, so these electronics and gaming retailers have needed to be nimble and aggressive with their e-commerce and omnichannel investments.
Retailers offering consumer electronics and home appliances include Walmart (NYSE:WMT), Target (NYSE:TGT), and Amazon.com (NASDAQ:AMZN).Sales Growth
Best Buy Co is a behemoth in the consumer retail sector and benefits from economies of scale, an important advantage giving the business an edge in distribution and more negotiating power with suppliers.
As you can see below, the company's revenue was flat over the last four years (we compare to 2019 to normalize for COVID-19 impacts) as its store count and sales at existing, established stores both shrunk.
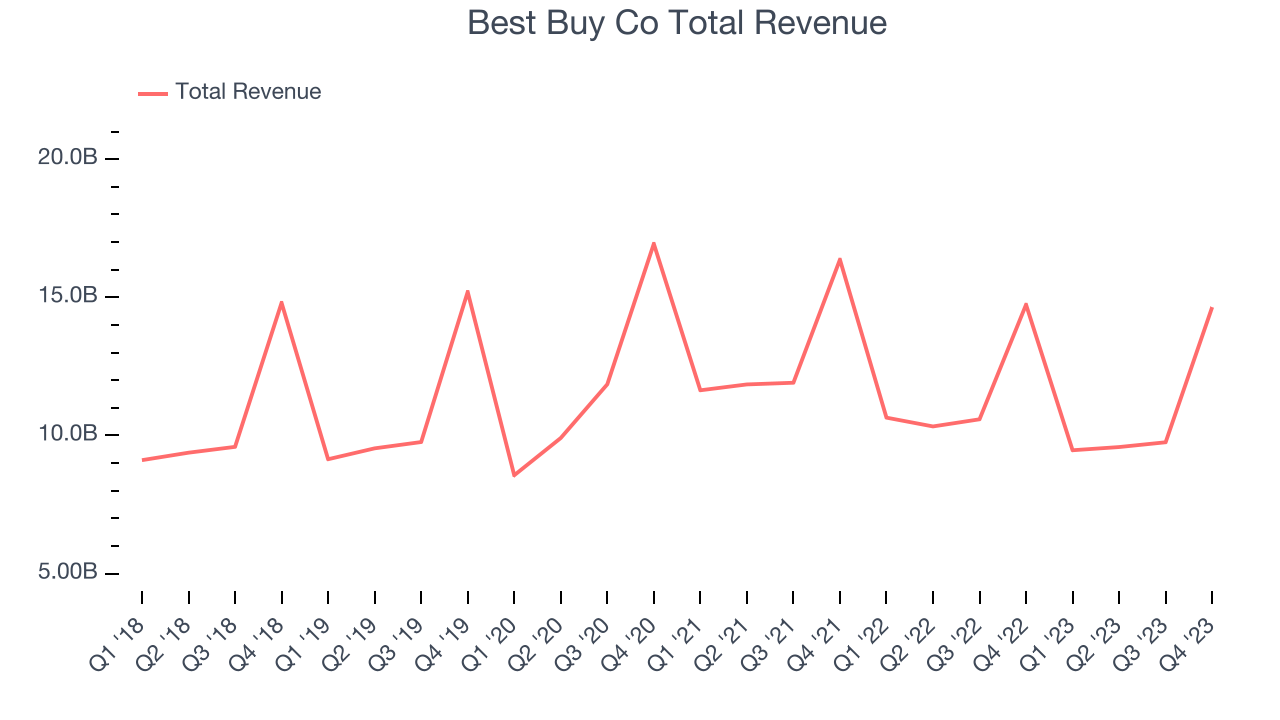
This quarter, Best Buy Co reported a rather uninspiring 0.6% year-on-year revenue decline to $14.65 billion in revenue, in line with Wall Street's estimates. Looking ahead, Wall Street expects revenue to decline 2.8% over the next 12 months, a deceleration from this quarter.
Same-Store Sales
A company's same-store sales growth shows the year-on-year change in sales for its brick-and-mortar stores that have been open for at least a year, give or take, and e-commerce platform. This is a key performance indicator for retailers because it measures organic growth and demand.
Best Buy Co's demand has been shrinking over the last eight quarters, and on average, its same-store sales have declined by 8.5% year on year. The company has been reducing its store count as fewer locations sometimes lead to higher same-store sales, but that hasn't been the case here.
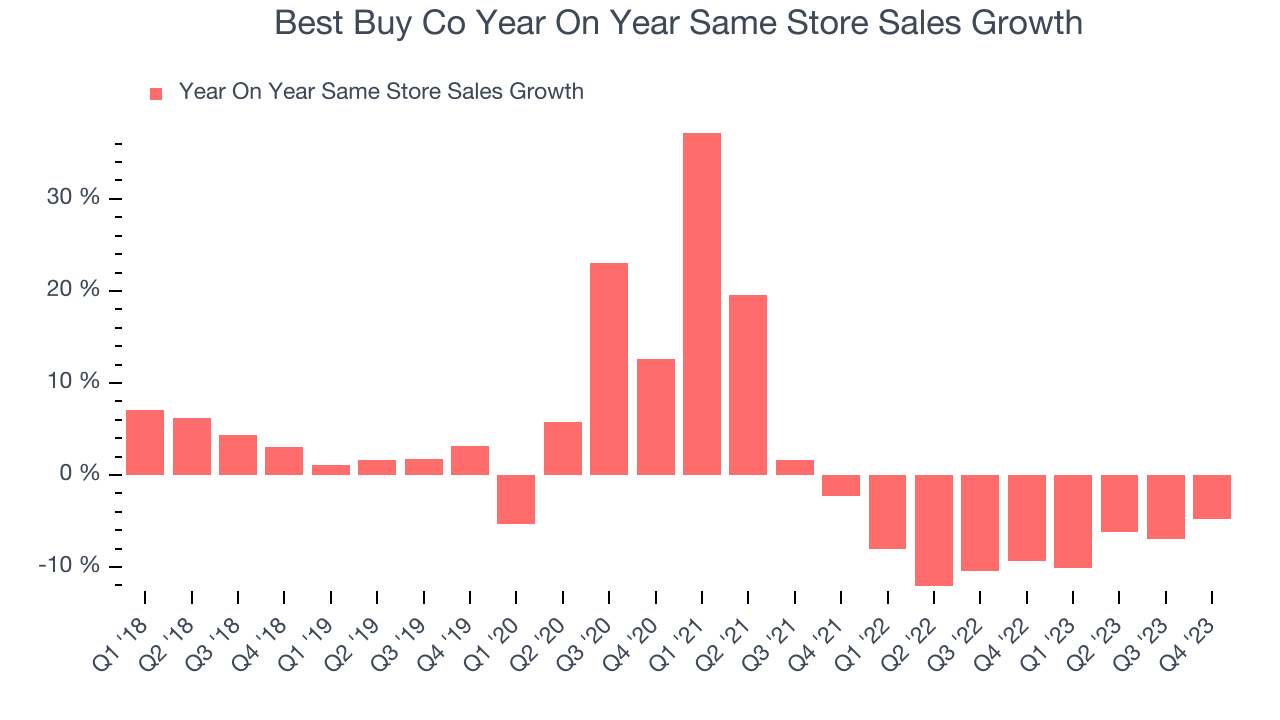
In the latest quarter, Best Buy Co's same-store sales fell 4.8% year on year. This decrease was a further deceleration from the 9.3% year-on-year decline it posted 12 months ago. We hope the business can get back on track.
Gross Margin & Pricing Power
Gross profit margins tell us how much money a retailer gets to keep after paying for the goods it sells.
Best Buy Co has poor unit economics for a retailer, leaving it with little room for error if things go awry. As you can see below, it's averaged a 21.7% gross margin over the last two years. This means the company makes $0.22 for every $1 in revenue before accounting for its operating expenses. 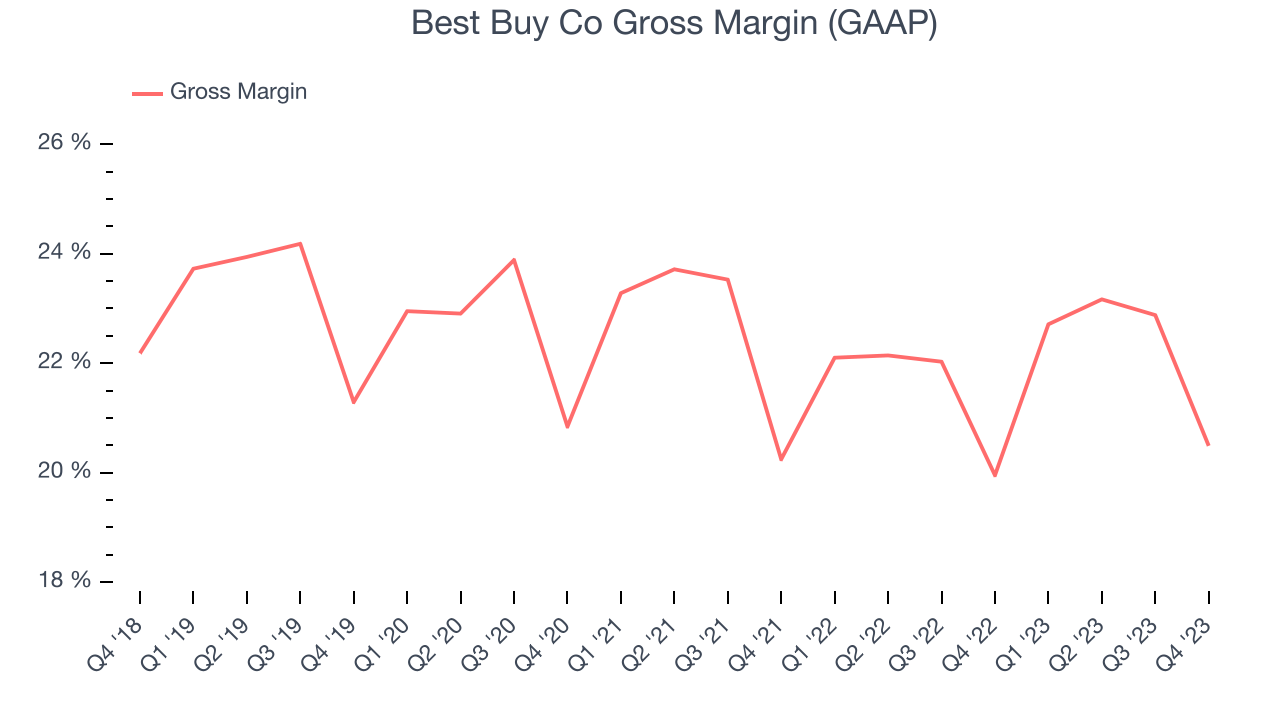
Best Buy Co produced a 20.5% gross profit margin in Q4, flat with the same quarter last year. This steady margin stems from its efforts to keep prices low for consumers and signals that it has stable input costs (such as freight expenses to transport goods).
Operating Margin
Operating margin is an important measure of profitability for retailers as it accounts for all expenses keeping the lights on, including wages, rent, advertising, and other administrative costs.
In Q4, Best Buy Co generated an operating profit margin of 3.8%, in line with the same quarter last year. This indicates the company's costs have been relatively stable.
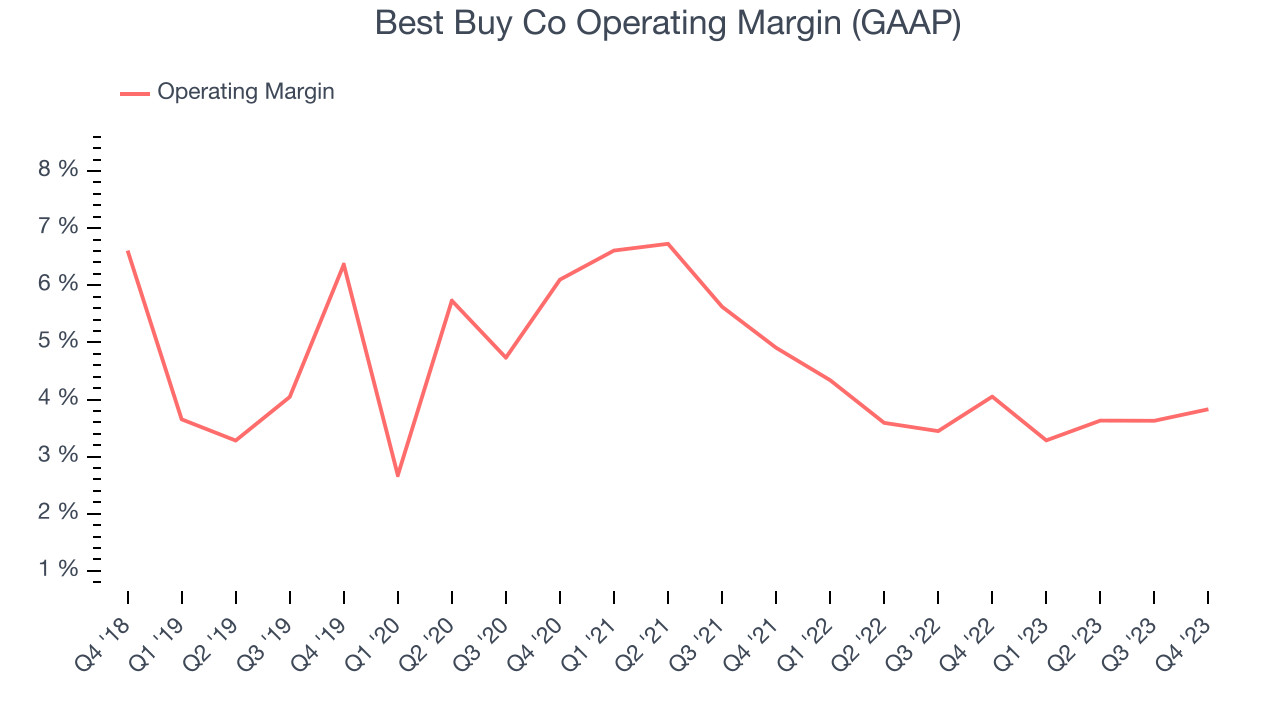 Zooming out, Best Buy Co was profitable over the last two years but held back by its large expense base. Its average operating margin of 3.8% has been paltry for a consumer retail business. Its margin has also seen few fluctuations, meaning it will take a big change to improve profitability.
EPS
Earnings growth is a critical metric to track, but for long-term shareholders, earnings per share (EPS) is more telling because it accounts for dilution and share repurchases.
In Q4, Best Buy Co reported EPS at $2.72, up from $2.61 in the same quarter a year ago. This print beat Wall Street's estimates by 8.7%.
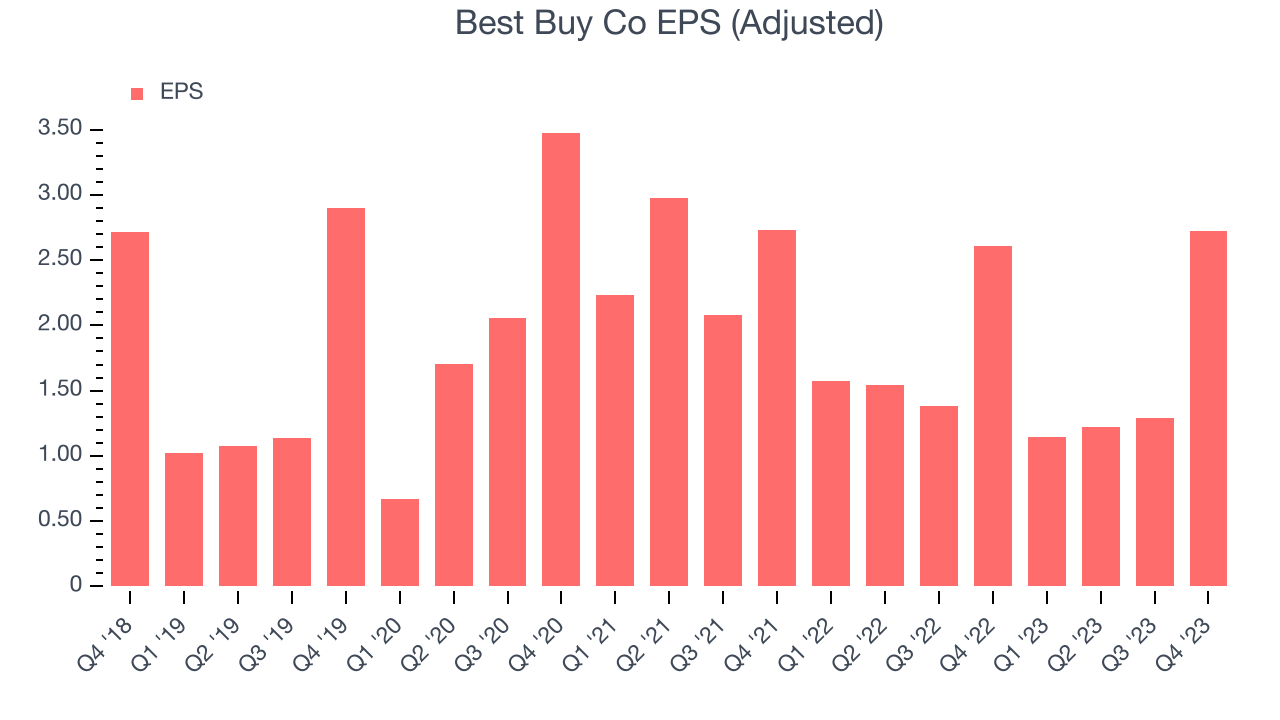
Between FY2020 and FY2024, Best Buy Co's adjusted diluted EPS grew 4%, translating into a weak 1% compounded annual growth rate. This growth, however, is materially higher than its revenue growth over the same period and was driven by excellent expense management (leading to higher profitability) and share repurchases (leading to higher PER share earnings).
Over the next 12 months, however, Wall Street is projecting an average 2.4% year-on-year decline in EPS.
Cash Is King
Although earnings are undoubtedly valuable for assessing company performance, we believe cash is king because you can't use accounting profits to pay the bills.
Best Buy Co's free cash flow came in at $997 million in Q4, down 41.3% year on year. This result represents a 6.8% margin.
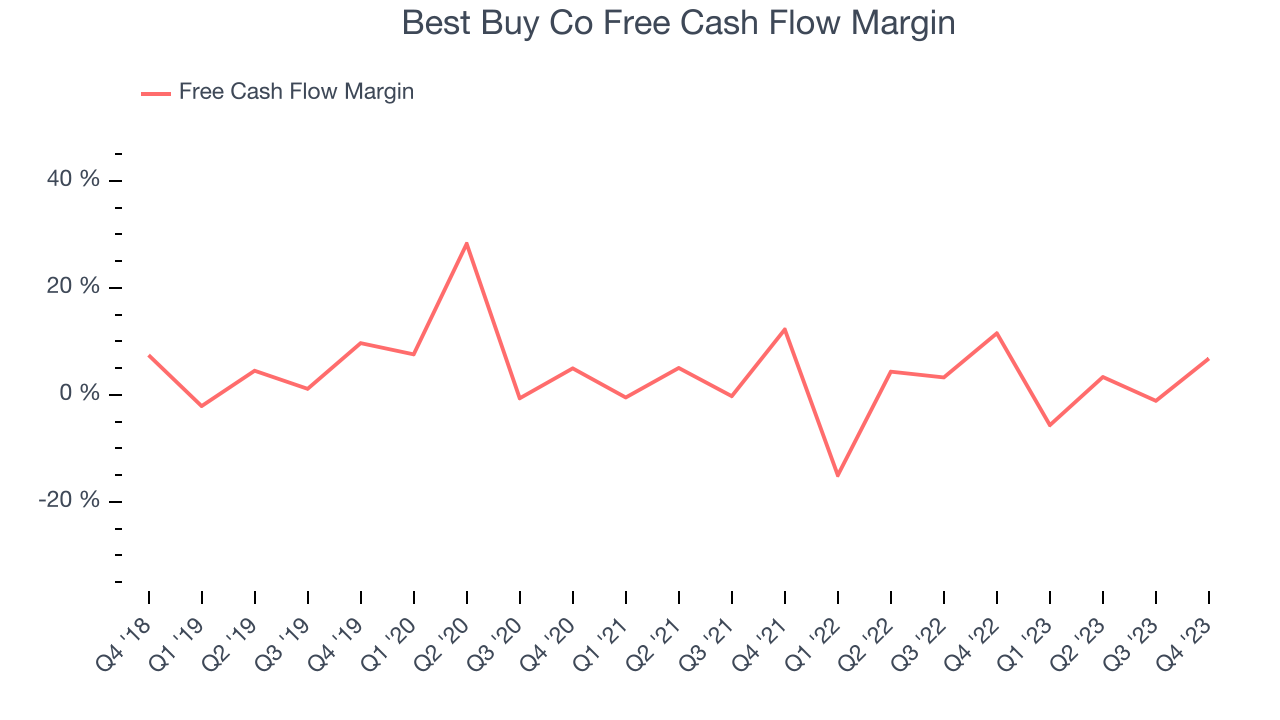
Over the last eight quarters, Best Buy Co has shown mediocre cash profitability, putting it in a pinch as it gives the company limited opportunities to reinvest, pay down debt, or return capital to shareholders. Its free cash flow margin has averaged 1.7%, subpar for a consumer retail business. Best Buy Co's margin has also been flat during that time, showing the company needs to take action and improve its cash profitability.
Return on Invested Capital (ROIC)
EPS and free cash flow tell us whether a company was profitable while growing revenue. But was it capital-efficient? A company’s ROIC explains this by showing how much operating profit a company makes compared to how much money the business raised (debt and equity).
Although Best Buy Co hasn't been the highest-quality company lately because of its poor top-line performance, it historically did a wonderful job investing in profitable business initiatives. Its five-year average ROIC was 38.1%, splendid for a retail business.
The trend in its ROIC, however, is often what surprises the market and drives the stock price. Unfortunately, Best Buy Co's ROIC over the last two years averaged 19.2 percentage point decreases each year. We like what management has done historically but are concerned its ROIC is declining, perhaps a symptom of waning business opportunities to invest profitably.
Key Takeaways from Best Buy Co's Q4 Results
It was good to see Best Buy Co beat analysts' EPS expectations this quarter. We were also happy its gross margin narrowly outperformed Wall Street's estimates. On the other hand, its full-year earnings forecast missed analysts' expectations and its full-year revenue guidance slightly missed Wall Street's estimates. Overall, the results could have been better. The stock is up 2.7% after reporting and currently trades at $81.8 per share.
Is Now The Time?
When considering an investment in Best Buy Co, investors should take into account its valuation and business qualities as well as what's happened in the latest quarter.
We cheer for all companies serving consumers, but in the case of Best Buy Co, we'll be cheering from the sidelines. Its revenue has declined over the last four years, and analysts expect growth to deteriorate from here. And while its stellar ROIC suggests it has been a well-run company historically, the downside is its gross margins make it more challenging to reach positive operating profits compared to other consumer retail businesses. On top of that, its shrinking same-store sales suggests it'll need to change its strategy to succeed.
Best Buy Co's price-to-earnings ratio based on the next 12 months is 12.8x. While the price is reasonable and there are some things to like about Best Buy Co, we think there are better opportunities elsewhere in the market right now.
Wall Street analysts covering the company had a one-year price target of $78.10 per share right before these results (compared to the current share price of $81.80).
To get the best start with StockStory, check out our most recent stock picks, and then sign up to our earnings alerts by adding companies to your watchlist here. We typically have the quarterly earnings results analyzed within seconds of the data being released, and especially for companies reporting pre-market, this often gives investors the chance to react to the results before the market has fully absorbed the information.