
Child care and education company Bright Horizons (NYSE:BFAM) reported Q1 CY2024 results beating Wall Street analysts' expectations, with revenue up 12.5% year on year to $622.7 million. The company expects the full year's revenue to be around $2.65 billion, in line with analysts' estimates. It made a non-GAAP profit of $0.51 per share, improving from its profit of $0.49 per share in the same quarter last year.
Bright Horizons (BFAM) Q1 CY2024 Highlights:
- Revenue: $622.7 million vs analyst estimates of $615.5 million (1.2% beat)
- EPS (non-GAAP): $0.51 vs analyst estimates of $0.46 (11.7% beat)
- The company reconfirmed its revenue guidance for the full year of $2.65 billion at the midpoint
- Gross Margin (GAAP): 21.7%, up from 18.1% in the same quarter last year
- Free Cash Flow of $96.93 million, up 50% from the previous quarter
- Market Capitalization: $6.02 billion
Founded in 1986, Bright Horizons (NYSE:BFAM) is a global provider of child care, early education, and workforce support solutions.
At the core of Bright Horizons’s offerings are its child care and early education services. The company’s care facilities are designed to provide safe, nurturing, and engaging environments for children, fostering their development and learning from infancy through preschool. Bright Horizons adopts a research-based curriculum that emphasizes holistic child development, focusing on building cognitive, emotional, social, and physical skills.
In addition to child care, Bright Horizons provides a range of family-focused solutions. These include backup care services for times when regular care arrangements fall through, educational advisory services to help families navigate school and college admissions, and special needs services offering support for children with developmental challenges.
Bright Horizons also works with corporations to enhance employee well-being and productivity. The company collaborates with businesses to offer child care and work-life solutions as part of employee benefits packages. This partnership not only aids in attracting and retaining talent for corporate customers but also supports employees in achieving a better work-life balance, ultimately contributing to a more engaged and productive workforce.
Education Services
A whole industry has emerged to address the problem of rising education costs, offering consumers alternatives to traditional education paths such as four-year colleges. These alternative paths, which may include online courses or flexible schedules, make education more accessible to those with work or child-rearing obligations. However, some have run into issues around the value of the degrees and certifications they provide and whether customers are getting a good deal. Those who don’t prove their value could struggle to retain students, or even worse, invite the heavy hand of regulation.
Bright Horizons's primary competitors include K12 Inc. (NYSE: LRN), G8 Education (ASX:GEM), Grand Canyon Education (NASDAQ: LOPE), and private companies KinderCare Education, Learning Care Group, Goddard Systems, and Primrose Schools.Sales Growth
Reviewing a company's long-term performance can reveal insights into its business quality. Any business can have short-term success, but a top-tier one sustains growth for years. Bright Horizons's annualized revenue growth rate of 5.1% over the last five years was weak for a consumer discretionary business. 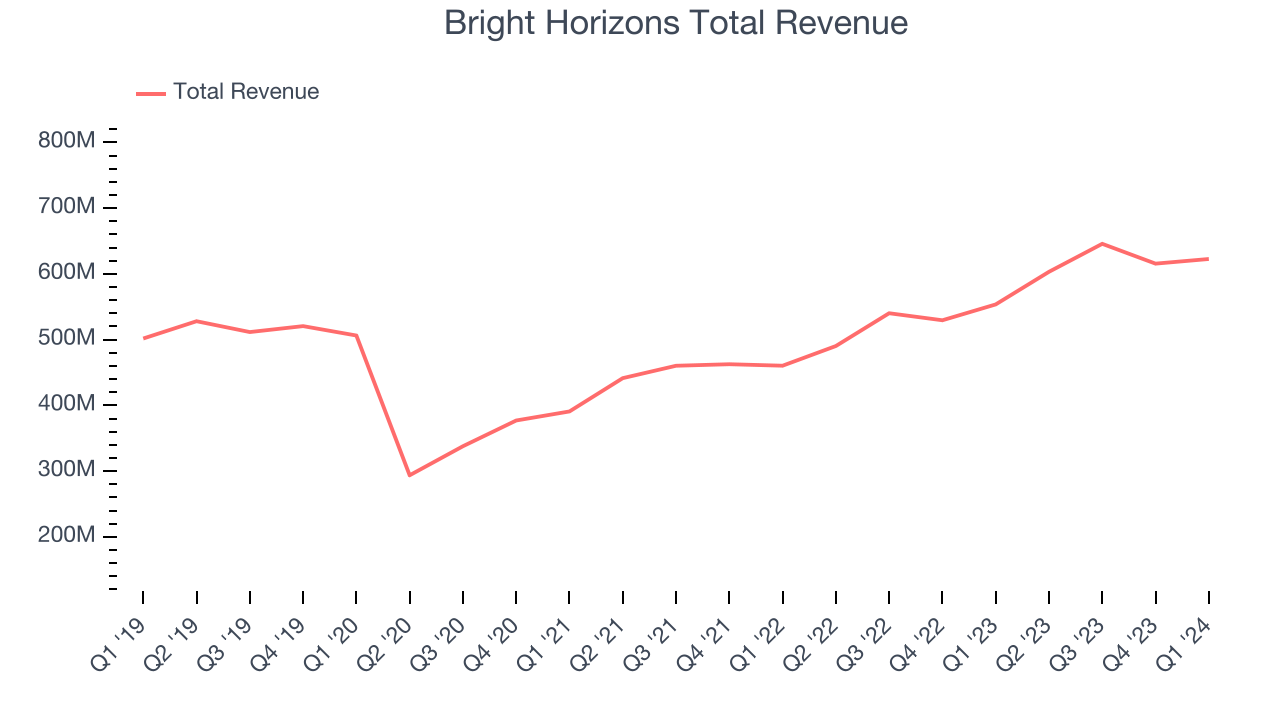 Within consumer discretionary, product cycles are short and revenue can be hit-driven due to rapidly changing trends. That's why we also follow short-term performance. Bright Horizons's annualized revenue growth of 16.7% over the last two years is above its five-year trend, suggesting some bright spots.
This quarter, Bright Horizons reported robust year-on-year revenue growth of 12.5%, and its $622.7 million of revenue exceeded Wall Street's estimates by 1.2%. Looking ahead, Wall Street expects sales to grow 9.3% over the next 12 months, a deceleration from this quarter.
Operating Margin
Operating margin is an important measure of profitability. It’s the portion of revenue left after accounting for all core expenses–everything from the cost of goods sold to advertising and wages. Operating margin is also useful for comparing profitability across companies with different levels of debt and tax rates because it excludes interest and taxes.
Bright Horizons was profitable over the last eight quarters but held back by its large expense base. It's demonstrated subpar profitability for a consumer discretionary business, producing an average operating margin of 7.3%.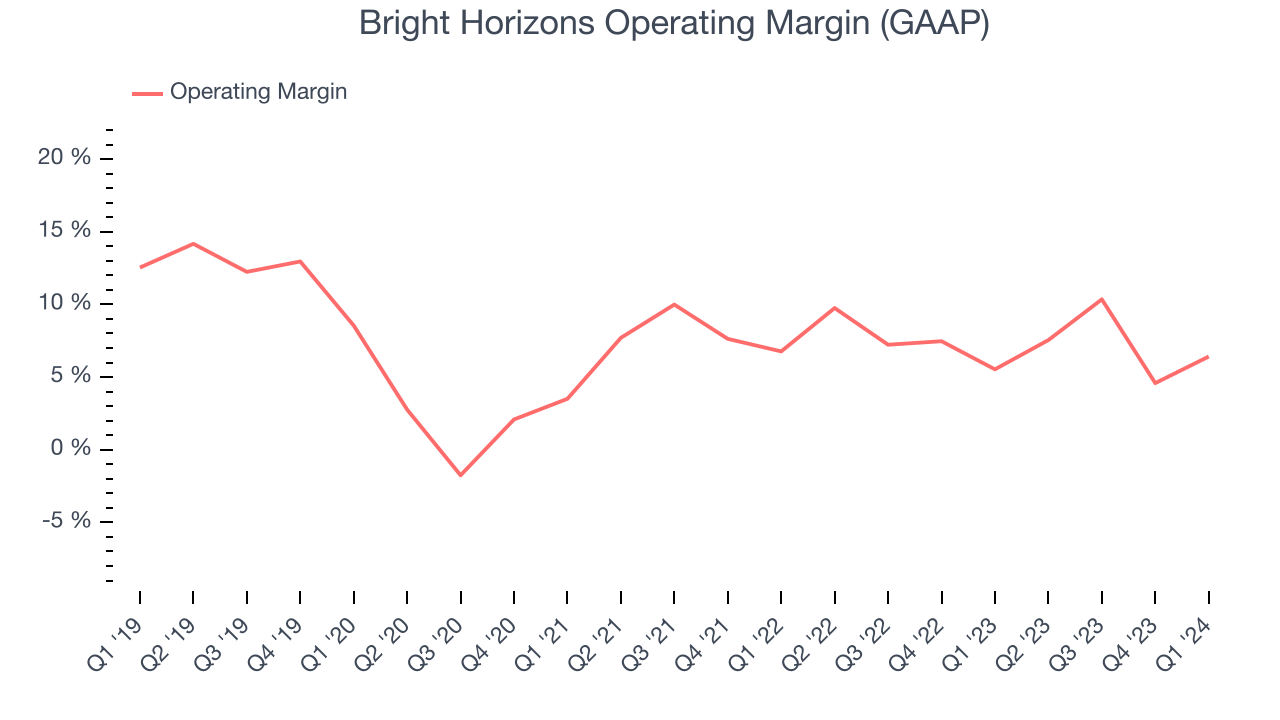
In Q1, Bright Horizons generated an operating profit margin of 6.4%, in line with the same quarter last year. This indicates the company's costs have been relatively stable.
Over the next 12 months, Wall Street expects Bright Horizons to become more profitable. Analysts are expecting the company’s LTM operating margin of 7.3% to rise to 10.5%.EPS
We track long-term historical earnings per share (EPS) growth for the same reason as long-term revenue growth. Compared to revenue, however, EPS highlights whether a company's growth was profitable. 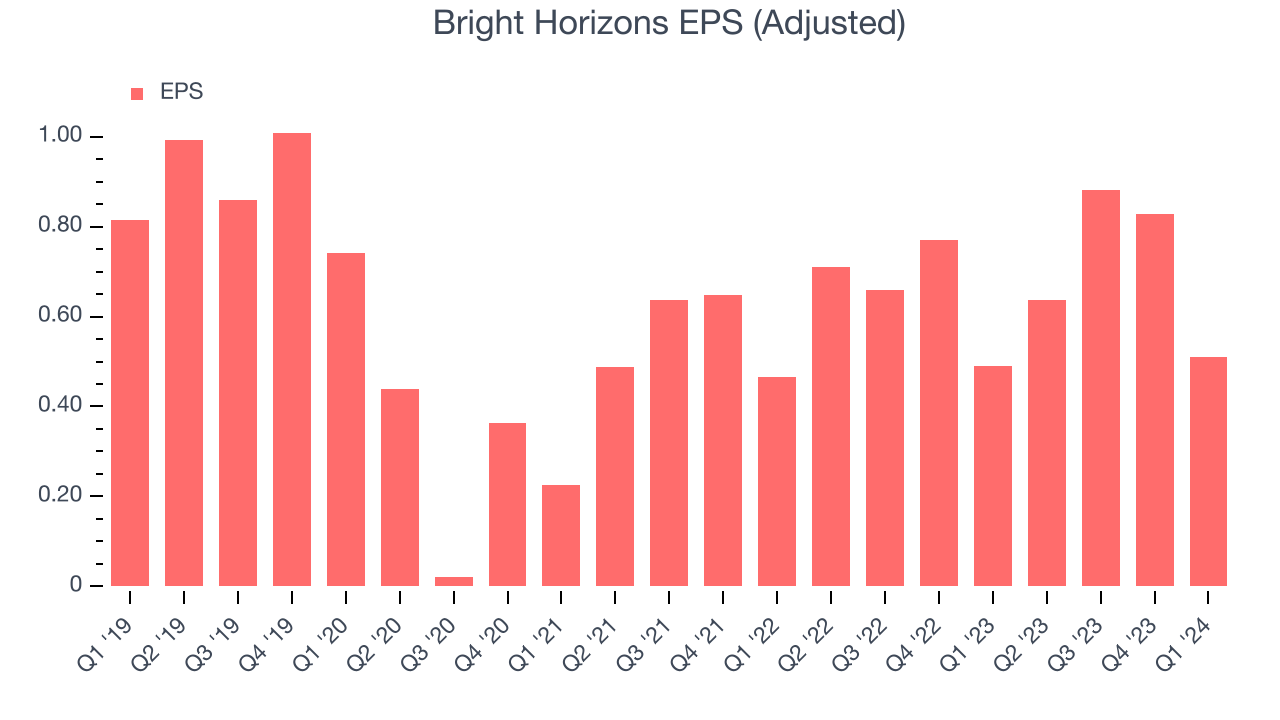
Over the last five years, Bright Horizons's EPS dropped 15.5%, translating into 2.9% annualized declines. Thankfully, Bright Horizons has bucked its trend as of late, growing its EPS over the last three years. We'll see if the company's growth is sustainable.
In Q1, Bright Horizons reported EPS at $0.51, up from $0.49 in the same quarter last year. This print beat analysts' estimates by 11.7%. Over the next 12 months, Wall Street expects Bright Horizons to grow its earnings. Analysts are projecting its LTM EPS of $2.85 to climb by 13.7% to $3.25.
Cash Is King
Although earnings are undoubtedly valuable for assessing company performance, we believe cash is king because you can't use accounting profits to pay the bills.
Over the last two years, Bright Horizons has shown mediocre cash profitability, putting it in a pinch as it gives the company limited opportunities to reinvest, pay down debt, or return capital to shareholders. Its free cash flow margin has averaged 7.5%, subpar for a consumer discretionary business.
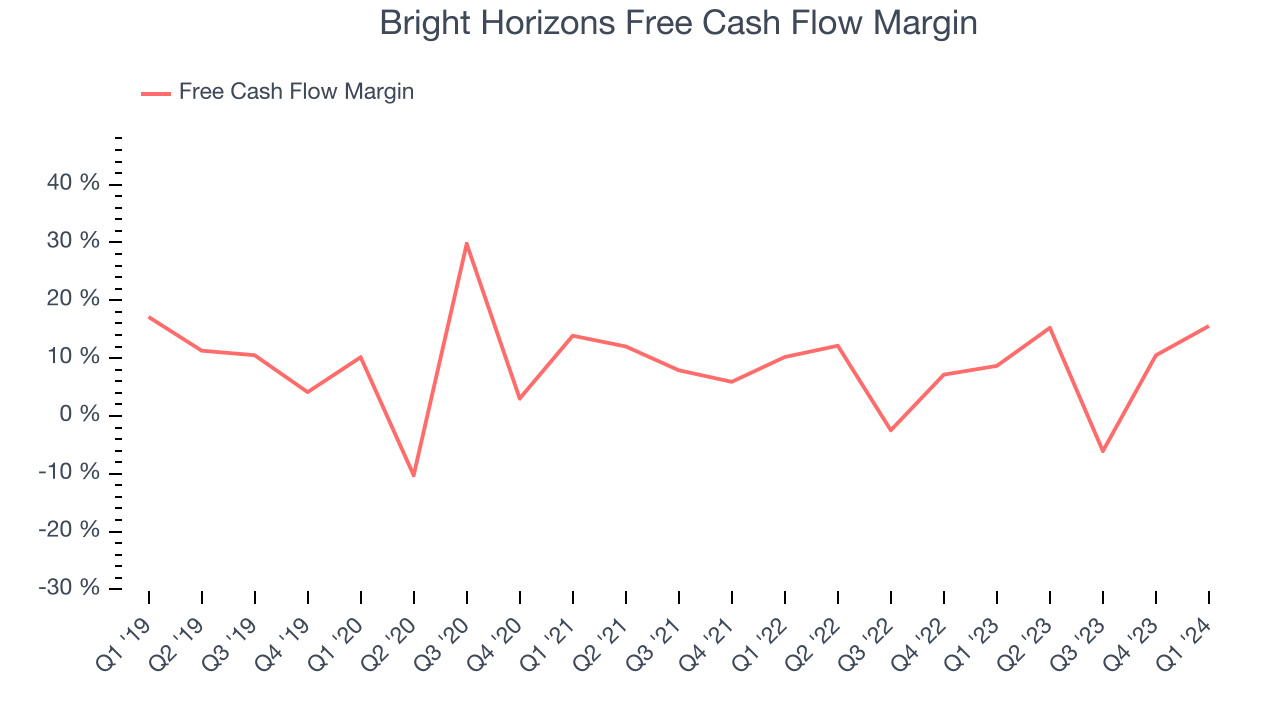
Bright Horizons's free cash flow came in at $96.93 million in Q1, equivalent to a 15.6% margin and up 102% year on year. Over the next year, analysts predict Bright Horizons's cash profitability will fall. Their consensus estimates imply its LTM free cash flow margin of 8.6% will decrease to 7.2%.
Return on Invested Capital (ROIC)
EPS and free cash flow tell us whether a company was profitable while growing revenue. But was it capital-efficient? A company’s ROIC explains this by showing how much operating profit a company makes compared to how much money the business raised (debt and equity).
Bright Horizons's five-year average return on invested capital was 6%, somewhat low compared to the best consumer discretionary companies that pump out 25%+. Its returns suggest it historically did a subpar job investing in profitable business initiatives.
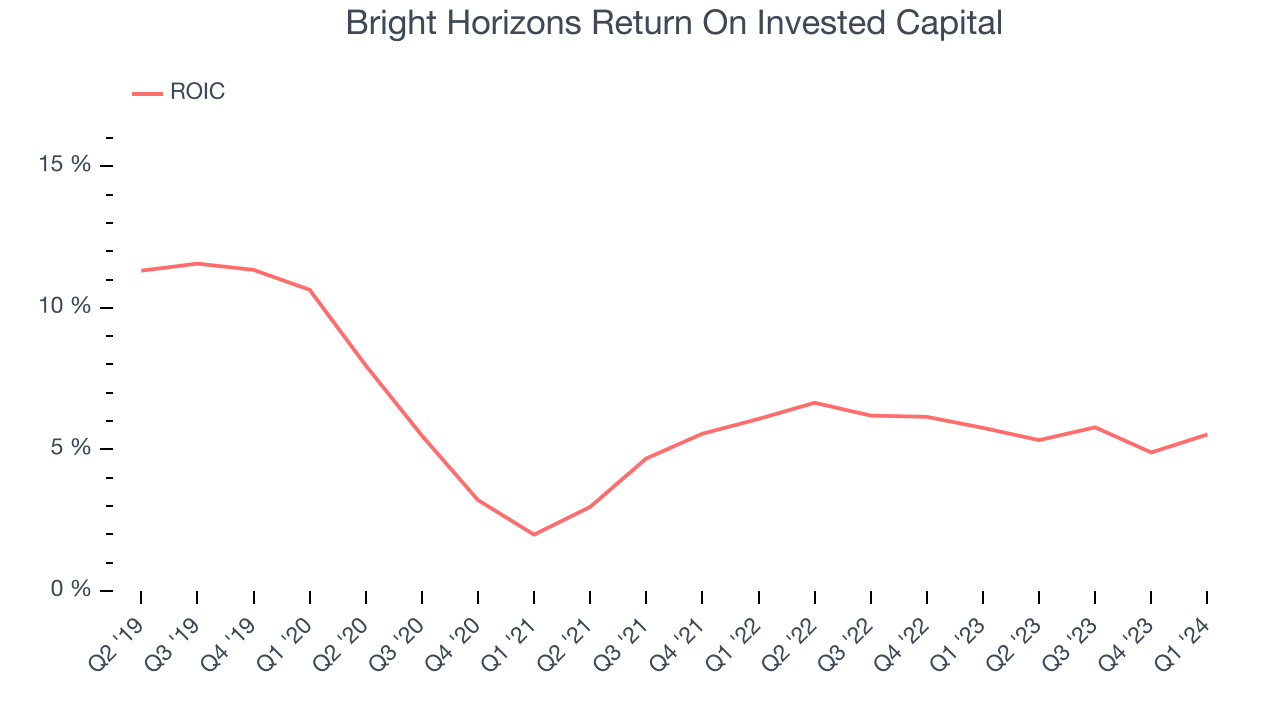
The trend in its ROIC, however, is often what surprises the market and drives the stock price. Unfortunately, Bright Horizons's ROIC has stayed the same over the last few years. If the company wants to become an investable business, it will need to increase its returns.
Balance Sheet Risk
Debt is a tool that can boost company returns but presents risks if used irresponsibly.
Bright Horizons reported $63.68 million of cash and $1.85 billion of debt on its balance sheet in the most recent quarter. As investors in high-quality companies, we primarily focus on two things: 1) that a company's debt level isn't too high and 2) that its interest payments are not excessively burdening the business.
With $357.3 million of EBITDA over the last 12 months, we view Bright Horizons's 5.0x net-debt-to-EBITDA ratio as safe. We also see its $52.37 million of annual interest expenses as appropriate. The company's profits give it plenty of breathing room, allowing it to continue investing in new initiatives.
Key Takeaways from Bright Horizons's Q1 Results
It was good to see Bright Horizons beat analysts' EPS and revenue expectations this quarter. On the other hand, its full-year revenue guidance was underwhelming. Zooming out, we think this was still a decent, albeit mixed, quarter, showing that the company is staying on track. The stock is flat after reporting and currently trades at $104.27 per share.
Is Now The Time?
Bright Horizons may have had a favorable quarter, but investors should also consider its valuation and business qualities when assessing the investment opportunity.
We cheer for all companies serving consumers, but in the case of Bright Horizons, we'll be cheering from the sidelines. Its revenue growth has been uninspiring over the last five years, but at least growth is expected to increase in the short term. And while its projected EPS for the next year implies the company will generate shareholder value, the downside is its relatively low ROIC suggests it has historically struggled to find compelling business opportunities. On top of that, its declining EPS over the last five years makes it hard to trust.
Bright Horizons's price-to-earnings ratio based on the next 12 months is 32.1x. While we've no doubt one can find things to like about Bright Horizons, we think there are better opportunities elsewhere in the market. We don't see many reasons to get involved at the moment.
Wall Street analysts covering the company had a one-year price target of $106.30 per share right before these results (compared to the current share price of $104.27).
To get the best start with StockStory, check out our most recent stock picks, and then sign up for our earnings alerts by adding companies to your watchlist here. We typically have the quarterly earnings results analyzed within seconds of the data being released, and especially for companies reporting pre-market, this often gives investors the chance to react to the results before the market has fully absorbed the information.