
Packaged foods company B&G Foods (NYSE:BGS) missed analysts' expectations in Q1 CY2024, with revenue down 7.1% year on year to $475.2 million. On the other hand, the company's outlook for the full year was close to analysts' estimates with revenue guided to $1.97 billion at the midpoint. It made a non-GAAP profit of $0.18 per share, down from its profit of $0.27 per share in the same quarter last year.
B&G Foods (BGS) Q1 CY2024 Highlights:
- Revenue: $475.2 million vs analyst estimates of $482.1 million (1.4% miss)
- EPS (non-GAAP): $0.18 vs analyst expectations of $0.21 (15.4% miss)
- The company dropped its revenue guidance for the full year from $2.00 billion to $1.97 billion at the midpoint, a 1.4% decrease
- Gross Margin (GAAP): 22.9%, up from 22.5% in the same quarter last year
- Sales Volumes were down 1.4% year on year
- Market Capitalization: $896.4 million
Started as a small grocery store in New York City, B&G Foods (NYSE:BGS) is an American packaged foods company with a diverse portfolio of more than 50 brands.
The company was founded in 1889 by brothers Ralph and George Burns, along with their business partner George Brinkman. Their humble grocery store quickly gained popularity on the East Coast for its creamed horseradish, and the rest is history.
Over the next century, B&G Foods would enter the packaged foods business, acquiring several well-known brands such as Ortega, Green Giant, and Cream of Wheat, among others. These acquisitions allowed the company to expand its product offerings and introduce a wide range of beloved food products to consumers. Today, B&G Foods sells everything from canned vegetables to hot sauces, spices, snacks, and breakfast favorites.
The company continuously explores new flavors, packaging innovations, and product formulations to meet changing consumer demands and preferences. For example, it’s collaborated with Cinnamon Toast Crunch, Einstein Bros Bagels, Girl Scouts, and Snickers to manufacture and distribute branded seasoning blends.
While deeply rooted in the United States, B&G Foods has a global reach, and its products are available in various countries. It reaches consumers mostly through retail partnerships with grocery stores and retailers such as Walmart, Kroger, Publix, and Safeway.
Shelf-Stable Food
As America industrialized and moved away from an agricultural economy, people faced more demands on their time. Packaged foods emerged as a solution offering convenience to the evolving American family, whether it be canned goods or snacks. Today, Americans seek brands that are high in quality, reliable, and reasonably priced. Furthermore, there's a growing emphasis on health-conscious and sustainable food options. Packaged food stocks are considered resilient investments. People always need to eat, so these companies can enjoy consistent demand as long as they stay on top of changing consumer preferences. The industry spans from multinational corporations to smaller specialized firms and is subject to food safety and labeling regulations.
Competitors in the packaged foods industry include Conagra (NYSE:CAG), General Mills (NYSE:GIS), Hormel Foods (NYSE:HRL), Kraft Heinz (NASDAQGS:KHC), and McCormick (NYSE:MKC).Sales Growth
B&G Foods carries some recognizable brands and products but is a mid-sized consumer staples company. Its size could bring disadvantages compared to larger competitors benefiting from better brand awareness and economies of scale. On the other hand, B&G Foods can still achieve high growth rates because its revenue base is not yet monstrous.
As you can see below, the company's revenue was flat over the last three years. This is poor for a consumer staples business.
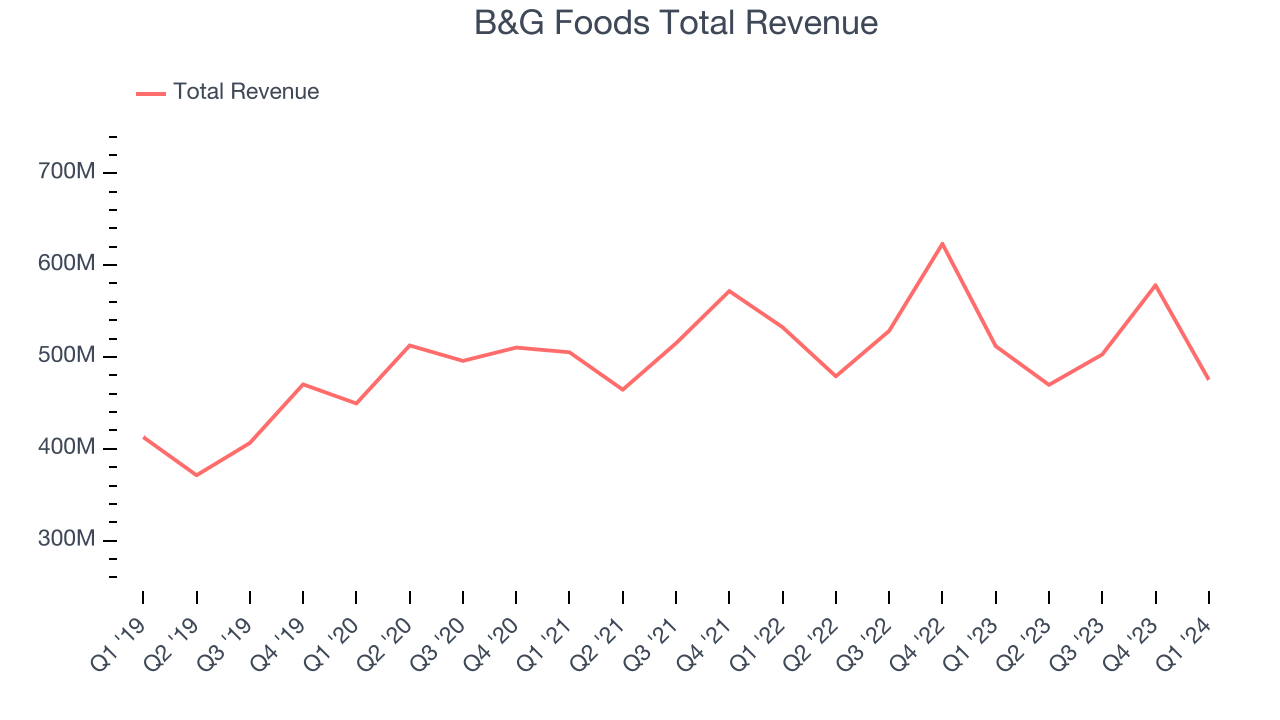
This quarter, B&G Foods missed Wall Street's estimates and reported a rather uninspiring 7.1% year-on-year revenue decline, generating $475.2 million in revenue. Looking ahead, Wall Street expects revenue to decline 1.8% over the next 12 months.
Gross Margin & Pricing Power
This quarter, B&G Foods's gross profit margin was 22.9%, in line with the same quarter last year. That means for every $1 in revenue, a chunky $0.77 went towards paying for raw materials, production of goods, and distribution expenses.
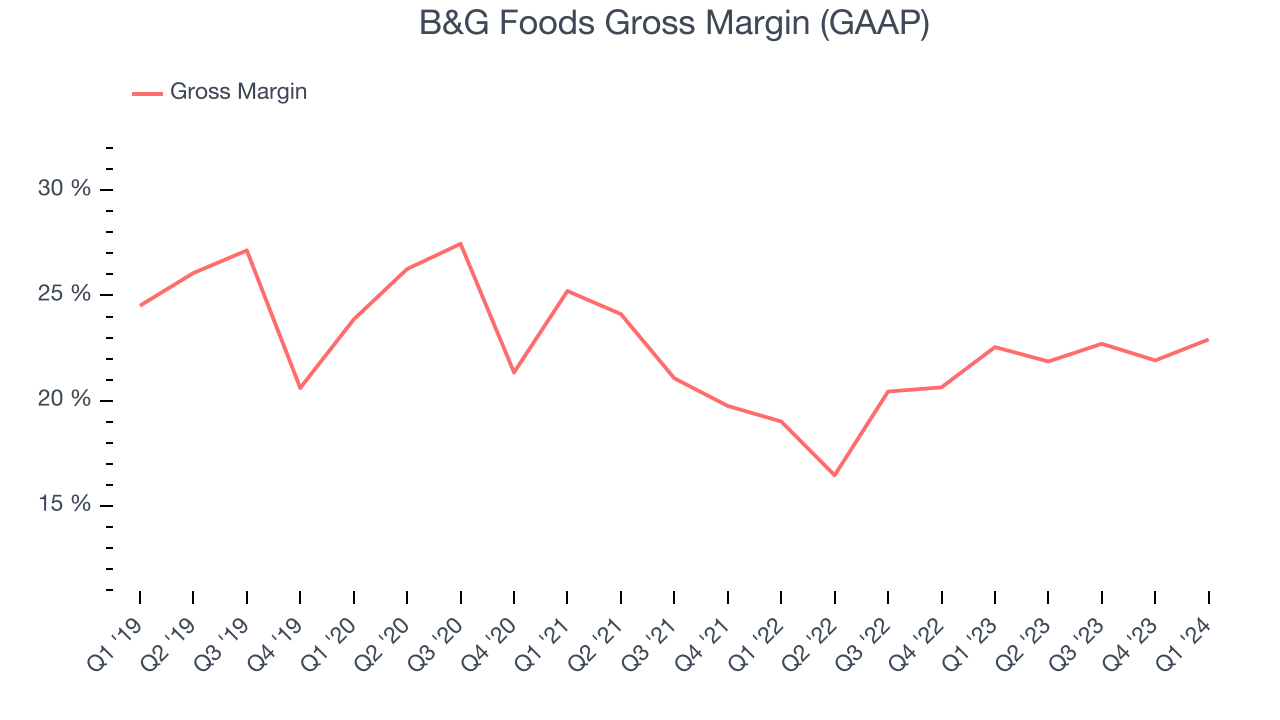
B&G Foods has poor unit economics for a consumer staples company, leaving it with little room for error if things go awry. As you can see above, it's averaged a paltry 21.2% gross margin over the last two years. Its margin, however, has been trending up over the last 12 months, averaging 13% year-on-year increases each quarter. If this trend continues, it could suggest a less competitive environment.
Operating Margin
Operating margin is an important measure of profitability accounting for key expenses such as marketing and advertising, IT systems, wages, and other administrative costs.
In Q1, B&G Foods generated an operating profit margin of negative 3.3%, down 15.4 percentage points year on year. Conversely, the company's gross margin actually increased, so we can assume the reduction was driven by operational inefficiencies and a step up in discretionary spending in areas like corporate overhead and advertising.
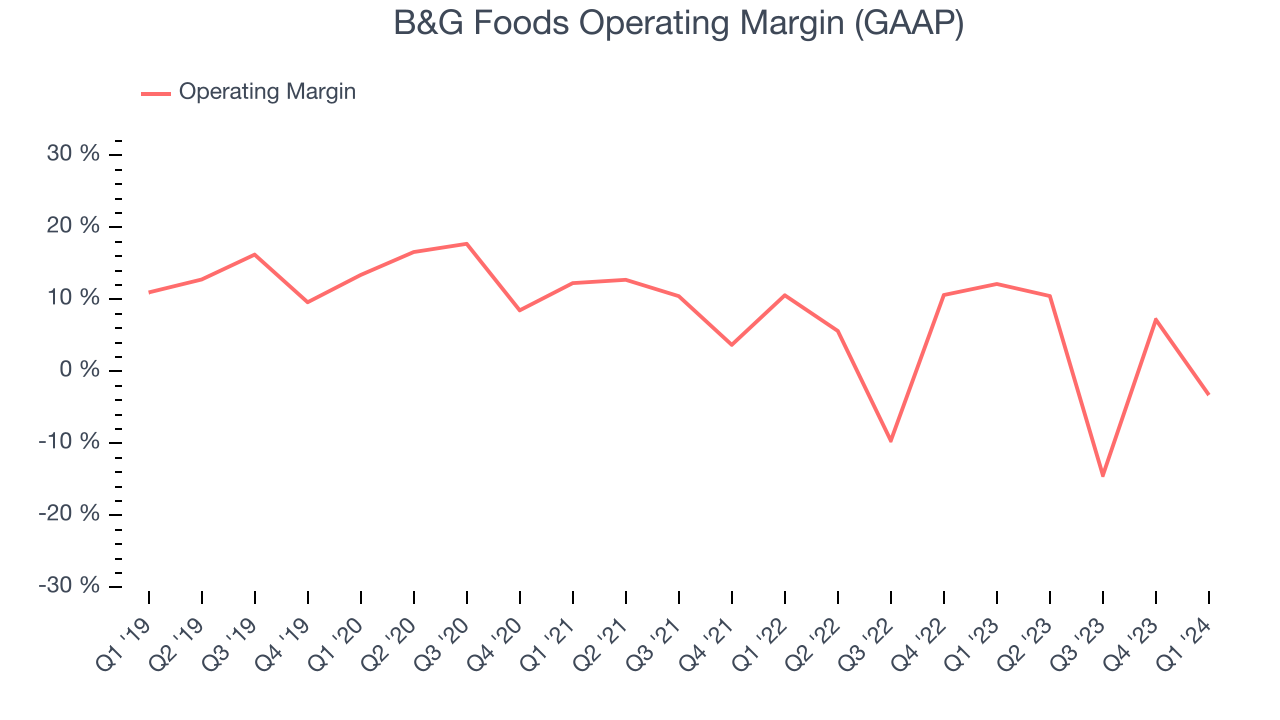 Zooming out, B&G Foods was profitable over the last eight quarters but held back by its large expense base. It's demonstrated subpar profitability for a consumer staples business, producing an average operating margin of 2.6%. On top of that, B&G Foods's margin has declined by 4.7 percentage points on average over the last year. This shows the company is heading in the wrong direction, and investors are likely hoping for better results in the future.
EPS
Earnings growth is a critical metric to track, but for long-term shareholders, earnings per share (EPS) is more telling because it accounts for dilution and share repurchases.
In Q1, B&G Foods reported EPS at $0.18, down from $0.27 in the same quarter a year ago. This print unfortunately missed Wall Street's estimates, but we care more about long-term EPS growth rather than short-term movements.
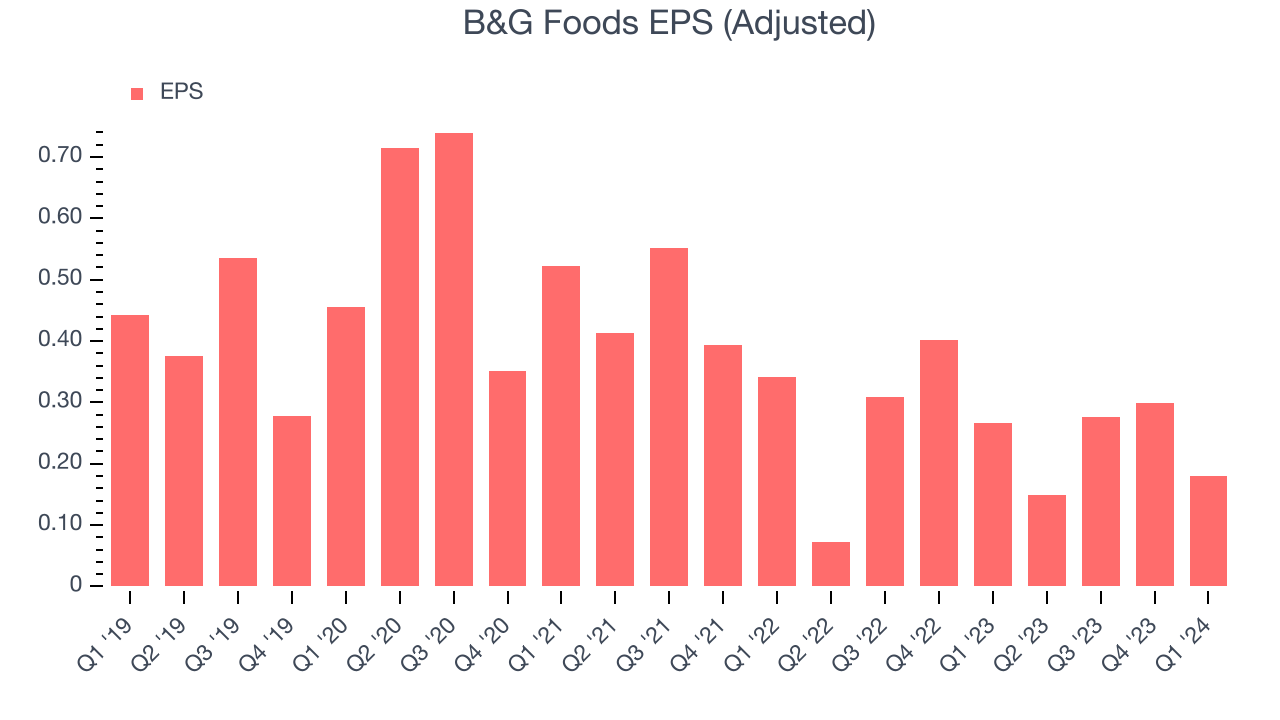
Between FY2021 and FY2024, B&G Foods's EPS dropped 61.2%, translating into 27.1% annualized declines. We tend to steer our readers away from companies with falling EPS, especially in the consumer staples sector, where shrinking earnings could imply changing secular trends or consumer preferences. If there's no earnings growth, it's difficult to build confidence in a business's underlying fundamentals, leaving a low margin of safety around the company's valuation (making the stock susceptible to large downward swings).
Earnings stability could be coming, however, as Wall Street is projecting B&G Foods's EPS to stay flat over the next 12 months.
Return on Invested Capital (ROIC)
EPS and free cash flow tell us whether a company was profitable while growing revenue. But was it capital-efficient? A company’s ROIC explains this by showing how much operating profit a company makes compared to how much money the business raised (debt and equity).
B&G Foods's five-year average ROIC was 4.9%, somewhat low compared to the best consumer staples companies that consistently pump out 20%+. Its returns suggest it historically did a subpar job investing in profitable business initiatives.
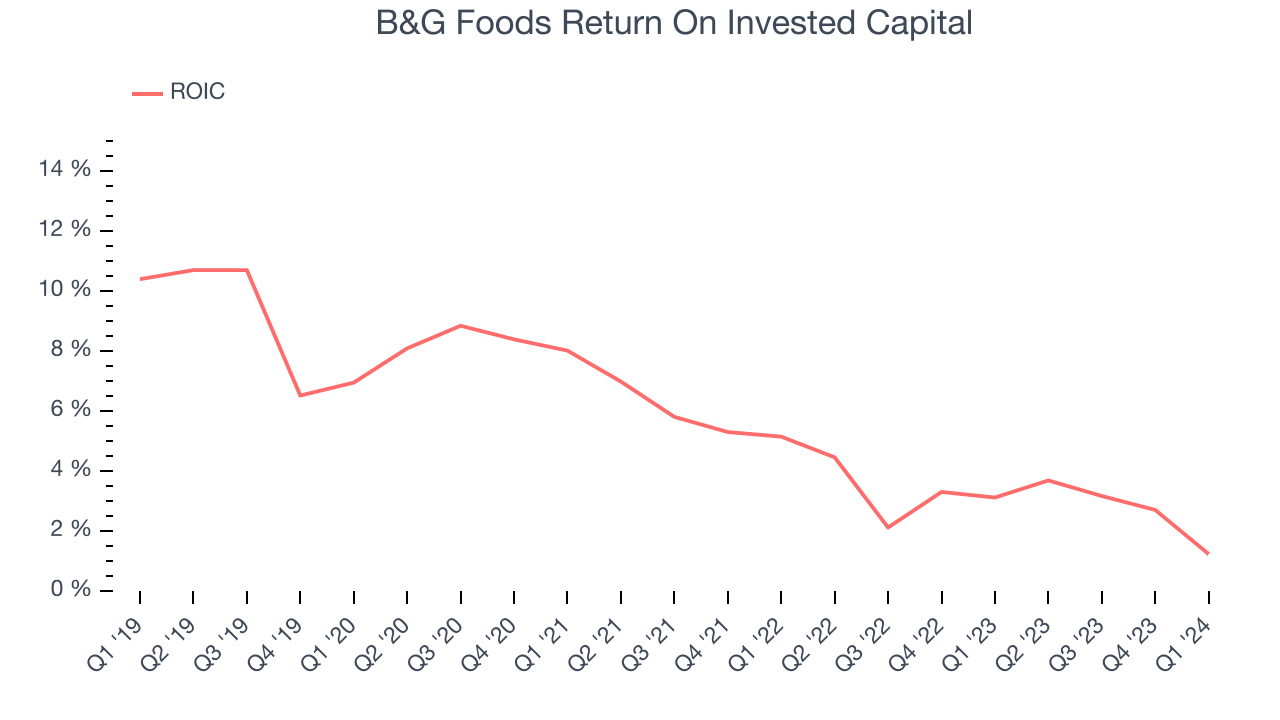
The trend in its ROIC, however, is often what surprises the market and drives the stock price. Unfortunately, B&G Foods's ROIC averaged 5.3 percentage point decreases over the last few years. Paired with its already low returns, these declines suggest the company's profitable business opportunities are few and far between.
Balance Sheet Risk
As long-term investors, the risk we care most about is the permanent loss of capital. This can happen when a company goes bankrupt or raises money from a disadvantaged position and is separate from short-term stock price volatility, which we are much less bothered by.
B&G Foods's $2.04 billion of debt exceeds the $42.46 million of cash on its balance sheet. Furthermore, its 6x net-debt-to-EBITDA ratio (based on its EBITDA of $310.7 million over the last 12 months) shows the company is overleveraged.
At this level of debt, incremental borrowing becomes increasingly expensive and credit agencies could downgrade the company’s rating if profitability falls. B&G Foods could also be backed into a corner if the market turns unexpectedly – a situation we seek to avoid as investors in high-quality companies.
We hope B&G Foods can improve its balance sheet and remain cautious until it increases its profitability or reduces its debt.
Key Takeaways from B&G Foods's Q1 Results
It was encouraging to see B&G Foods slightly top analysts' gross margin expectations this quarter. On the other hand, its revenue, operating margin, and EPS missed Wall Street's estimates as its sales volumes declined 1.4% year on year. Overall, the results could have been better. The company is down 7.4% on the results and currently trades at $10.7 per share.
Is Now The Time?
B&G Foods may have had a tough quarter, but investors should also consider its valuation and business qualities when assessing the investment opportunity.
We cheer for all companies serving consumers, but in the case of B&G Foods, we'll be cheering from the sidelines. Its revenue growth has been weak over the last three years, and analysts expect growth to deteriorate from here. On top of that, its declining EPS over the last three years makes it hard to trust, and its gross margins make it more challenging to reach positive operating profits compared to other consumer staples businesses.
B&G Foods's price-to-earnings ratio based on the next 12 months is 12.8x. While there are some things to like about B&G Foods and its valuation is reasonable, we think there are better opportunities elsewhere in the market right now.
Wall Street analysts covering the company had a one-year price target of $10.14 per share right before these results (compared to the current share price of $10.70).
To get the best start with StockStory, check out our most recent stock picks, and then sign up to our earnings alerts by adding companies to your watchlist here. We typically have the quarterly earnings results analyzed within seconds of the data being released, and especially for companies reporting pre-market, this often gives investors the chance to react to the results before the market has fully absorbed the information.