
Membership-only discount retailer BJ’s Wholesale Club (NYSE:BJ) fell short of analysts' expectations in Q4 FY2023, with revenue up 8.7% year on year to $5.36 billion. It made a non-GAAP profit of $1.11 per share, improving from its profit of $1 per share in the same quarter last year.
BJ's (BJ) Q4 FY2023 Highlights:
- Revenue: $5.36 billion vs analyst estimates of $5.40 billion (0.7% miss)
- EPS (non-GAAP): $1.11 vs analyst estimates of $1.06 (4.6% beat)
- EPS (non-GAAP) guidance for 2024 of $3.88 below analyst estimates of $3.99
- Free Cash Flow of $155.2 million, up 83.2% from the same quarter last year
- Gross Margin (GAAP): 18%, down from 18.3% in the same quarter last year
- Same-Store Sales were up 0.5% year on year
- Store Locations: 244 at quarter end, increasing by 9 over the last 12 months
- Market Capitalization: $9.62 billion
Appealing to the budget-conscious individual shopping for a household, BJ’s Wholesale Club (NYSE:BJ) is a membership-only retail chain that sells groceries, appliances, electronics, and household items, often in bulk quantities.
The company offers these products at lower prices than traditional retailers. In return, customers often have to buy in bulk. BJ’s is able to offer low prices due to its merchandising and purchasing approaches. By offering a more limited selection within categories, it is able to buy larger quantities of what it does carry. This ensures volume discounts from suppliers and lower logistics costs per unit. BJ’s stores also have a no-frills warehouse format that minimizes store operating costs.
BJ’s core customer is the value-conscious suburban shopper who is willing to buy in bulk to save money. These customers must pay for an annual membership, as non-members are not allowed to enter the company’s stores.
The typical BJ’s store is roughly 130,000 square feet. The entrance usually features a customer service desk for membership inquiries, followed by featured bulk items. Beyond this is typically a grocery section, and BJ’s differentiates itself with more fresh food than a typical membership warehouse retailer. Additional sections may include apparel, electronics, and home goods situated towards the back of the store.
Large-format Grocery & General Merchandise Retailer
Big-box retailers operate large stores that sell groceries and general merchandise at highly competitive prices. Because of their scale and resulting purchasing power, these big-box retailers–with annual sales in the tens to hundreds of billions of dollars–are able to get attractive volume discounts and sell at often the lowest prices. While e-commerce is a threat, these retailers have been able to weather the storm by either providing a unique in-store shopping experience or by reinvesting their hefty profits into omnichannel investments.
Competitors that offer groceries and/or other general merchandise in large-format stores include Costco (NASDAQ:COST), Walmart (NYSE:WMT), and Kroger (NYSE:KR).Sales Growth
BJ's is one of the larger companies in the consumer retail industry and benefits from economies of scale, enabling it to gain more leverage on fixed costs and offer consumers lower prices.
As you can see below, the company's annualized revenue growth rate of 10.9% over the last four years (we compare to 2019 to normalize for COVID-19 impacts) was decent as it opened new stores and grew sales at existing, established stores.
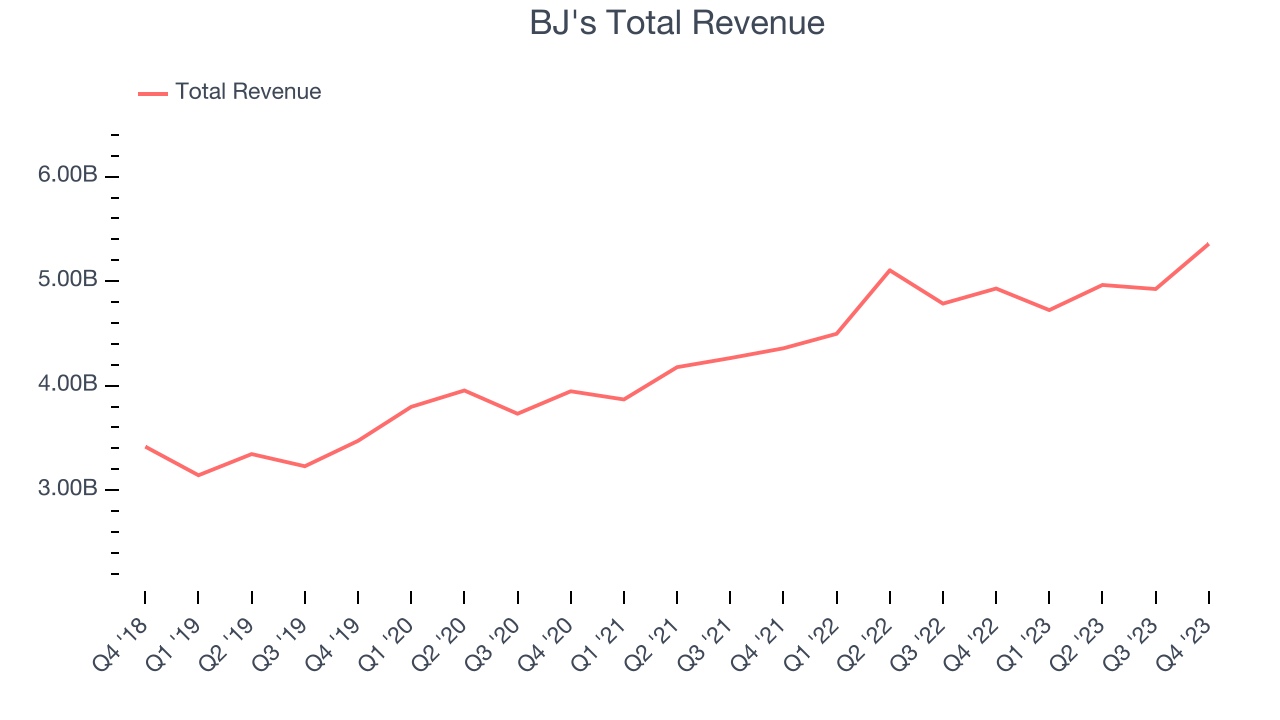
This quarter, BJ's revenue grew 8.7% year on year to $5.36 billion, missing Wall Street's expectations. Looking ahead, Wall Street expects sales to grow 2.8% over the next 12 months, a deceleration from this quarter.
Number of Stores
When a retailer like BJ's is opening new stores, it usually means it's investing for growth because demand is greater than supply. Since last year, BJ's store count increased by 9 locations, or 3.8%, to 244 total retail locations in the most recently reported quarter.
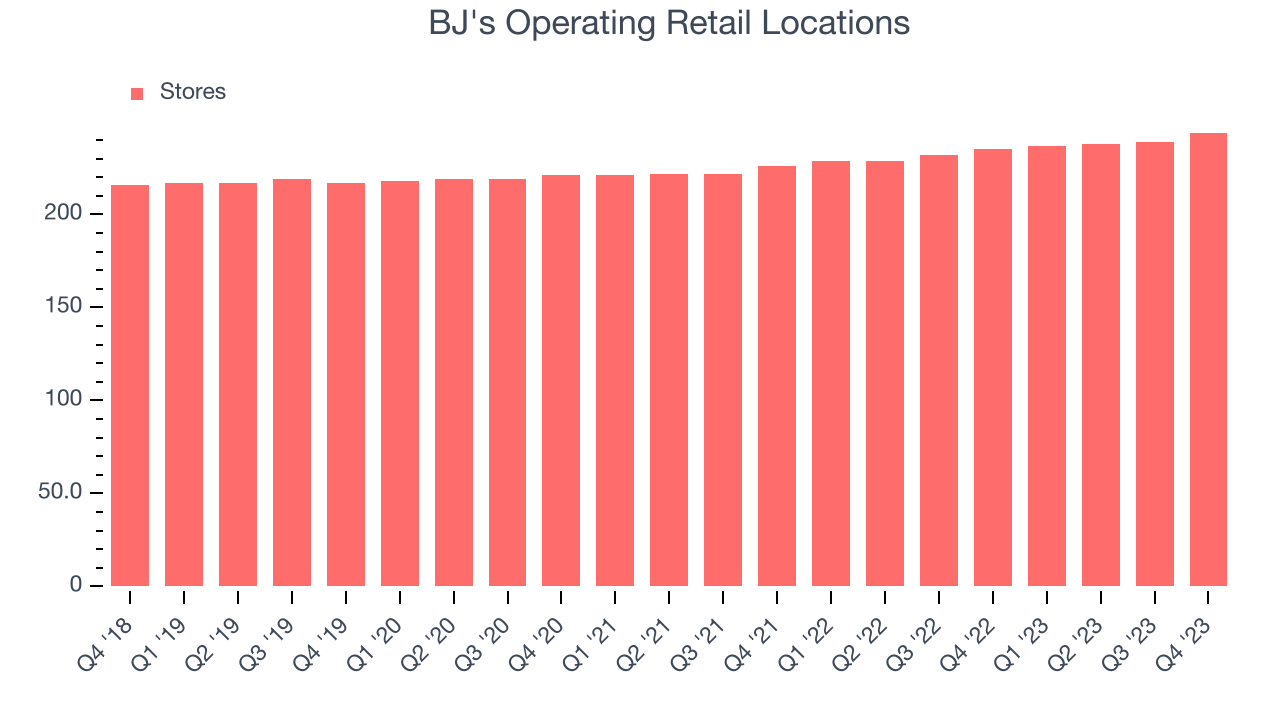
Over the last two years, the company has generally opened new stores and averaged 3.7% annual growth in its physical footprint, which is decent and on par with the broader sector. With an expanding store base and demand, revenue growth can come from multiple vectors: sales from new stores, sales from e-commerce, or increased foot traffic and higher sales per customer at existing stores.
Same-Store Sales
Same-store sales growth is an important metric that tracks demand for a retailer's established brick-and-mortar stores and e-commerce platform.
BJ's demand within its existing stores has generally risen over the last two years but lagged behind the broader consumer retail sector. On average, the company's same-store sales have grown by 4.2% year on year. With positive same-store sales growth amid an increasing physical footprint of stores, BJ's is reaching more customers and growing sales.
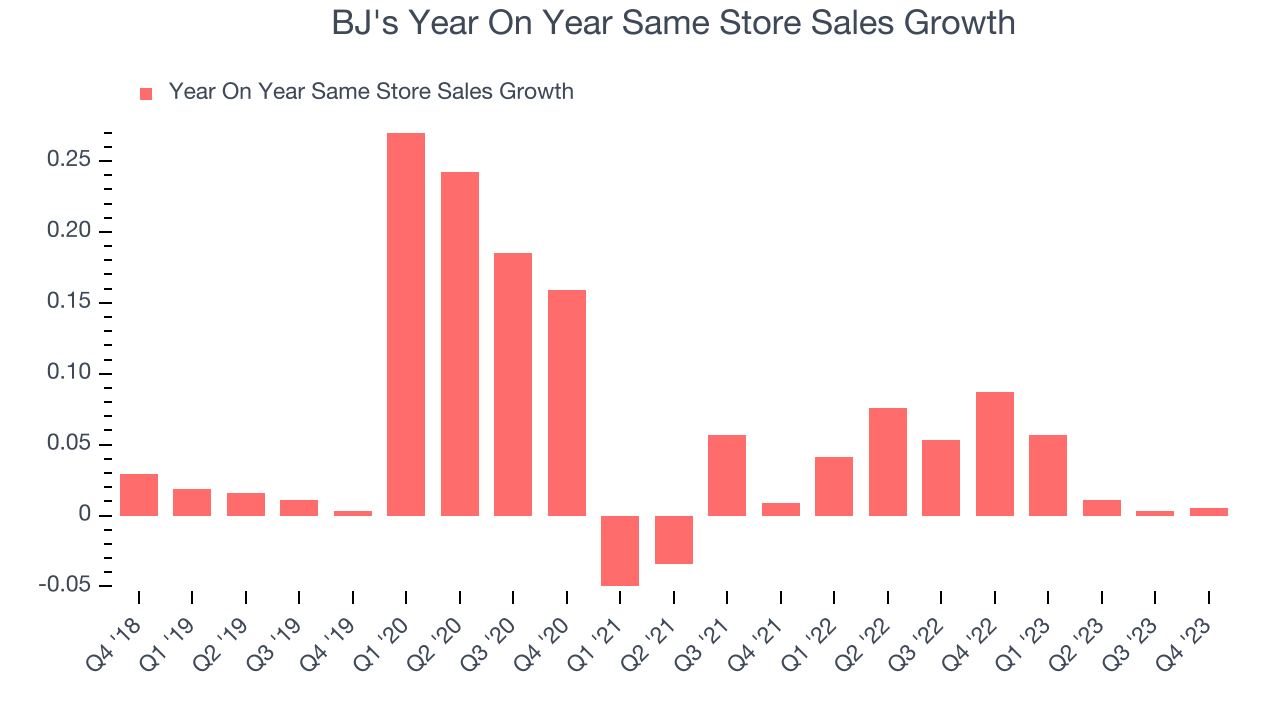
In the latest quarter, BJ's year on year same-store sales were flat. By the company's standards, this growth was a meaningful deceleration from the 8.7% year-on-year increase it posted 12 months ago. We'll be watching BJ's closely to see if it can reaccelerate growth.
Gross Margin & Pricing Power
BJ's has poor unit economics for a retailer, leaving it with little room for error if things go awry. As you can see below, it's averaged a 18% gross margin over the last two years. However, when comparing its margin specifically to other non-discretionary retailers, it's actually pretty decent. That's because non-discretionary retailers have structurally lower gross margins as they compete to provide the lowest possible price, sell products easily found elsewhere, and have high transportation costs to move their goods. We believe the best metrics to assess these types of companies are free cash flow margin, operating leverage, and profit volatility, which take their scale advantages and non-cyclical demand characteristics into account.
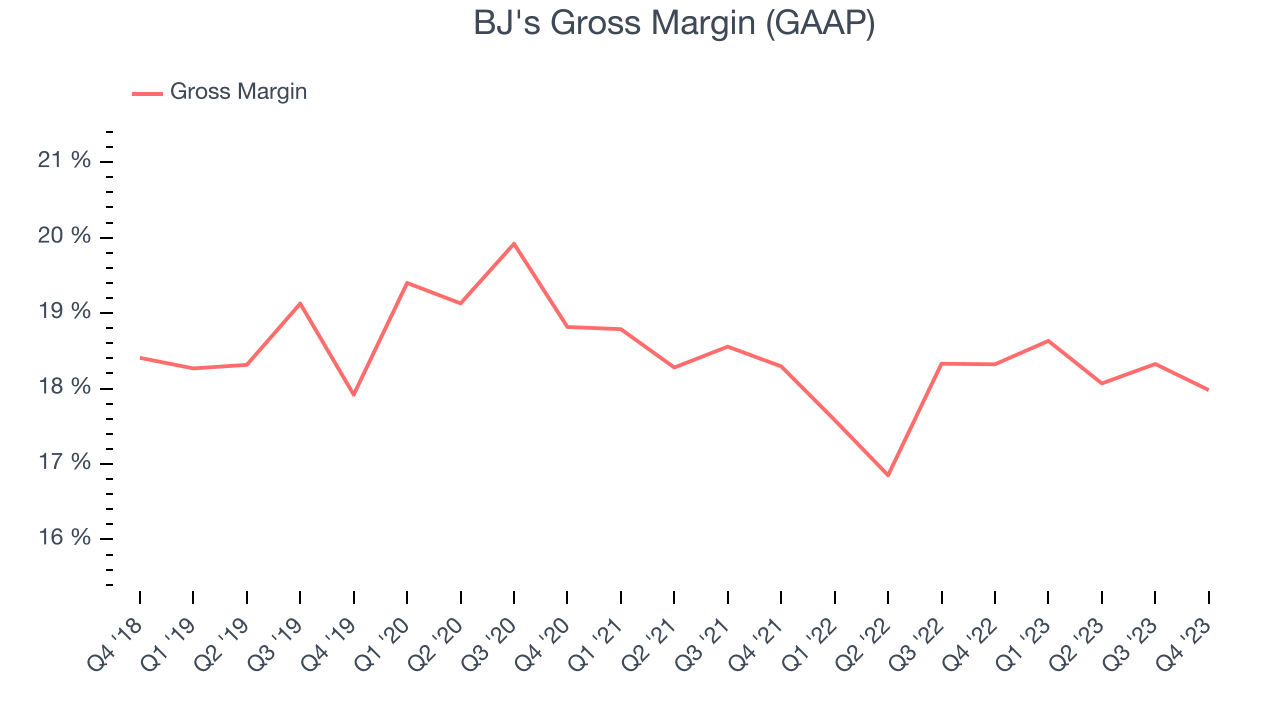
BJ's produced a 18% gross profit margin in Q4, flat with the same quarter last year. This steady margin for a retailer like BJ's, which is structurally less profitable than the typical retail business for the reasons mentioned above, signals that it has stable input costs (such as freight expenses to transport goods) and aims to keep prices low for consumers.
Operating Margin
Operating margin is a key profitability metric for retailers because it accounts for all expenses keeping the lights on, including wages, rent, advertising, and other administrative costs.
In Q4, BJ's generated an operating profit margin of 4%, in line with the same quarter last year. This indicates the company's costs have been relatively stable.
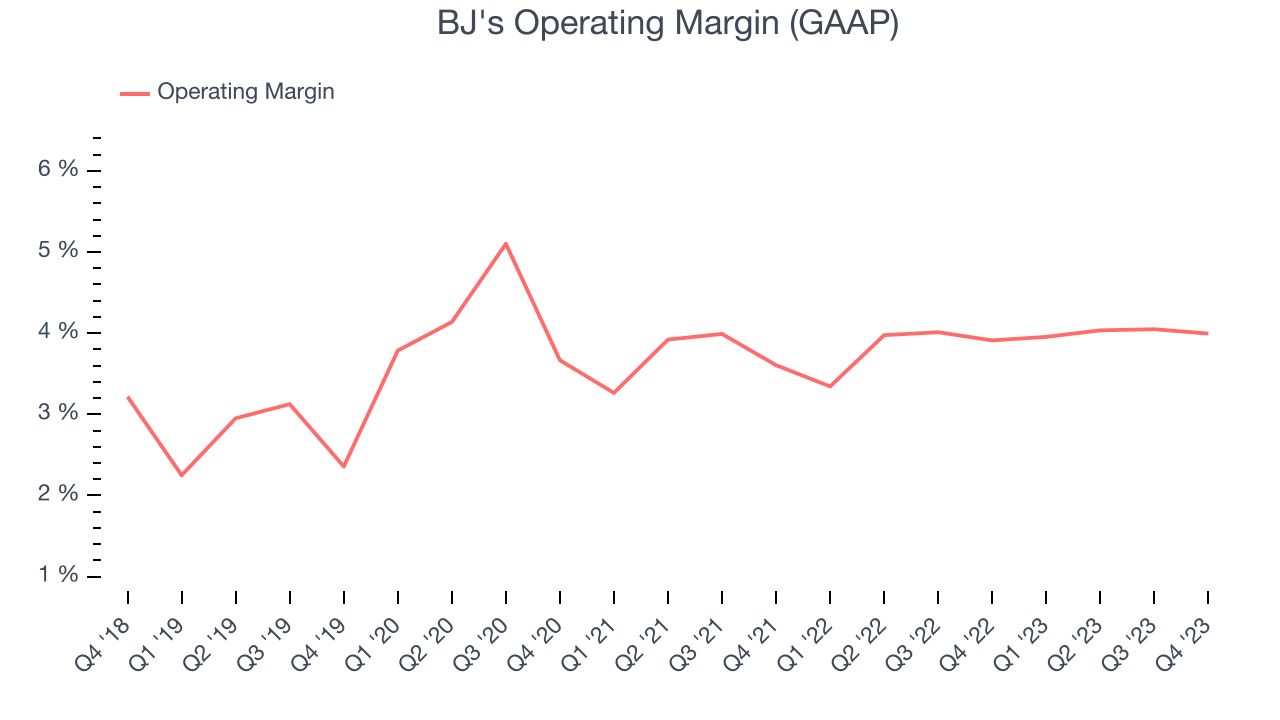 Zooming out, BJ's was profitable over the last two years but held back by its large expense base. Its average operating margin of 3.9% has been paltry for a consumer retail business. Its margin has also seen few fluctuations, meaning it will take a big change to improve profitability.
EPS
Earnings growth is a critical metric to track, but for long-term shareholders, earnings per share (EPS) is more telling because it accounts for dilution and share repurchases.
In Q4, BJ's reported EPS at $1.11, up from $1 in the same quarter a year ago. This print beat Wall Street's estimates by 4.6%.
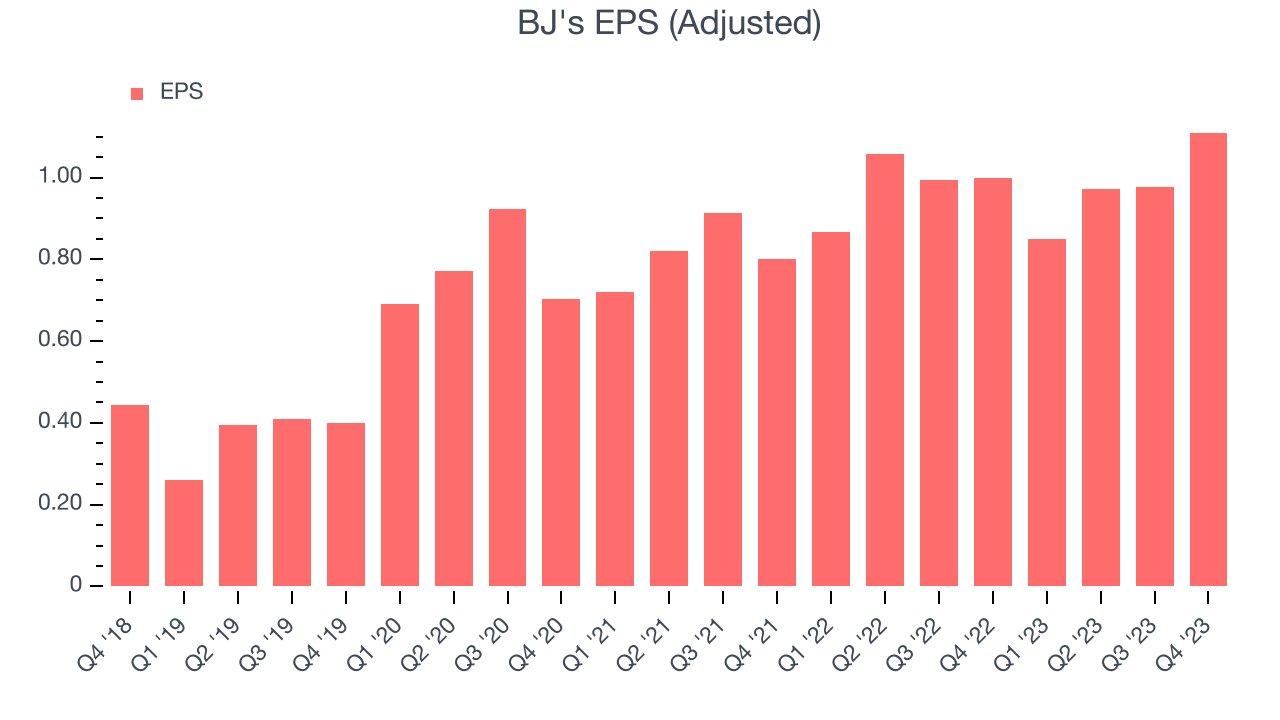
Between FY2019 and FY2023, BJ's adjusted diluted EPS grew 167%, translating into a solid 27.8% compounded annual growth rate. This growth is materially higher than its revenue growth over the same period and was driven by excellent expense management (leading to higher profitability) and share repurchases (leading to higher PER share earnings).
Wall Street expects the company to continue growing earnings over the next 12 months, with analysts projecting an average 2.7% year-on-year increase in EPS.
Cash Is King
If you've followed StockStory for a while, you know that we emphasize free cash flow. Why, you ask? We believe in the end, cash is king, and you can't use accounting profits to pay the bills.
BJ's free cash flow came in at $155.2 million in Q4, up 83.2% year on year. This result represents a 2.9% margin.
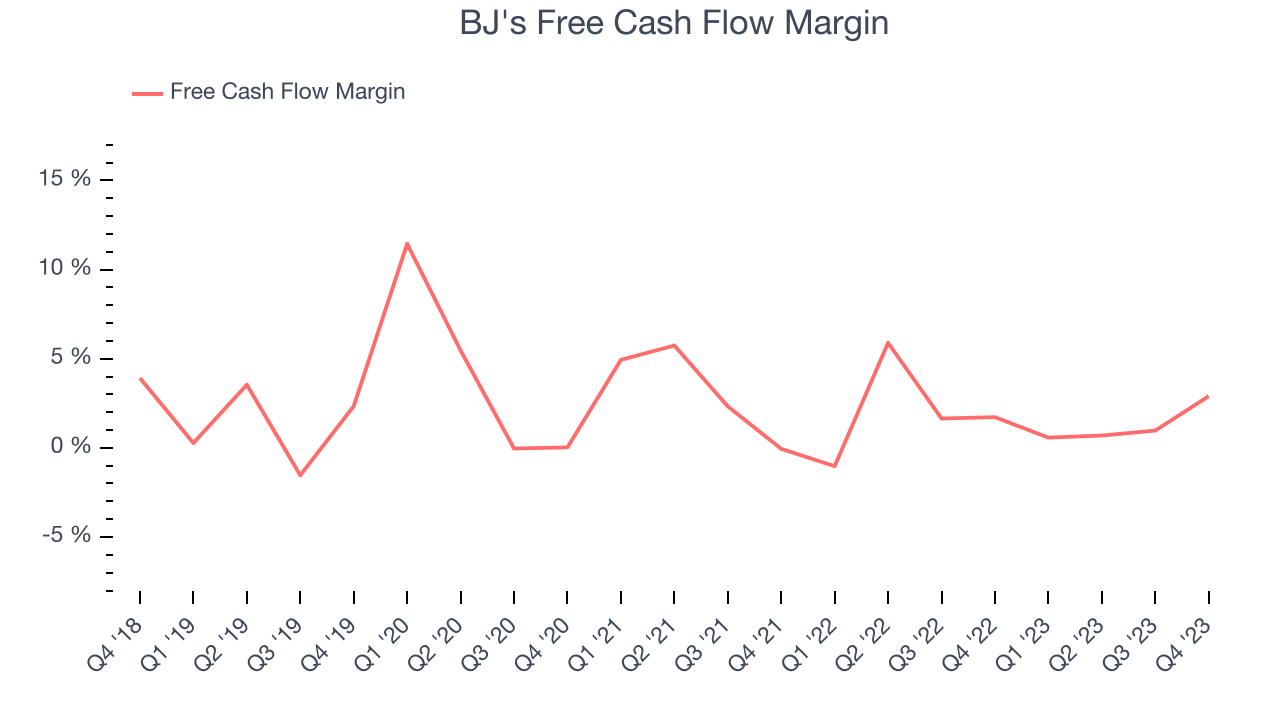
Over the last eight quarters, BJ's has shown mediocre cash profitability, putting it in a pinch as it gives the company limited opportunities to reinvest, pay down debt, or return capital to shareholders. Its free cash flow margin has averaged 1.7%, subpar for a consumer retail business. BJ's margin has also been flat during that time, showing the company needs to take action and improve its cash profitability.
Return on Invested Capital (ROIC)
EPS and free cash flow tell us whether a company was profitable while growing revenue. But was it capital-efficient? A company’s ROIC explains this by showing how much operating profit a company makes compared to how much money the business raised (debt and equity).
BJ's five-year average ROIC was 13.1%, somewhat low compared to the best retail companies that consistently pump out 25%+. Its returns suggest it historically did a subpar job investing in profitable business initiatives.
The trend in its ROIC, however, is often what surprises the market and drives the stock price. Over the last two years, BJ's ROIC averaged 3.5 percentage point increases each year. This is a good sign, and if the company's returns keep rising, there's a chance it could evolve into an investable business.
Key Takeaways from BJ's Q4 Results
It was encouraging to see BJ's slightly top analysts' EPS expectations this quarter. On the other hand, its full-year earnings forecast missed analysts' expectations. Overall, the results could have been better, but the market seems to be shrugging off the negatives. The stock is up 2.5% after reporting and currently trades at $74.14 per share.
Is Now The Time?
BJ's may have had a tough quarter, but investors should also consider its valuation and business qualities when assessing the investment opportunity.
BJ's isn't a bad business, but it probably wouldn't be one of our picks. Although its revenue growth has been decent over the last four years, its gross margins make it more challenging to reach positive operating profits compared to other consumer retail businesses. And while its EPS growth over the last four years has exceeded its peer group average, the downside is its operating margins reveal poor profitability compared to other retailers.
BJ's price-to-earnings ratio based on the next 12 months is 18.0x. We don't really see a big opportunity in the stock at the moment, but in the end, beauty is in the eye of the beholder. If you like BJ's, it seems to be trading at a reasonable price.
Wall Street analysts covering the company had a one-year price target of $74.39 per share right before these results (compared to the current share price of $74.14).
To get the best start with StockStory, check out our most recent stock picks, and then sign up to our earnings alerts by adding companies to your watchlist here. We typically have the quarterly earnings results analyzed within seconds of the data being released, and especially for companies reporting pre-market, this often gives investors the chance to react to the results before the market has fully absorbed the information.